| |
 |
 |
 |
 |
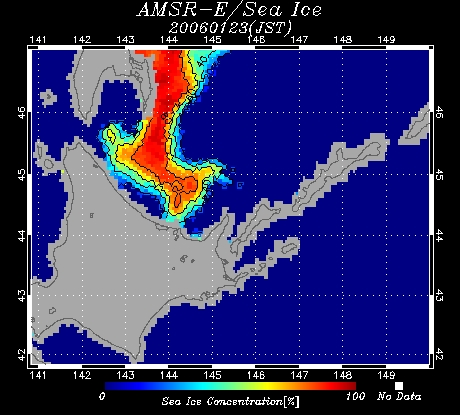
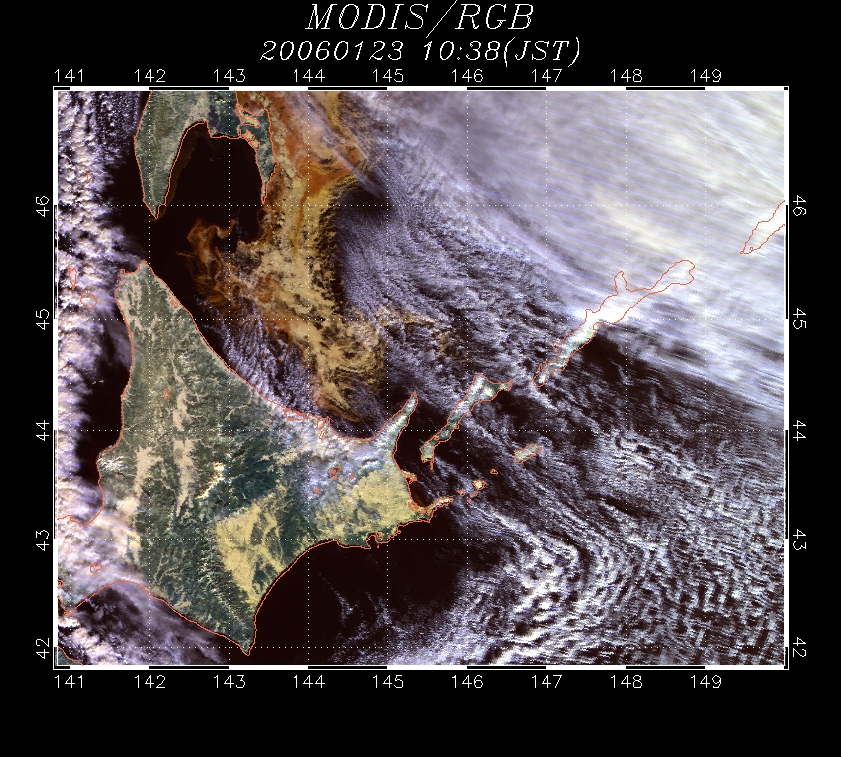
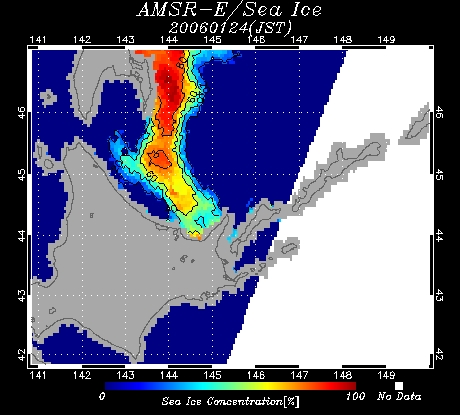
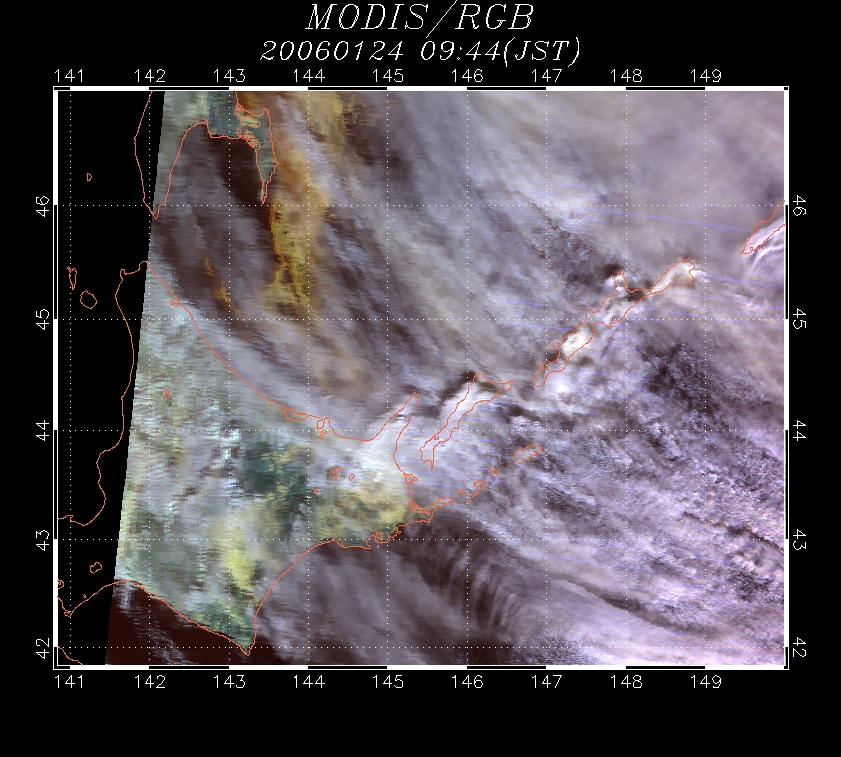
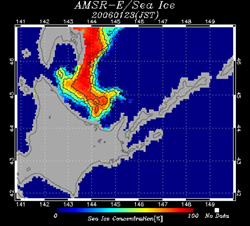
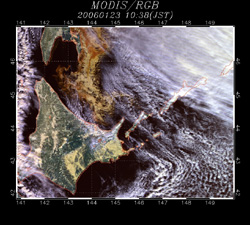
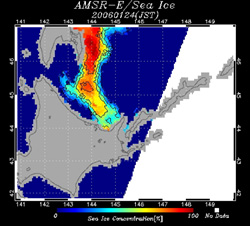
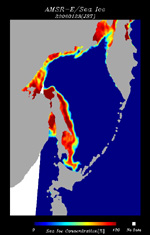
Fig. 1. Sea Ice Distribution in the Sea of Okhotsk
on January 23, 2006 (Upper images) and January 24 (Lower images)
(Left side, AMSR-E; Right side, MODIS)
|
On January 24, the first sea ice of this year reached the coast of Utoro, Shari-cho, a coastal town on the Sea of Okhotsk on the Shiretoko Peninsula, which was added to the list of UNESCO's World Natural Heritage sites last year. Figure 1 depicts the status of the Sea of Okhotsk observed by AMSR-E and MODIS before and after arrival of the pack ice. In the AMSR-E image, the left side of Fig. 1, the red-colored sea ice spreads from off the eastern coast of Sakhalin to the south. In the MODIS image, the right side of Fig. 1, you can see the status of yellow-colored sea ice under the white or bluish gray clouds. The sea ice, which was formed off the Siberian coast in the northwest of the Sea of Okhotsk, 1,000 to 1,500 km north of Hokkaido, flows to the south and nears the coast of Hokkaido carried by the ocean current flowing off the eastern coast of Sakhalin. By looking at the images of AMSR-E, the microwave sensor, which is uninfluenced by the weather, we observe that the sea ice remains far from Shiretoko Peninsula on the day previous to arrival (January 23). However, the northwestern wind quickly swept it to the peninsula on January 24. The feature of the clouds observed by MODIS (an optical sensor) also indicates that the northwestern winds blew strongly on the day of the arrival.
 |
 |
 |
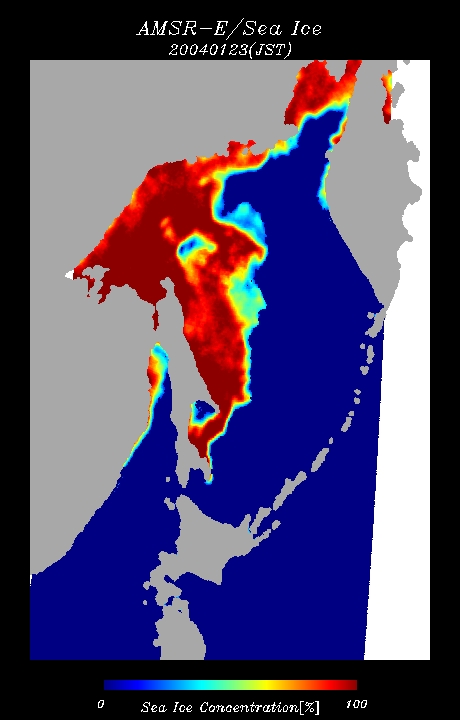
| Fig. 2. January 23, 2004 |
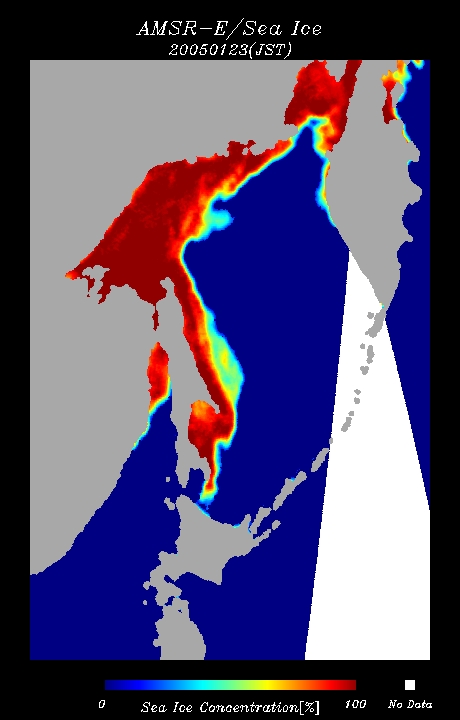
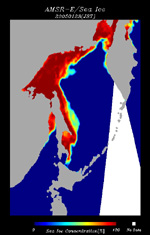
Fig. 3. January 23, 2005 |
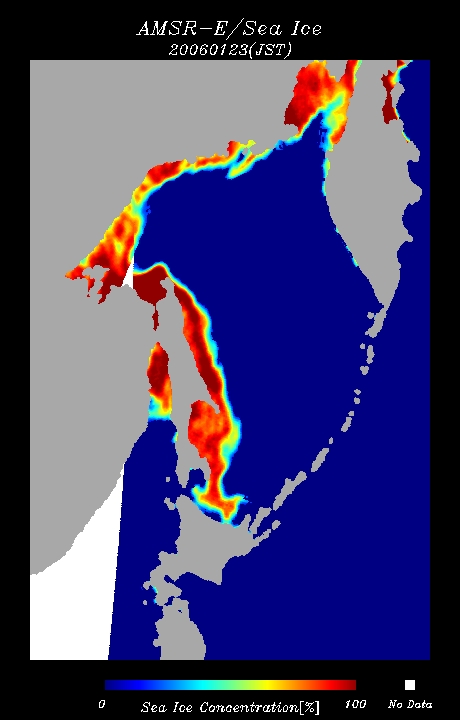
Fig. 4. January 23, 2006 |
Sea Ice Distribution in the Sea of Okhotsk
observed by Aqua/AMSR-E Animation (1.71MB)
|
This winter, a cold wave stronger than usual flowed into the neighborhood of Japan, and Japan is now experiencing a very cold winter nationwide; for example, the nationwide coldest mean-air-temperature in 20 years (since 1985) was recorded last December. However, Figs. 2 to 4 indicate that the sea ice area in the whole Sea of Okhotsk at this time has tended to decrease every year since 2004. Specifically, the sea ice area this year has dramatically reduced compared with that of last year near the Siberian coast in the northwest of the Sea of Okhotsk, the origin of the sea ice. Cold seasonal winds rage in an ordinary year in this area, but AMSR-E data indicates that the average ground temperature in eastern Siberia to windward of last December was higher than that of the average year. This seems to be related to the declining tendency of the sea ice area in the Sea of Okhotsk this winter. (We will introduce the observation result of the ground surface temperature by AMSR-E on this homepage soon.)
The Sea of Okhotsk is the lowest frozen sea in latitude of all the seas in the world. The increase and decrease of the sea ice region is closely related to climate, and this effects the catches of fish around the Islands of Japan. Therefore, it is very important to monitor the growth of the sea ice over the Sea of Okhotsk to know the status and future condition of the global environment.
The latest information on the sea ice extending to the Sea of Okhotsk is released on EORC's homepage "Sea Ice Distribution in the Sea of Okhotsk," which has been updated daily since last November. It includes the image of the sea ice extending over the Sea of Okhotsk and the detailed distribution of sea ice approaching the coast of Hokkaido. Furthermore, you can see the change in sea ice distribution by using the slide-show function.
Explanation of the images:
Fig. 1. (right)
| Satellite: |
EOS- Terra (NASA) |
| Sensor : |
MODIS(NASA) |
| Date: |
January 23 and 24, 2006 |
|
The color composition was made by using 3 of 36 channels on MODIS: channel 4 (545 to 565 nm in the green band) for red, channel 2 (841 to 876 nm in the near infrared band) for green, and channel 5 (1230 to 1250 nm in the shortwave length infrared band) for blue. As a result, you can distinguish the sea ice and clouds because the sea ice is emphasized in a light orange color and clouds are emphasized in white. The resolution of the original figure is 500 m.
|
Fig. 1 left, Figs. 2 to 5, and animation
| Satellite: |
EOS-Aqua (NASA) |
| Sensor : |
Advanced Microwave Scanning Radiometer for EOS (AMSR-E) (JAXA) |
| Date: |
January 23 and 24, 2006 (Fig. 1. left)
January 23, 2004 (Fig. 2)
January 23, 2005 (Fig. 3)
January 23, 2006 (Fig. 4)
December 1, 2005 to January 30, 2006 (Animation)
|
|
These figures present the sea ice concentration calculated based on the algorithm developed by Dr. Josefino C. Comiso from NASA GSFC, one of the Principal Investigators (PIs) for AMSR/AMSR-E algorithm development, by using 36.5-GHz horizontal and vertical polarization data and 18.7-GHz horizontal and vertical polarization data among six observational frequencies of the AMSR-E. The above images indicate the sea ice concentration estimated from the data acquired by AMSR-E. Sea ice concentration is the ratio of ice cover per unit area. The open water area is 0% and the sea-ice covered area is 100%. Areas with low sea ice concentration are light blue and change to yellow and orange corresponding to higher concentrations, with the highest sea ice concentration displayed as red or deep vermilion. The land is gray, the open water surface (sea surface) is deep blue, and no data is white. The spatial resolution is approximately 15 km.
|
|
 |
|