ページの先頭です。
本文へジャンプする。
【Important Notices】This page is an archive page of information published in the past. Since the update has been completed, it may contain broken links or outdated information. For the latest information, please use the new site Earth-graphy (earth.jaxa.jp).
ここからサイト内共通メニューです。
サイト内共通メニューを読み飛ばす。
サイト内共通メニューここまで。
ここから本文です。

Seen from Space 2006

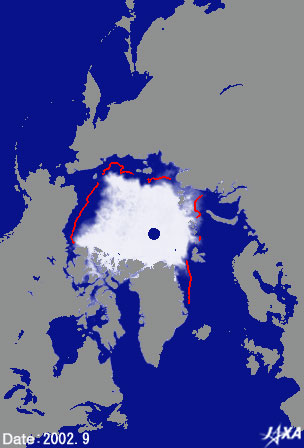
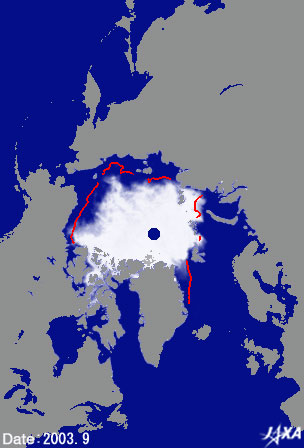
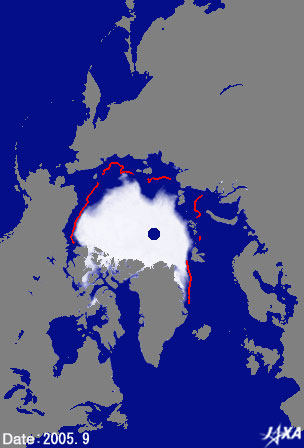
Sea ice in the Arctic Ocean continues to recede. In 2005 it reached its smallest extent since observation began by spaceborne microwave radiometers.

  Over the past several years, the distribution of summer sea ice in the Arctic Ocean has diminished. (see our topic, "Will a Tour of the North Pole by Dog Sledge be Possible?" Reduction of Sea Ice in the Arctic Circle, as Seen from Space.) Now, according to a recent report from the summer of 2005, the extent of sea ice is smaller than at any time in the history of microwave space observation.

Fig. 1. Distribution of sea ice in the Arctic Ocean for September of the past four years
Figure 1 demonstrates the change in appearance of the Arctic Ocean in September over the past four years, seen through observations from AMSR-E and in sequence from left to right. September is the month when the sea ice extent in the Arctic Ocean is at its minimum. A red line shows the mean edge*1 of the sea ice for Septembers in the past. Although various changes are noticeable from year to year, each year the sea ice decreases beyond the past mean value. Russia's sea ice in the figure has decreased greatly this year, and the unfrozen sea surface spreads out further than last year.

The sea ice extent in the Arctic Ocean in Septembers around 1980 was approximately 7.5 million km2, but the sea ice extent has decreased gradually with fluctuating a little year to year *2. It recorded minimum in the observation with approximately 5.3 million km2 in September 2005 after approximately 6.0 million km2 in September 2004. Satellite microwave observation of sea ice in the Arctic Ocean has been carried out continuously since 1978.

The distinguishing feature of the sea-ice change this year is that it began to decrease earlier than usual and continued to decrease well past the latest recorded time (the end of September). This year, again, there was not enough recovery of the sea ice over the winter. The decline in sea ice continued to reach new low levels in the history of observation since December 2004 except for May 2005.

This is a difficult phenomenon to explain by ideas from the past, such as Arctic oscillation, and there is some thought that global warming may influence.

Sea ice is not easily warmed because it strongly reflects sunlight. In contrast, the sea surface warms easily by absorbing sunlight. The air temperature rises and the sea ice decreases faster if the area of the sea ice decreases and the area of the sea surface increases because the heat absorbed by the Arctic increases. Over the past ten years, the normal temperature of the Arctic circle rose 2 to 3°C above the normal temperature of the previous 50 years, and since 2002 the thaw has begun 2 to 3 weeks earlier in Alaska and Siberia. These phenomena cause great concern about the influence on the climate and the ecosystems.

In the future, JAXA will continue to report on this phenomenon and its effect on climate change by using spacecraft observation.


*1 The mean edge of sea ice extent in past Septembers processed by the National Snow and Ice Data Center. This analysis used monthly averages in September from 1988 to 2000. Thirteen data exist during this period. In analyzing the mean edge, one pixel, covered by sea ice (the sea ice extent is more than 15%) for more than half of the existing 13-data, is considered one pixel of sea ice, and a red line delineates the edge of the sea-ice extent.
The gross area of the extent of sea ice was calculated as the sum of the pixels of sea ice (ones pixel is approximately 625 km2 wide). It was hypothesized that the area of "no data" around the North Pole is wholly covered by sea ice.

*2 Past sea ice extent
Sea Ice Index (NSIDC)
Improving our Understanding of Climate Change - Observing our Water Planet using AMSR and AMSR-E - (see 4. Sea Ice and Climate)

Reference sites:
LIFE ON EARTH: NASA Watches Arctic Ice (NASA)
NSIDC NEWS: Sea Ice Decline Intensifies (NSIDC)
Image Derivation (NSIDC)

Explanation of images:
Fig. 1
Satellite: EOS-Aqua (NASA)
Sensor: Advanced Microwave Scanning Radiometer for EOS (AMSR-E), (JAXA)
Date : September 2002; September 2003; September 2004; September 2005
Figure 1 shows the calculated concentration of sea ice based on the algorithm developed by one of the Principal Investigators (PI) for AMSR/AMSR-E algorithm development, Dr. Josefino C. Comiso from NASA GSFC. The calculation uses 36.5-GHz and 18.7-GHz horizontal and vertical polarization data for six observational frequencies of the AMSR-E. The spatial resolution of Fig. 1 data is approximately 25km.

Related sites:
"Will a tour of the North Pole by dog sledge be possible?" The Reduction of Sea Ice in the Arctic Circle, Seen from Space
Relief of the Arctic: Earth, Floating Ice, and Seafloor by MODIS
Cryosphere, Seen from Space
AMSR/AMSR-E

Appendix: Arctic oscillation and sea ice
The strength of the west wind surrounding the North Pole changes in a cycle over several years (Arctic oscillation), affecting the increase and decrease of sea ice in the Arctic Ocean. Sea ice tends to decrease when the west wind becomes stronger.
In the decade of the 1990s, the west wind was strong and the decrease of sea ice was attributed to the Arctic oscillation.
The west wind weakened but the sea ice continued to decrease in the first decade of the 2000s, so we need to find another explanation for the decrease.
本文ここまで。
image:Satellite Navigator
image:Satellite Applications and Operations Center(SAOC)
Earth Data Collection by JAXA Satellites
image:ページTOP