Seen from Space 2005
"Will a tour of the North Pole by dog sledge be possible?" The reduction in sea ice of the Arctic Circle
Figure 1 presents an animated movie of the yearly transition of the Arctic Ocean sea ice. The movie is composed of pictures captured by microwave instrument AMSR-E (aboard NASA's Aqua satellite). The observed sea ice represented in Fig. 1 is the white area in the center. The land is gray, and the sea surface is blue. Due to orbit limitations, Aqua cannot observe ground points close to the North Pole. The blue hole in the center of Fig. 1 represents a lack of data from the area around the North Pole. The sea ice of the Arctic Ocean consists of frozen salt seawater diluted with fresh water that comes mainly from rivers of the continents around the Arctic Ocean. The quantity changes significantly with the yearly transition of temperature.
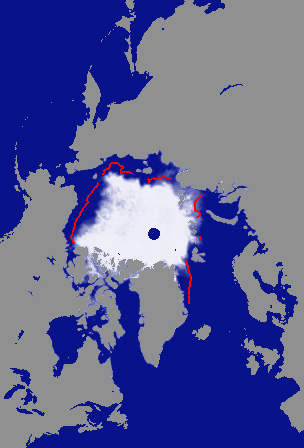
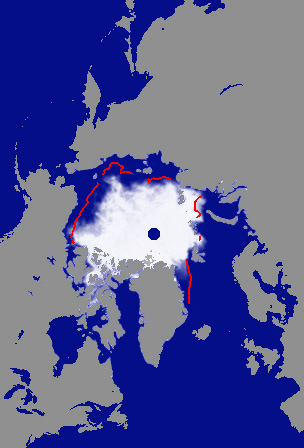
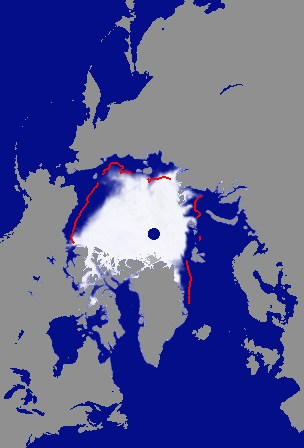
Fig. 2 depicts the monthly average of sea ice concentration of the Arctic Ocean in September. The picture for 2002 is on the left, 2003 in the center, and 2004 is on the right. Yearly sea ice concentration decreases most in September. Red lines in Fig. 2 represent the boundary of the monthly average of sea ice concentration in September 1988 to 2000, as reported by the National Snow and Ice Data Center, USA. Fig. 2 shows that the concentration became smaller in 2002-2004 than past averages, and the sea surface wedged between sea ice and the coasts of surrounding continents. In summer, it was difficult to run the whole distance between the continent and the North Pole by dog sledge as past explorers have done. The concentration of sea ice of the Arctic Ocean has decreased continuously for the last several years. Global warming, the increase of greenhouse gases (carbon dioxide, and methane), is estimated to be the cause the decrease of sea ice, and this decrease has become more obvious in recent years. Last year, scientists of the Department of Defense issued a drastic prediction that the whole sea ice of the Arctic Ocean may melt away during the summer of the year 2010. Scientists are studying this decrease of Arctic Sea ice to determine if we will be able to stand on the North Pole in summer, and to estimate the impact on global climate changes through the transition of the ocean current. If, for instance, all sea ice vanishes from the Arctic Ocean during the summer it could weaken the global oceanic circulation named *"Thermohaline Circulation" or "Broecker's Conveyor Belt." As a result of this weak circulation, warm ocean currents such as the Gulf Stream and North Atlantic Ocean Current will become weaker and will no longer reach Europe. The existing warm climate of Europe depends heavily on this warm current. Scientists estimate that the climate of Europe will become very cold like that of Siberia. There are also estimated changes in global distribution of heavy rain regions, arid regions, and expansions of global hot regions. Global climatic change significantly affects human culture and lifestyle. JAXA will continue to monitor such trends of climatic change using Earth-observation satellites.
Related sites: Appendix:Thermohaline Circulation (Broecker's Conveyor Belt) At the sea surface, a global ocean warm current flows from the North Pacific Ocean via the India Ocean, passes offshore of the Cape of Good Hope, and links the Atlantic Ocean to the Arctic Ocean. With its arrival in the Arctic Circle at off the shore of the Scandinavian Peninsula, sea ice there significantly affects the warm current. Sea ice comes from seawater with low salt content, but sea water around sea ice becomes thick and heavy with salt content due to the salt discharged from sea ice. The warm surface current mixes with this thick and heavy sea water, gets cooled from sea ice, settles to the bottom of the Atlantic Ocean, and becomes a cold, deep current. This cold, deep current then streams to the south, turns to the East at off the shore of the Cape of Good Hope, and reaches the North Pacific Ocean via New Zealand. This global sea water circulation is called "Thermohaline Circulation" or "Broecker's Conveyor Belt" after it's discoverer Dr. Wallace S. Broecker. It is estimated that it will take about 2 thousand years for this circulation to come full circle. This huge sea water circulation works as a heat pump for the Earth, transporting heat from the equatorial region to the cold polar region. Through the changing of warm surface current to cold deep current, sea ice of the Arctic Ocean supplies power to this circulation. |
|||||||||||||||||||||