Seen from Space 2005
Kanto & Tokai districts the day after Tropical Storm "Banyan"
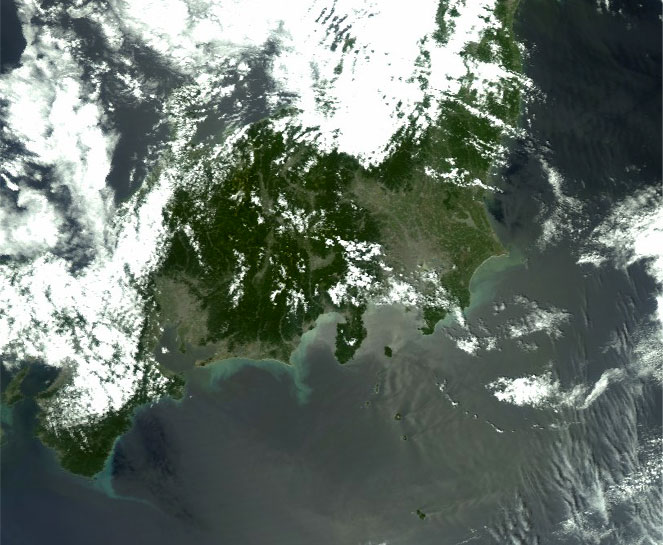
Figure 1 depicts Kanto & Tokai districts and Kii Peninsula observed by MODIS on the day after Tropical Storm T0507 "Banyan" made the first landing of this year (2005). Although some clouds still remain, it is fine from the Kanto District to the Chubu District. When you look at the coastal areas of the Pacific side, you can see that a large quantity of soil and sand flowing out of the swollen rivers. The coastal areas are discolored from the heavy rain of the storm.
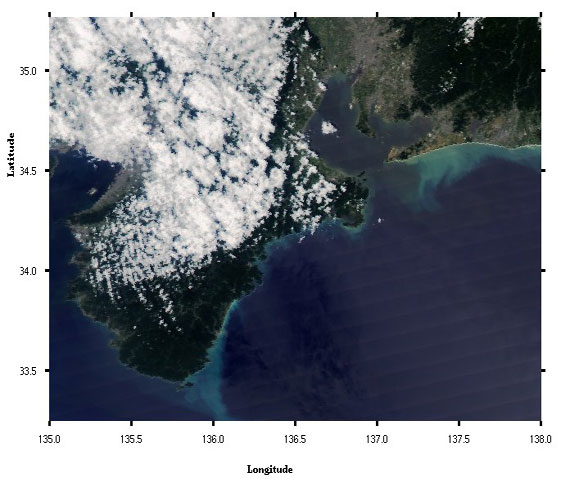
Fig. 2 is an expanded image of the area from Lake Hamana to Kii Peninsula. The figure shows that the sea water is muddy in the coastal area of the Pacific side of the Atsumi Peninsula and in the southern half of the coastal area of the Kii Peninsula facing the Sea of Kumano. The Central Japan International Airport (Centrair) can be seen in the center right of the image and the Kansai International Airport is on the left .
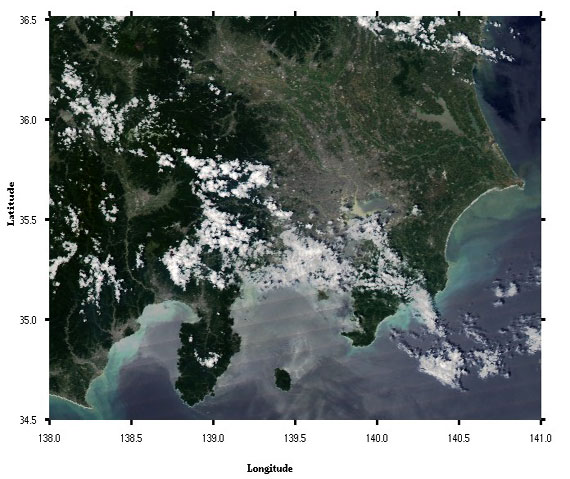
Fig. 3 is an expanded image of the area from the Boso Peninsula to the Gulf of Suruga. The figure indicates that a large amount of soil and sand has flown from the Gulf of Suruga on the lower left to the Pacific side of the Boso Peninsula on the right. It is hard to see the state of the sea surface in the Gulf of Sagami near the bottom of the figure due to some scattered clouds and the direct reflection of sunlight. Lake Kasumigaura looks brownish gray, indicating that the water is muddy. The brownish gray muddy water flows down the Arakawa River and spreads from the river mouth to the triangle in Tokyo Bay. One of characteristics of the Tropical Storm Banyan was that the strong wind area, with a wind of more than 15 m/sec, was very large. The diameter of the strong wind area was 1,000 km just before reaching land with an area reaching 1,500 km at it's widest. The accumulated precipitation data, derived from AMeDAS data provided by the Japan Weather Association, from 1200 (JST) on July 25 to 0600 (JST) on July 27 before and after the Tropical Storm Banyan passed, is as follows.
This data indicates that heavy rain swelled the rivers and caused a large quantity of soil and sand to be carried out to the sea.
Related sites: (Proceed to "500 m" then to "Tokyowan" and "Isewan.") |
||||||||||||||||||||||||||||||||||||||||