Seen from Space 2005
Observing Forests with Synthetic Aperture Radar
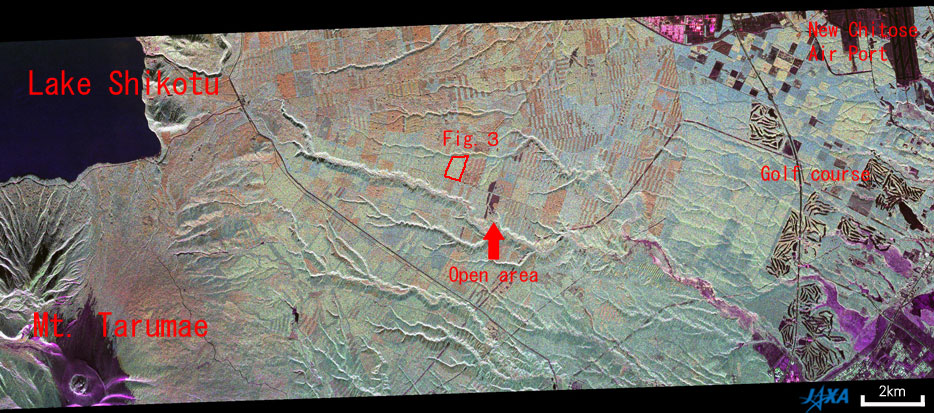
Figure 1 depicts forests in northwest Tomakomai, Hokkaido, observed by Airborne L-band SAR radar (PiSAR*1) at a wavelength of 23.6 cm. The image includes the National Forest and the Hokkaido University Forest, which are mainly larch, two kinds of spruce (Japanese Aka-ezomatu, Ezo-matsu), one fir (Japanese Todo-matsu), and some broadleaf trees. The rectangular area seen in Fig. 1 and expanded in Fig. 3 represents one forest stand. The black areas seen in the upper left and upper right are Lake Shikotsu and New Chitose Airport. The downtown area of Tomakomai is to the lower left.
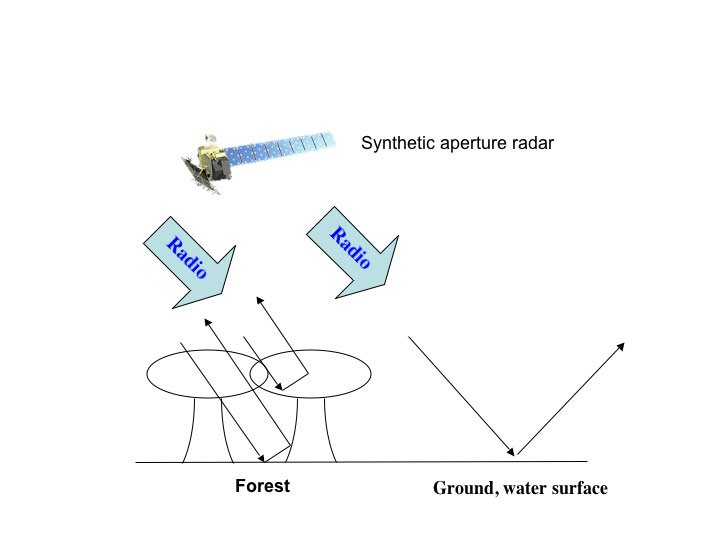
Satellite radio sensors use synthetic aperture radar (SAR) to transmit radar signals to the earth from their antennas. We use the backscattered signals from the ground to assemble an image. Because the radar signals can penetrate clouds, SAR makes observations even on cloudy or rainy days. The radar signal cannot return in the direction of the antenna over open areas or water surfaces, and those areas of the image are dark (Fig. 2). When radar illuminates forested areas, the signal interacts with the trees, reflecting some of the signal back in the direction of the antenna. Color variation in the forest areas is due to the variations in backscattering intensity, depending on the number and species of trees (see "Explanation of the Image" below). These characteristics of the L-band SAR data can be used to detect deforestation and to estimate forest biomass.
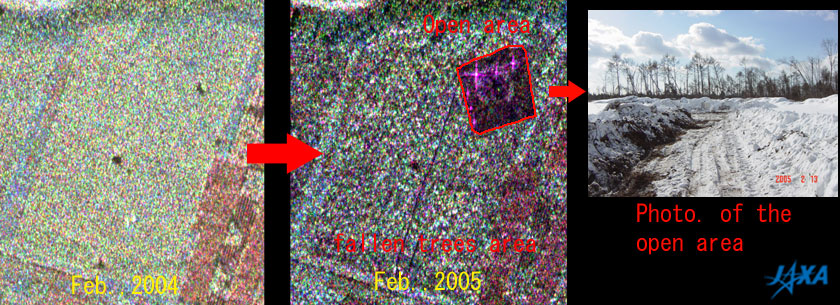
An intense typhoon, 200418 (SONGDA), struck Hokkaido on September 7, 2004,and many trees were felled by the strong winds(*2). Almost all the trees in the area seen in Fig. 4 were felled, and those areas of the image are dark. The red square in Fig. 4 shows the area where the fallen trees were removed, creating an open area (Fig. 5). (Pink highlights in the open area are caused by the calibration device.) L-band SAR (PALSAR) will also be carried aboard the Advanced Land Observing Satellite (ALOS), which JAXA has scheduled for launch this year (2005). Using the L-band SAR, JAXA and other users will examine the status of the world's forests. The study done in Tomakomai has been cooperated with the National Institute for Environmental Study. (*1)Pi-SAR is an airborne synthetic aperture radar. It consists of X-band SAR from the National Institute of Information and Communications Technology (NICT) and L-band SAR from the Japan Aerospace and Exploration Agency (JAXA). Details and the image library acquired by SAR are available at "Pi-SAR (L-band) - About Pi-SAR (Japanese only)". (*2)Typhoon 195415 struck this area from September 25 to 27, 1954, and leveled trees at this that time.
Related sites: |
|||||||||||||||||||||||||