Seen from Space 2005
Meteorological Disasters Observed by TRMM:Highlights of 2004
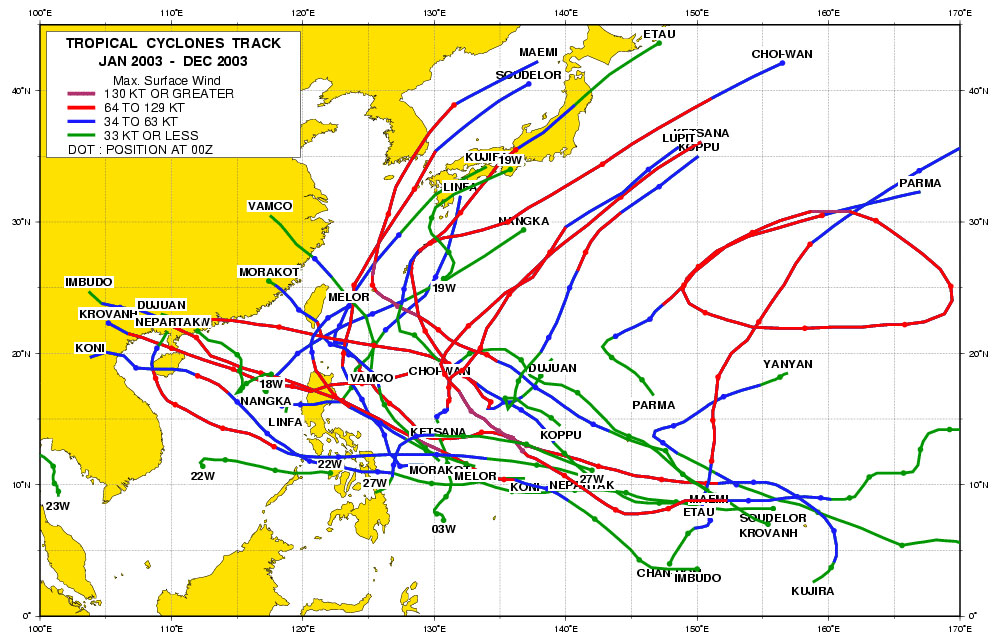
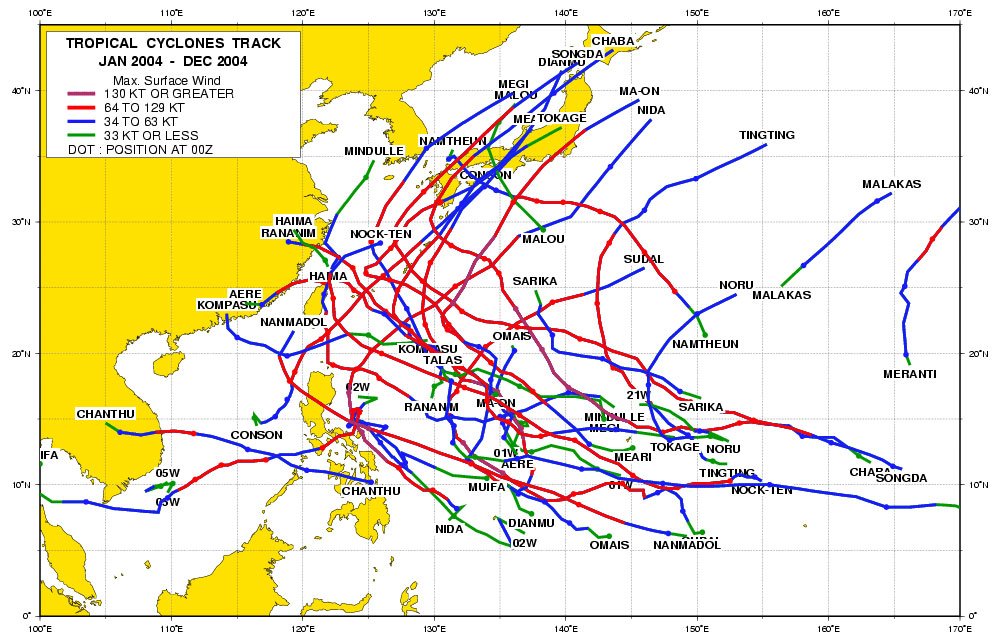
Last summer and autumn, heavy rainfall caused by record concentrated downpours and typhoons set off flooding and landslides in Japan. According to statistics issued by the Japan Meteorological Agency, ten typhoons struck land (there are 2.6 in an average year), significantly eclipsing the previous record, whereas the frequency of appearance was normal. These storms killed around 200 people. Figure 1 indicates typhoon tracks in 2003 and Fig. 2, those in 2004. A number of typhoons hovered over Japan's main island and Okinawa in 2004. The unusual courses of the typhoons were attributable to the anomalous location of the Pacific anticyclone, which had shifted further northward than usual.
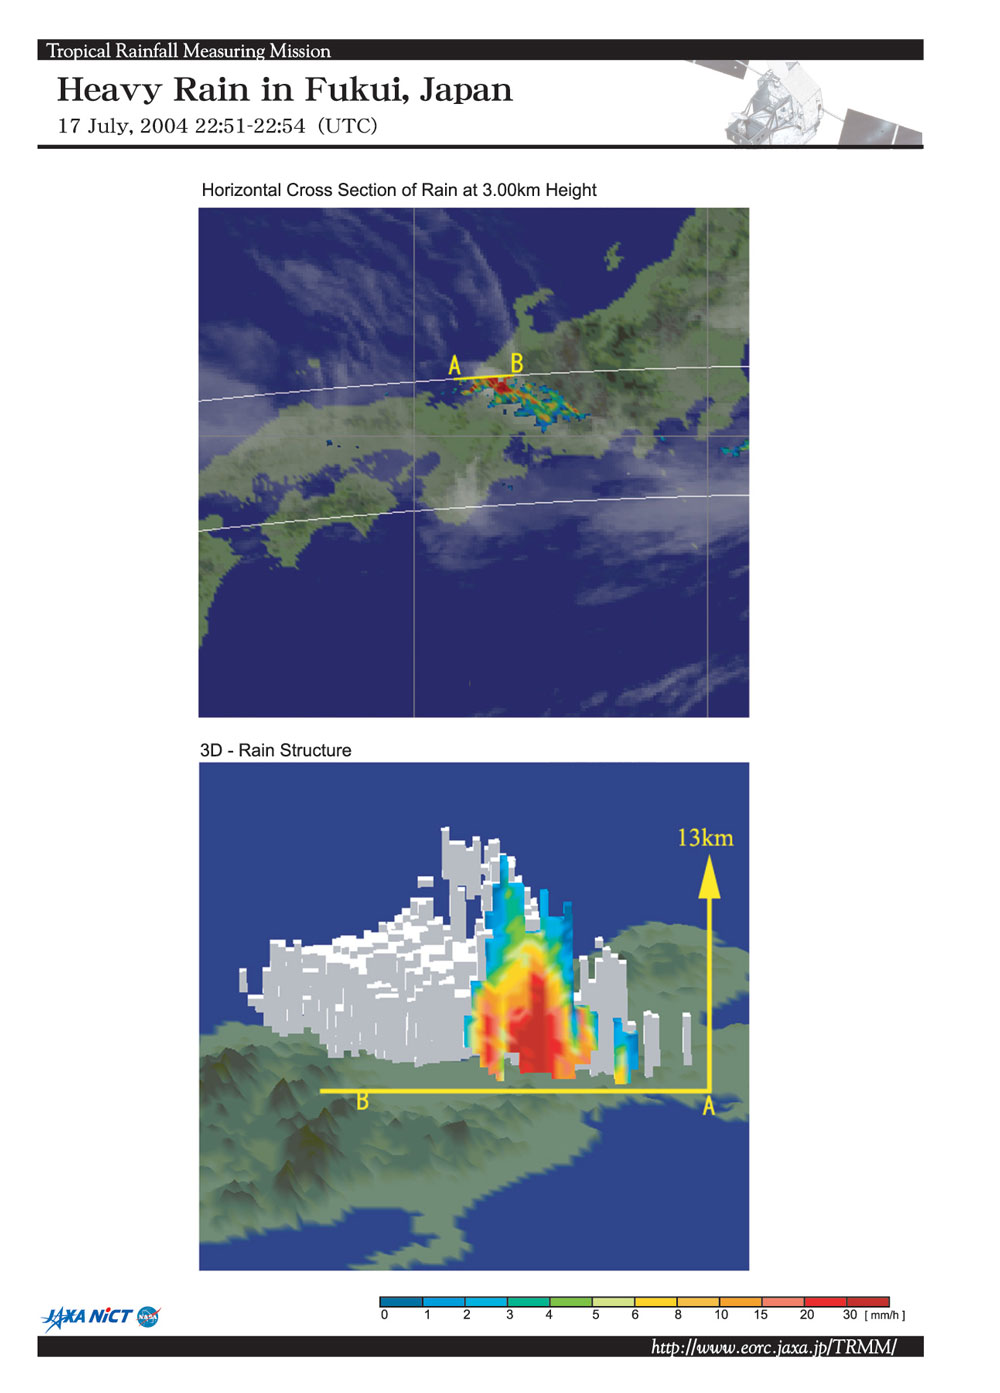
A great deal of damage was done not only by typhoons but also by torrential downpours. Hourly rainfall over 50 mm and daily rainfall over 200 and 400 mm reached record highs. In July, heavy rainfall events occurred in the Niigata-Fukui area and the Fukui area in conjunction with the intensified Baiu-front. Figure 3 presents the distribution of rainfall rates captured by the Precipitation Radar (PR) on the Tropical Rainfall Measuring Mission (TRMM) satellite and GOES-9 on 18 July 2004, as a snapshot of the downpour in Fukui. This torrential rainstorm brought 87 mm of hourly rainfall and 283 mm of daily rainfall centering around the Reihoku area. The resultant collapse of embankments on the Asuwa River caused five missing or dead and 178 demolished or partially destroyed houses. TRMM observed the areas at 8 AM, which coincided with the time of the heaviest rainfall. The upper panel in Fig. 3 depicts a precipitation system extending from northwest to southeast. The strong rainfall-rate regions as shown in red are noticeable over Fukui Prefecture. The three-dimensional structure and a vertical cross section of the well-developed thunderstorms viewed from the north are depicted in the lower panel. The area over Fukui contains a deep rainfall level of about 13 km as well as heavy rain.
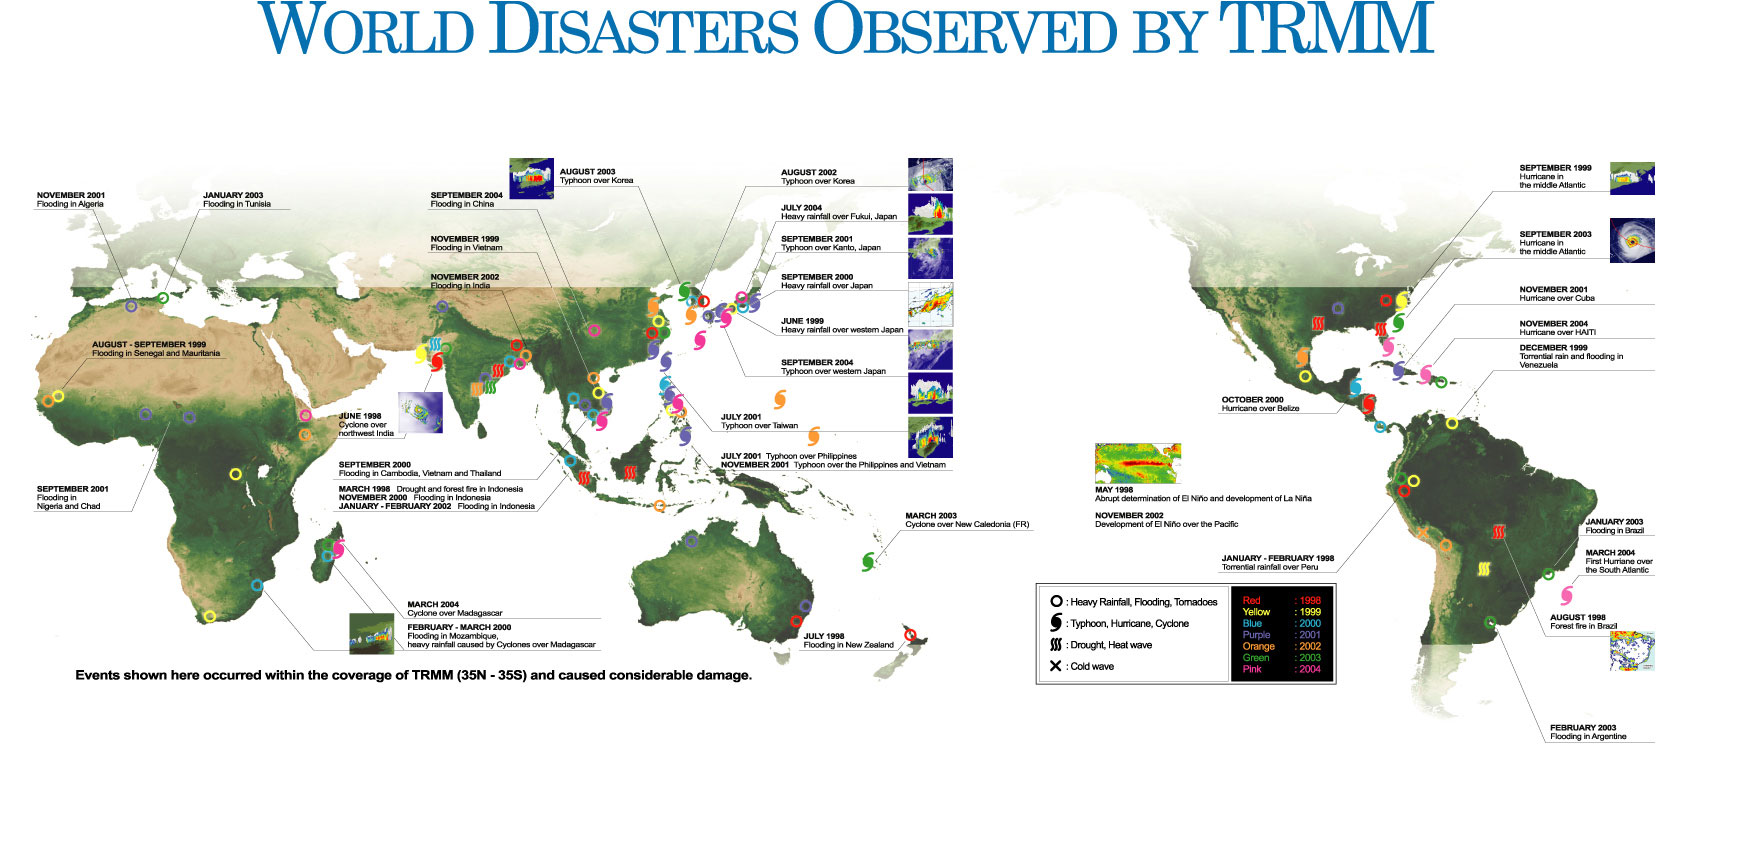
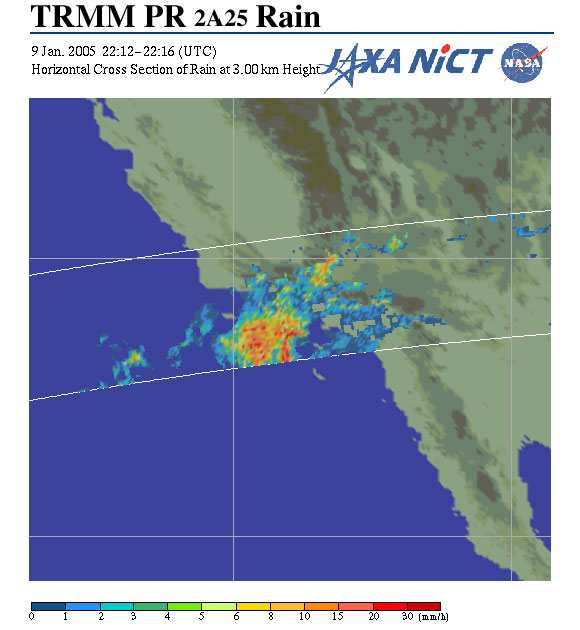
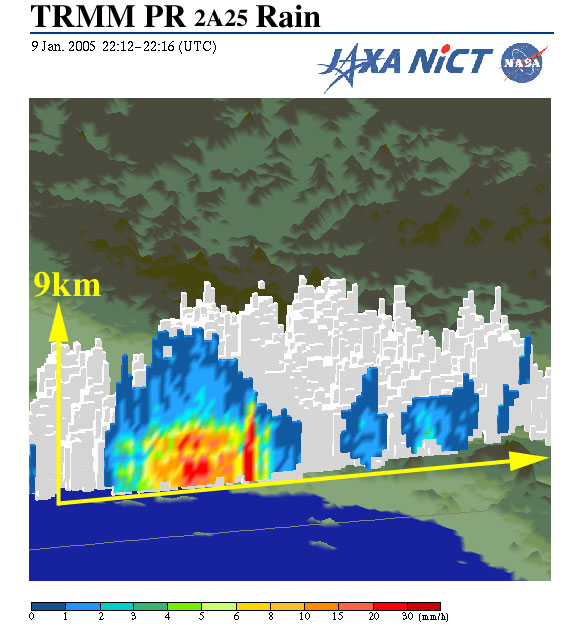
Figure 4 is a compilation of world disasters observed by TRMM since its launch in November 1997. These listed events, however, are only a fraction of the total number of natural disasters. A number of disasters such as torrential rains, hurricanes, and droughts occurred during these seven years. Even in the beginning of 2005, torrential precipitation-driven flooding and mudslides took a heavy toll in California (Figs. 5 and 6). The amplitude of fluctuation in rainfall and the number of disasters are estimated to become larger with the increase in global warming, although the frequent occurrence of disasters in 2004 can hardly be attributed to global warming with any certainty. Continuing observation from space is necessary for information gathering and for clarifying the mechanisms. TRMM is still observing precipitation events and natural disasters from orbit. The reference site:
Related sites: |