Seen from Space 2005
Kanto region begins the New Year with snow
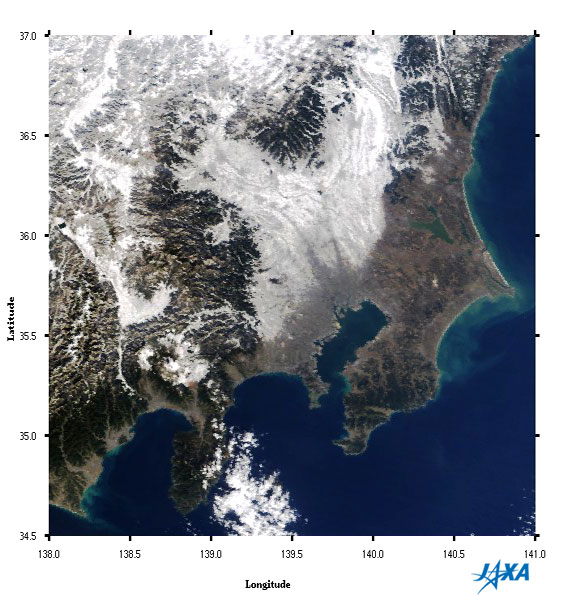
NASA's MODIS sensor captured the Kanto region (the area around Tokyo consisting of seven prefectures) including the mountainous area blanketed with snow on January 2 of the new year. The continuous snow in the Kanto region on December 29 and 31 caused a suspension of expressway traffic and disrupted railroad schedules. The low-pressure that arose over the sea southwest of Japan headed northeast along the southern coast of Japan and mixed with the cold air coming from the north, causing it to snow in the plains area of the Kanto region. The snow remains on the northwestern side of the line connecting Mt. Tsukuba in the upper right to Mt. Hakone in the lower left, but is no longer on the southeastern side of this line. You can also see that the foothills of Mt. Fuji are covered with snow (you can reason that it is snow as opposed to clouds as it does not move when compared with other images from MODIS Near Real Time Data). The white areas seen on the eastern side of the Izu Peninsula (part of Shizuoka Prefecture) are clouds. The distribution of atmospheric pressure in Japan is called a "southern coast low-pressure type." The heavy snow that falls annually on the Pacific coast side, February through March, is due to this distribution of atmospheric pressure. Since there is rarely snow in the metropolitan area, we feel large effects on our lives even when the snow falls in small amounts. Some of these effects are traffic accidents from slipping on snow and ice covered roads, and a high incidence of injuries among pedestrians from falling down on the snow and ice.
Related sites: (Please proceed 250m to Tokyo-bay. Mt. Asama is in the upper left of the picture.) |
|||||||||||||||||||||||