Seen from Space 2004
Major Typhoon No. 18 follows similar path as Typhoon No. 16 towards Kyushu.
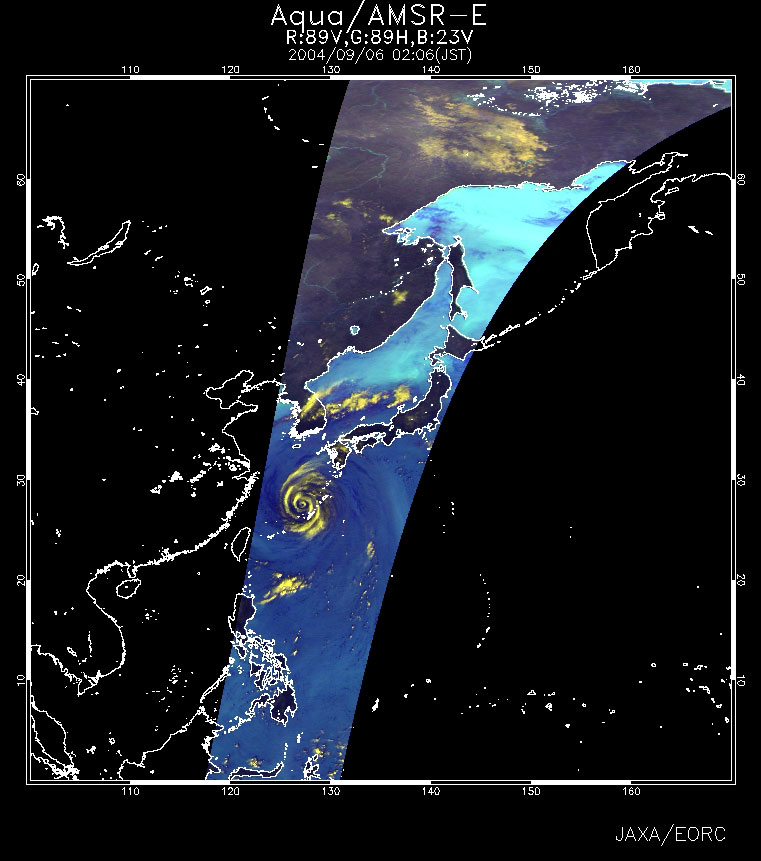
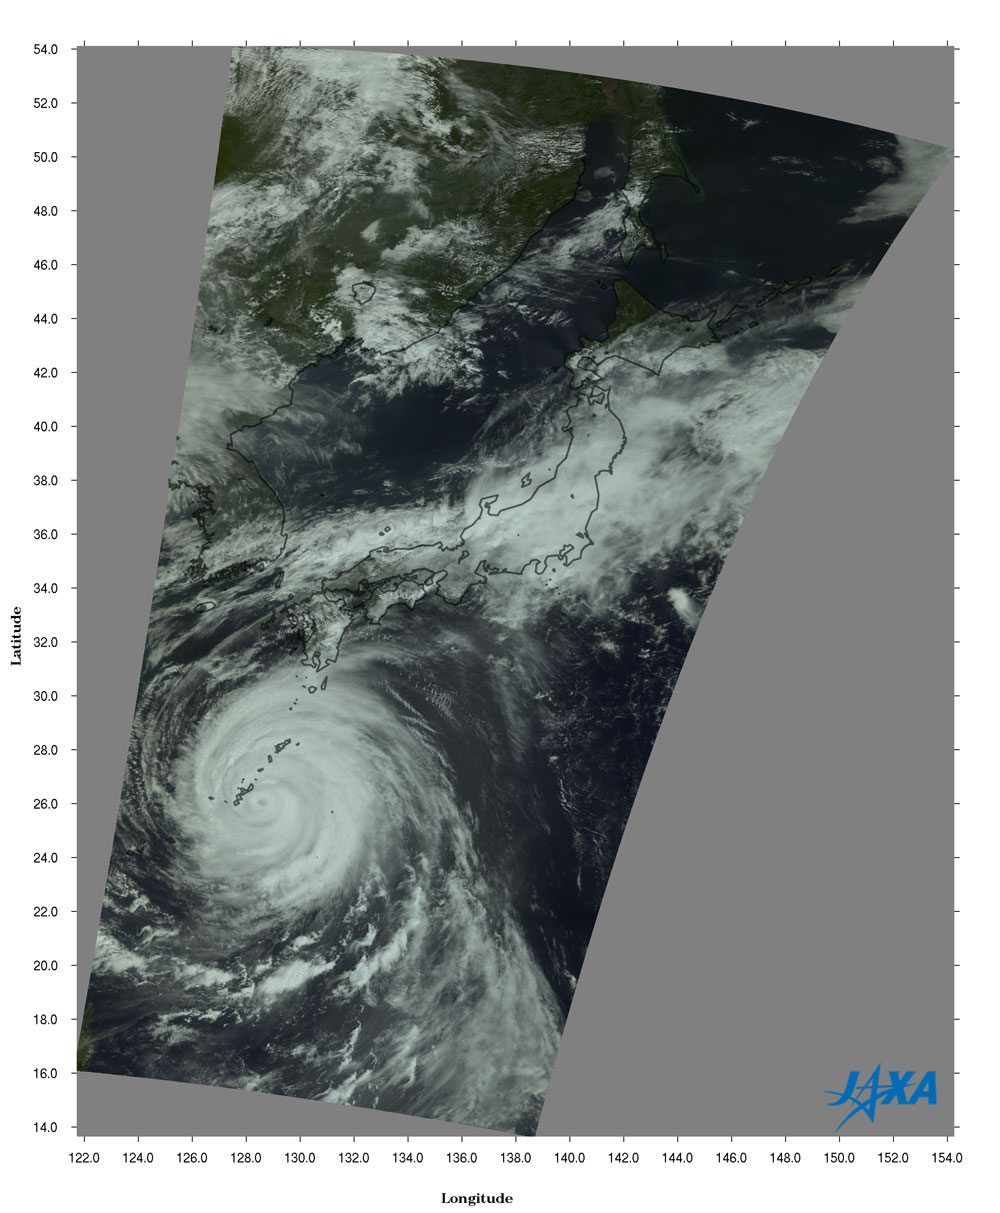
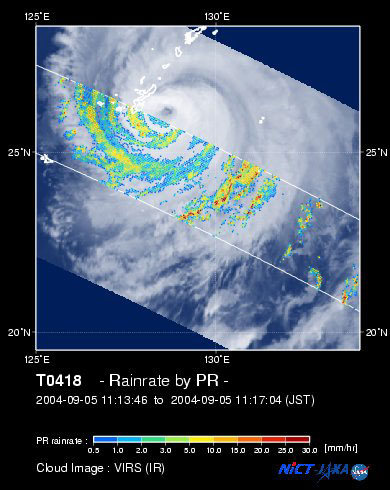
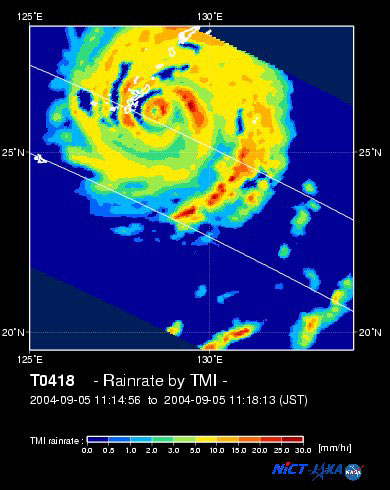
Typhoon No. 18 (Songda (*1)) is the most powerful typhoon to pass by Okinawa in the last several years. It remains powerful after passing Okinawa's main island with winds of 50 knots (25 m/s) over a day and a half ago. It is predicted to follow a similar path as Typhoon No. 16, which struck Japan last week. Figure 1, an AMSR-E near-real-time image observed at 0206 (JST) on September 6, depicts the well-developed clouds of Typhoon No. 18 located in the East China Sea. Dark blue on the sea surface indicates a large volume of water vapor in the atmosphere, and yellow represents well-developed clouds. Figure 2 is an image acquired by MODIS aboard NASA's EOS-Aqua satellite at 1046 (JST) on September 5. Figure 3 is a super-imposed image of rain rates near the Earth's surface observed by PR and the cloud image observed by VIRS both aboard the TRMM satellite at 1115 (JST) on September 5. Figure 4 is the precipitation observed by TMI aboard the TRMM satellite at the same time. You can see the heavy precipitation area (red and yellow) is distributed in a spiral around the typhoon. Figures 2 to 4 depict the situation of the typhoon just before it passed Okinawa's main island. Figures 1 and 2 show an active front north of the typhoon. It is necessary to monitor rainfall from the front because warm wet air accompanying the typhoon flows into the front and stimulates it.
Typhoon No. 19 (Sarika) is following Typhoon No.18 and needs to be monitored for flood tide and high seas as well as violent winds and rainfall. (*1)Songda is the name of a river located in northwest Vietnam. (*2)Sarika means "singing bird" in Cambodian.
Related sites: |
|||||||||||||||||||||||||||||||||||||||||