ページの先頭です。
本文へジャンプする。
【Important Notices】This page is an archive page of information published in the past. Since the update has been completed, it may contain broken links or outdated information. For the latest information, please use the new site Earth-graphy (earth.jaxa.jp).
ここからサイト内共通メニューです。
サイト内共通メニューを読み飛ばす。
サイト内共通メニューここまで。
ここから本文です。

Seen from Space 2004

Typhoon No. 1 (Sudal) in 2004

 
Fig. 1 Typhoon No. 1 (Sudal) in 2004 observed by TRMM satellite
(April 13, 2004)

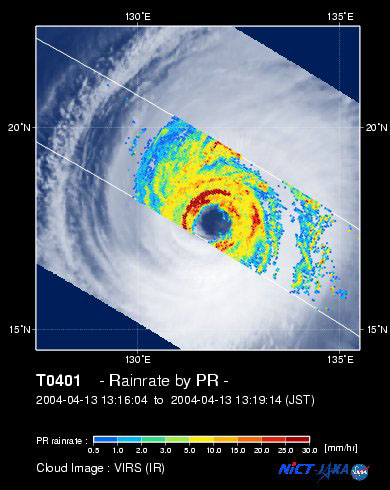
The PR and VIRS sensors aboard the Tropical Rainfall Measuring Mission (TRMM) satellite and AMSR-E aboard the Aqua satellite captured Typhoon No. 1 (Sudal) in 2004. Figure 1 is a super-imposed image of rain rates near the Earth surface observed by PR and the cloud image observed by VIRS. You can see the clear eye and the surrounding strong precipitation area developing isotropically aound the eye.

Fig. 2 Precipitation observed by AMSR-E
(April 13, 2004)
Fig. 3 Integrated water vapor observed by AMSR-E
(April 13, 2004)

Figure 2 (Fig. 3) indicates the precipitation (integrated water vapor) observed by AMSR-E. You can also see the strong, isotropic precipitation area around the eye and the large volume of water vapor distributed and gathered near the typhoon.

Typhoon No. 1 (Sudal) this year was born near 8 degrees north 149 degrees east around 9 o'clock AM (JST) April 5. It first developed and proceeded westward, proceeded northeastward in the eastern sea off the Philippines on April 14, and passed by the Ogasawara islands on April 15.

It is not rare for the first typhoon to be born in April. According to the JMA's typhoon statistics material (Japanese only), 10 "first" typhoons were born in this area during the past 54 years. The first typhoon was born in January 21 times during the same period. In the earliest case, typhoon No. 1 took place on January 2, 1979. In the latest case, it was on July 8, 1998 (link to the observed image).

JAXA EORC will continue observing typhoons by using TRMM and Aqua satellites.

Related sites:
TRMM Tropical Cyclones Database
TRMM Tropical Cyclones quick report (Japanese only)
Near-real-time brightness temperature of AMSR-E and Radar-AMeDAS rainfall around Japan
AMSR/AMSR-E High Resolution Image Archive

Explanation of the images
Fig. 1
Satellite: Tropical Rainfall Measuring Mission (TRMM)
Sensor: Precipitation Radar (PR) and Visible Infrared Scanner (VIRS)
Time and date of observation: 13:16 to 13:19 (JST) on April 13, 2004
The rain rate image from PR in the center swath is overlaid on the cloud image from VIRS in the outer swath.

Figs. 2 and 3
Satellite: Aqua (NASA)
Sensor: AMSR-E (Advanced Microwave Scanning Radiometer for EOS-PM (Aqua)) (JAXA)
Time and date of observation: 13:16 (JST) on April 13, 2004
Visualized images made of precipitation (Fig. 2) and integrated water vapor (Fig. 3). They are both AMSR-E level 2 standard products.


本文ここまで。
image:Satellite Navigator
image:Satellite Applications and Operations Center(SAOC)
Earth Data Collection by JAXA Satellites
image:ページTOP