Seen from Space 2004
Accelerated Sea-Ice Melting in the Arctic
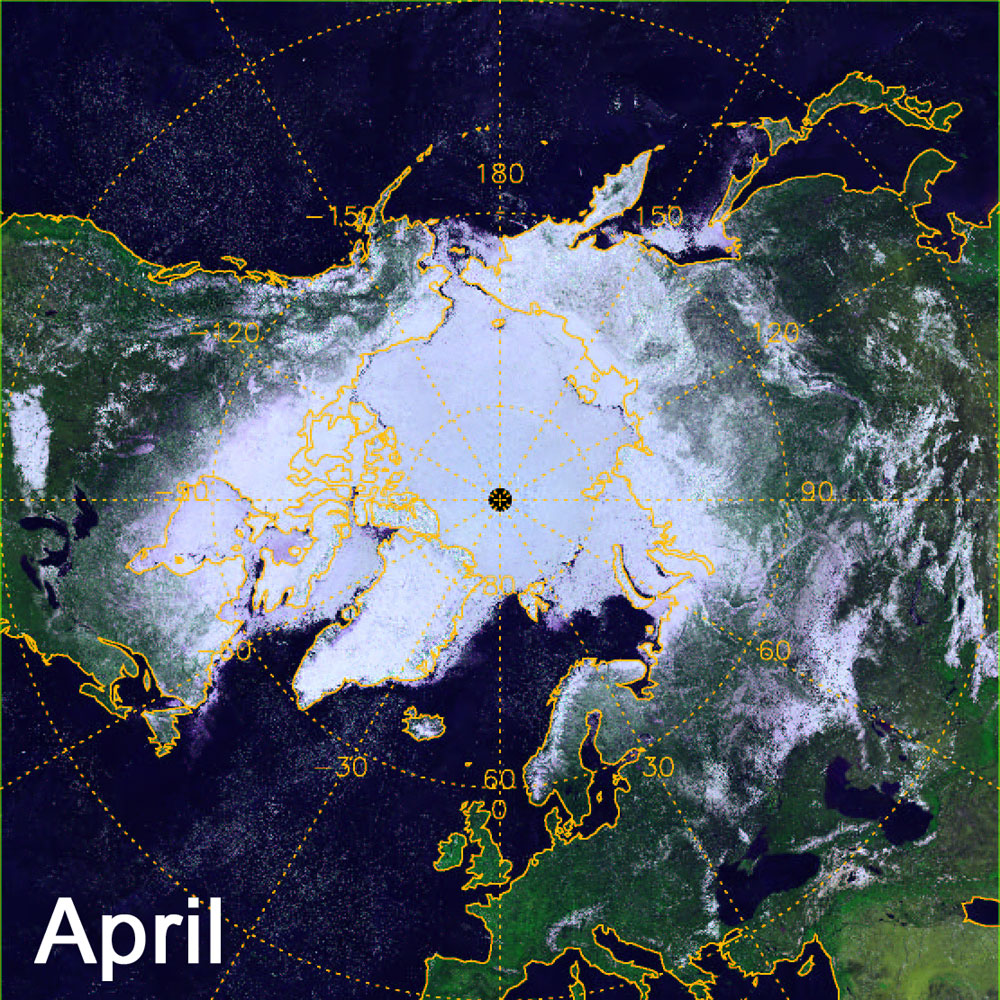
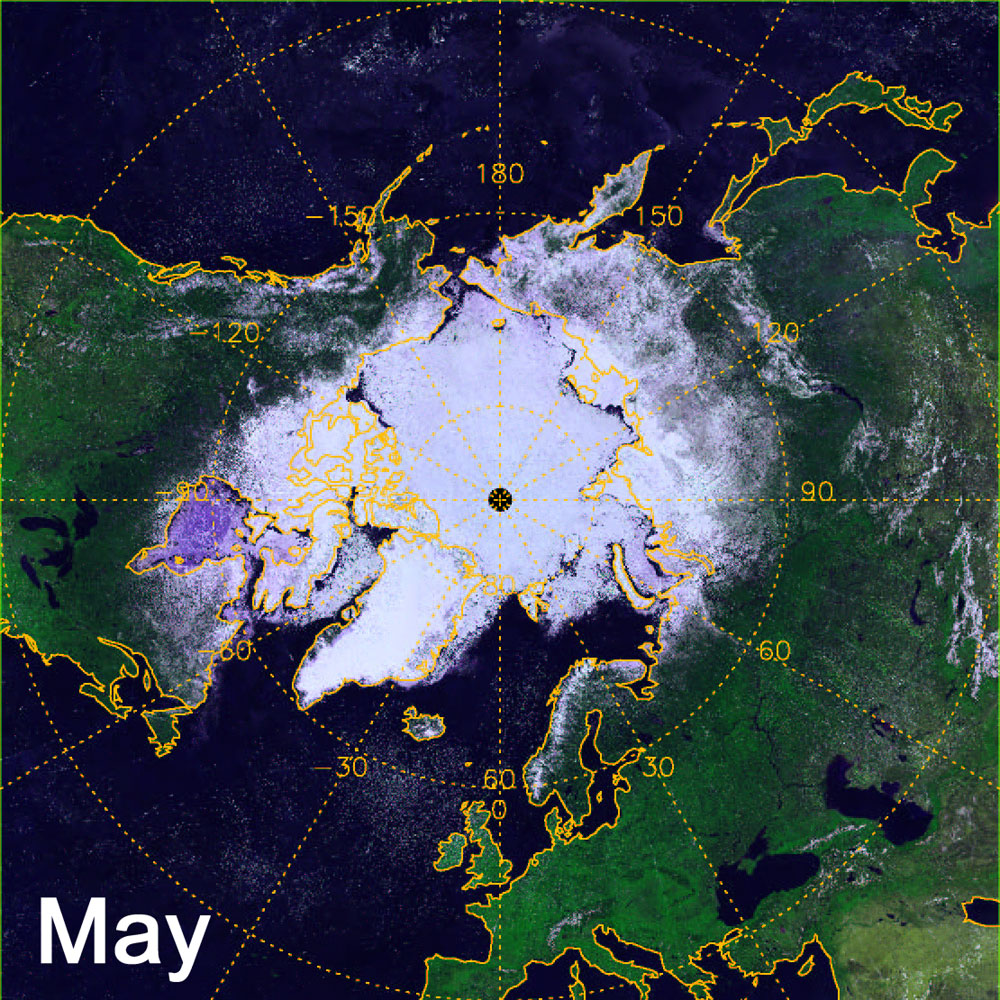
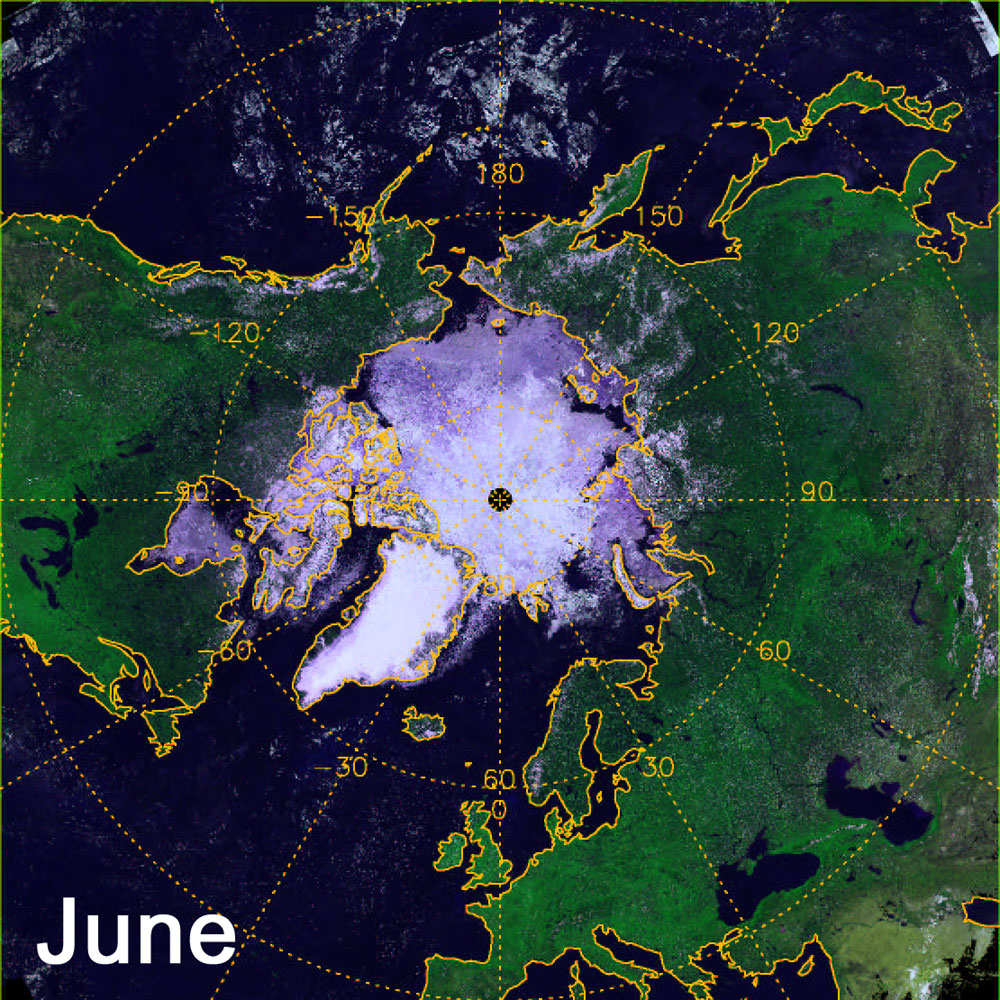
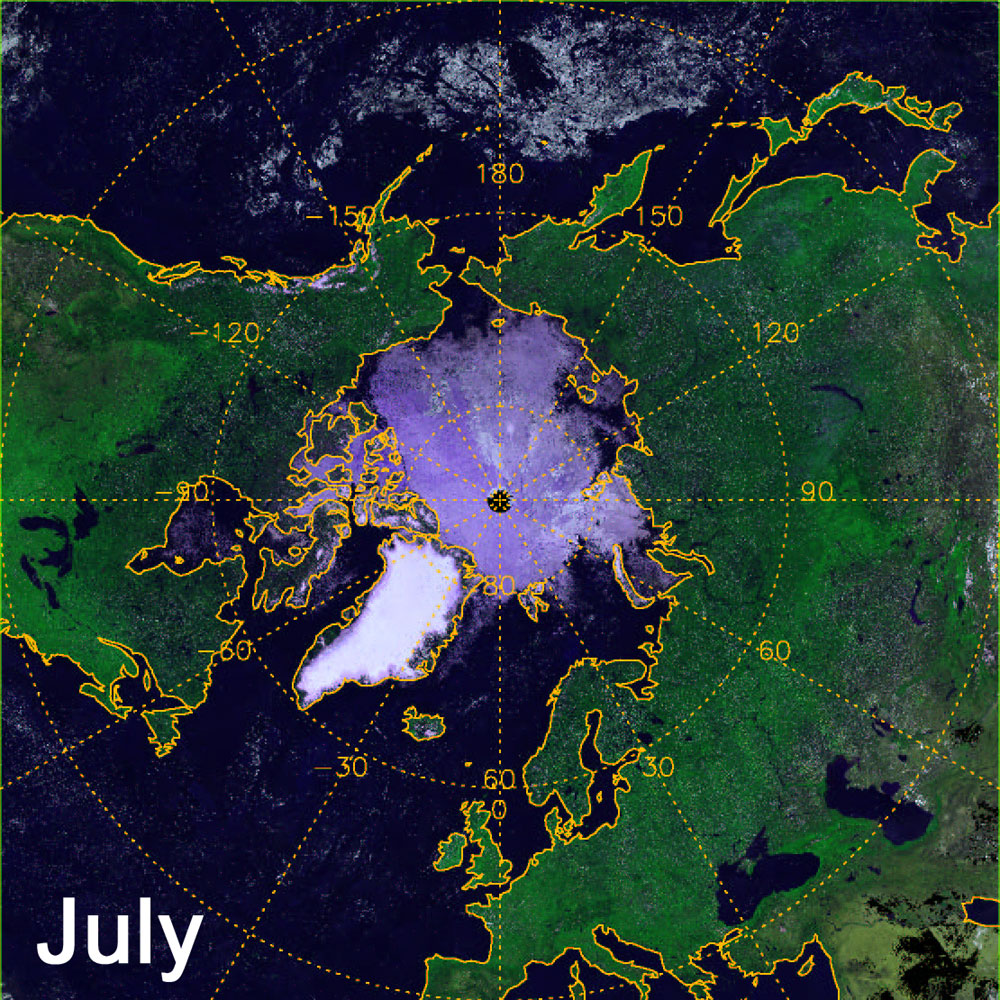
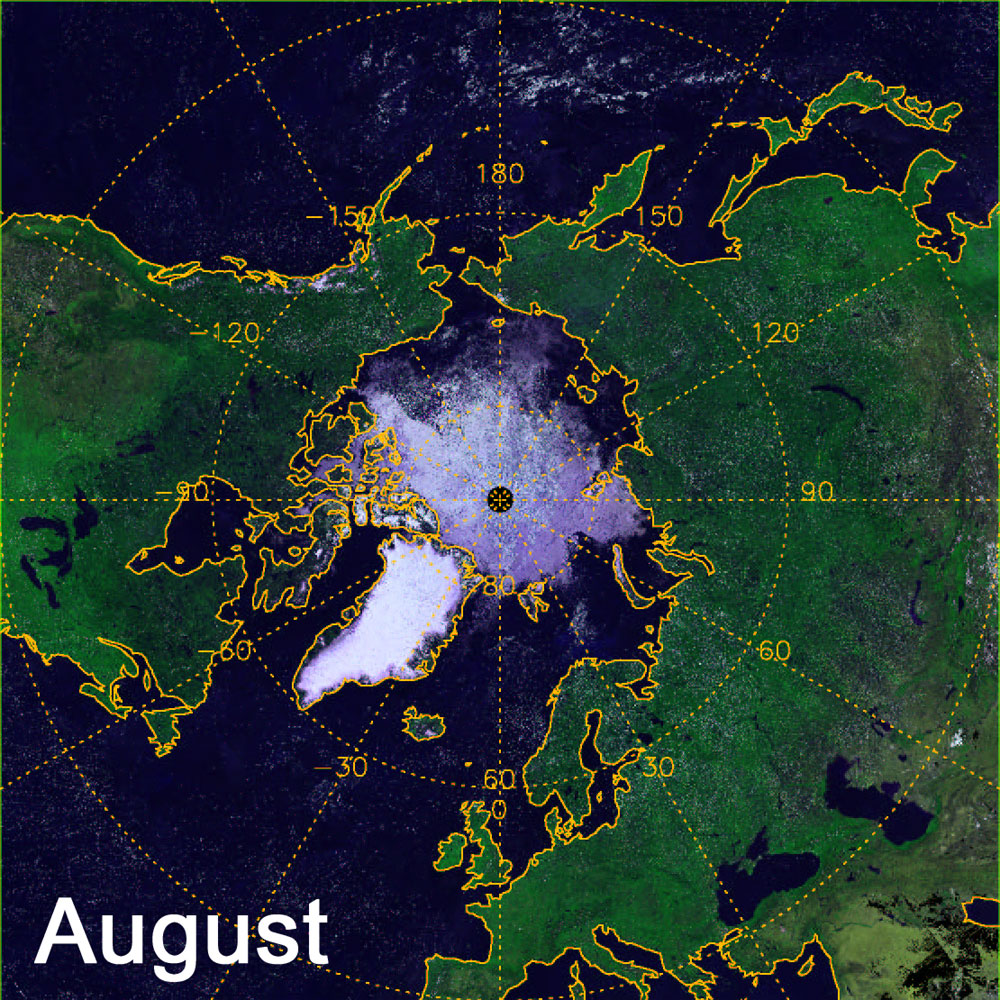
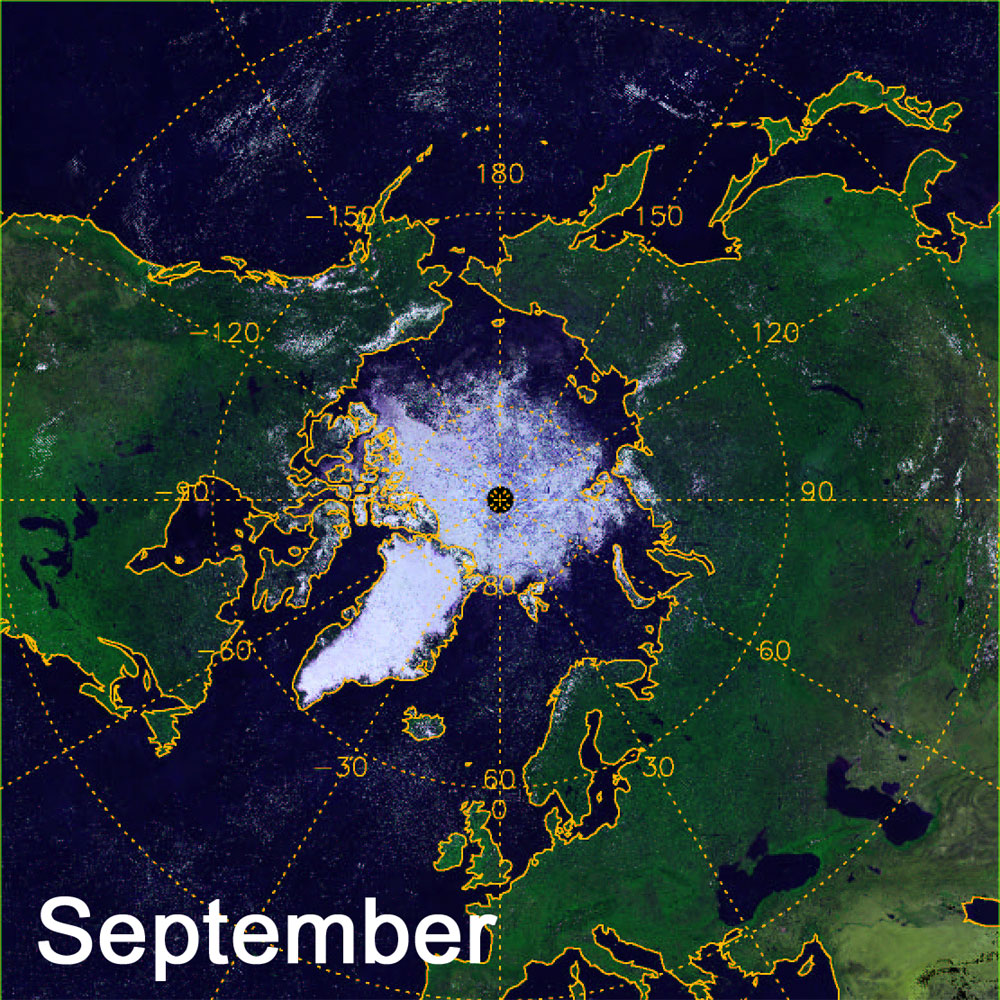
The previous topics "Snow Ice in the Northern Hemisphere (April 2003)" reported vast sea-ice area extended from the North Pole to southern sub-Arctic area in spring captured by GLI. After that, GLI continued to watch rapid melting of snow and sea ice cover in the Arctic Region during from summer to early autumn. Images shown above are the monthly snow and sea ice extent around the Northern Polar Region from April to September this year (*).The North Pole are drawn at the center of the images, and Japan can be seen in the upper right of the image (but upside down). Continental snow cover (light blue color region in the images) rapidly disappears from the southern lower latitude regions during from April to June. Then in early autumn (September), snow cover comes back to the Continents in the north of Alaska and Siberia. Sea ice melting proceeds at near coastal area in the Arctic Ocean. Firstly sea ice begins to be dark (violet color region in the images) due to the melting of snow on the ice. The dark region spreads over the entire sea ice region in July. Then, in the following two months (August and September) sea ice itself also start melting. In particular, large open ocean can be seen to extend in north of Alaska and Siberia up to hundreds km offshore. Recently, area and thickness of the Arctic sea ice cover are reported to decrease year by year, and the connection of those decreases to the global warming phenomenon are investigated by scientists. While the size of Antarctica's ozone hole has been reported as an symbolic measure of the current earth environmental status every September, the trend of the Arctic sea ice on the opposite side of the globe should also be monitored continuously at the same month every year. (*) The full resolution of GLI is 1 km, but for a global view the data are aggregated to a 10 km resolution. |
|||||||||||||