|
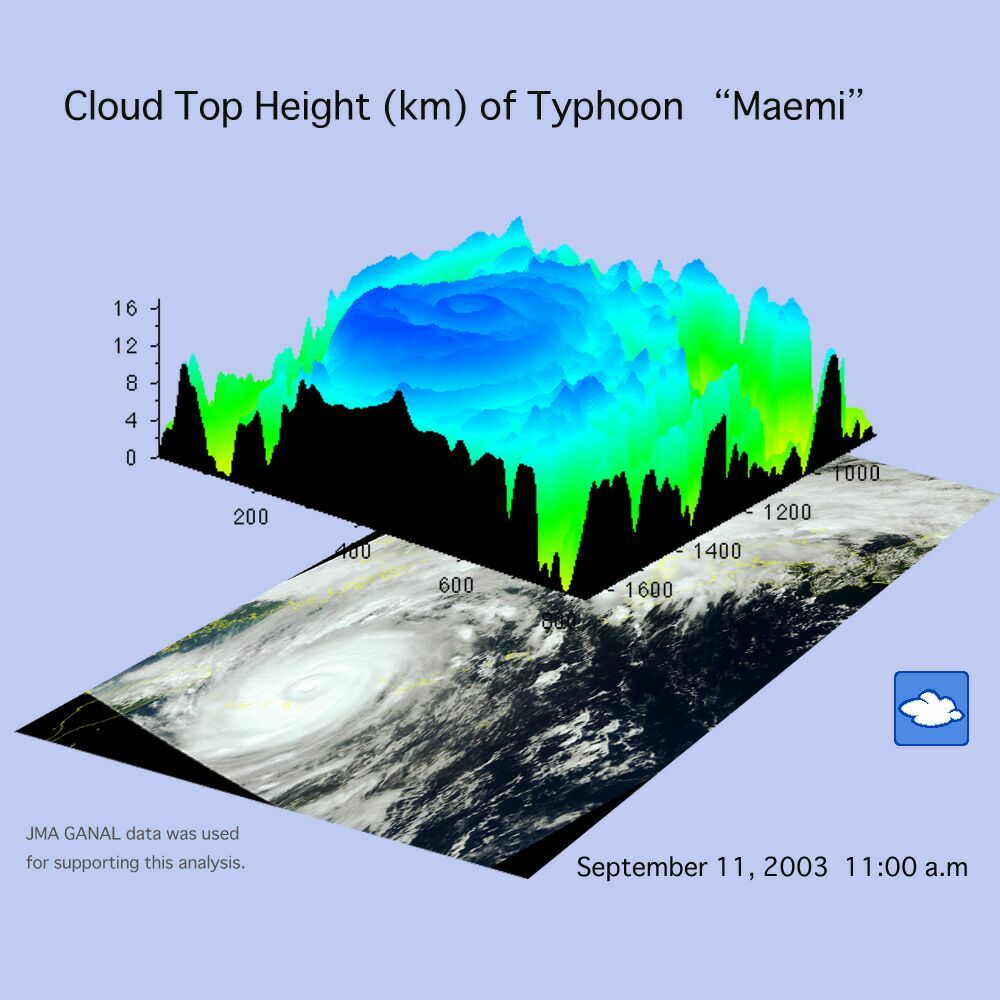
Cloud-top heights were retrieved from a GLI image captured on September 11, 2003. The cloud top reached 16-km at very low temperature (-70°C). A high cloud top indicates a strong typhoon. The two-track eye in the typhoon center is clearly visible.
The GLI analysis algorithm retrieves cloud-top temperature, cloud particle size, and so on, in addition to cloud-top height.
* This 3D graphic image was generated by using a different color for each cloud-top height, which varies according to the areas. Although the image indicates continuous clouds from the cloud top to the land surface, the three-dimensional cloud structure is not necessarily continuous. |