 |
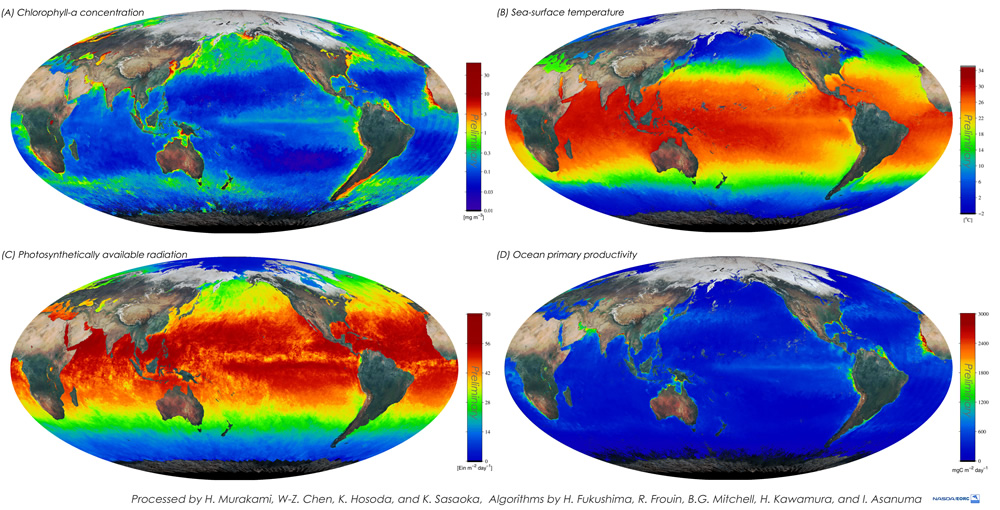
These images are the first monthly mean ocean products derived from GLI's continuous observation started in April 2003. We can estimate the ocean primary productivity of phytoplankton (D) from these products - chlorophyll-a concentration (A), sea-surface temperature (B), and photosynthetically available radiation (C) - with the ocean biological model.
Chlorophyll-a exists in plants and plays an important role in photosynthesis. Chlorophyll includes types a, b, c, d, and e of these, chlorophyll-a can be a good indicator of the amount of ocean phytoplankton because it exists in all phytoplankton in common, as well as in all algae and land plants.
Photosynthetically available radiation indicates the amount of sunlight available for photosynthesis. It is high around the equator where the sunlight penetrates more easily. Generally, ocean phytoplankton decreases in photosynthesis ability under strong sunlight. The ability differs with environmental conditions such as temperature and nutrient salts, biological classification, and physiological conditions. Phytoplankton itself uses sunlight for photosynthesis under the best conditions. Therefore, areas with high photosynthetically available radiation are not necessarily suitable for vigorous photosynthesis by ocean phytoplankton. Primary productivity in the ocean means the amount of carbon per unit time and area that phytoplankton takes up and fixes as carbon dioxide in sea water by photosynthesis using sunlight and nutrients such as nitrogen and phosphate.
Primary productivity is remarkably high in the middle-to-high latitude coastal regions. It results from nutrient-rich water from the inflow of river water and coastal upwelling (upward flow in water) caused by ocean currents along the shore. High primary productivity also extends over a long and slender area along the equator from offshore Peru. It corresponds to an equatorial upwelling zone, and this region provides a large nutrient input due to the upward flow caused by the east-west trade winds. As a result, phytoplankton concentrations are higher than in adjacent water, so primary productivity is high. In middle-to-high latitude regions, April is the phytoplankton bloom season (representing the greatest increase in phytoplankton of the year). We suggest that high primary productivity near 30°to 40°N in the Pacific and Atlantic Oceans resulted from a phytoplankton bloom in April. Understanding the mechanisms of primary productivity in the ocean is very important for clarifying carbon cycles in the ocean relevant to global warming. It is also important for protecting and managing marine resources since phytoplankton plays a significant role in feeding habitats for marine commercial resources such as sardine and tuna through a marine food chain.
GLI has 36 channels in its observation spectrum, from the visible band to the thermal infrared band. When we estimate chlorophyll-a concentration (A), we use the data from channel 4 (443nm), channel 5 (460nm), channel 7 (520nm), and channel 8 (545nm) in the visible band. At the same time, we use the data from channel 15 (710nm) and channel 19 (865nm) in near-infrared band for atmosphere compensation. We also use the data from channels 4, 5, 7, 8, and 13 (678nm) for photosynthetically available radiation (C), and channel 34 (8.6μm), channel 35 (10.8μm), and channel 36 (12.0μm) for sea-surface temperature (B). |