 |
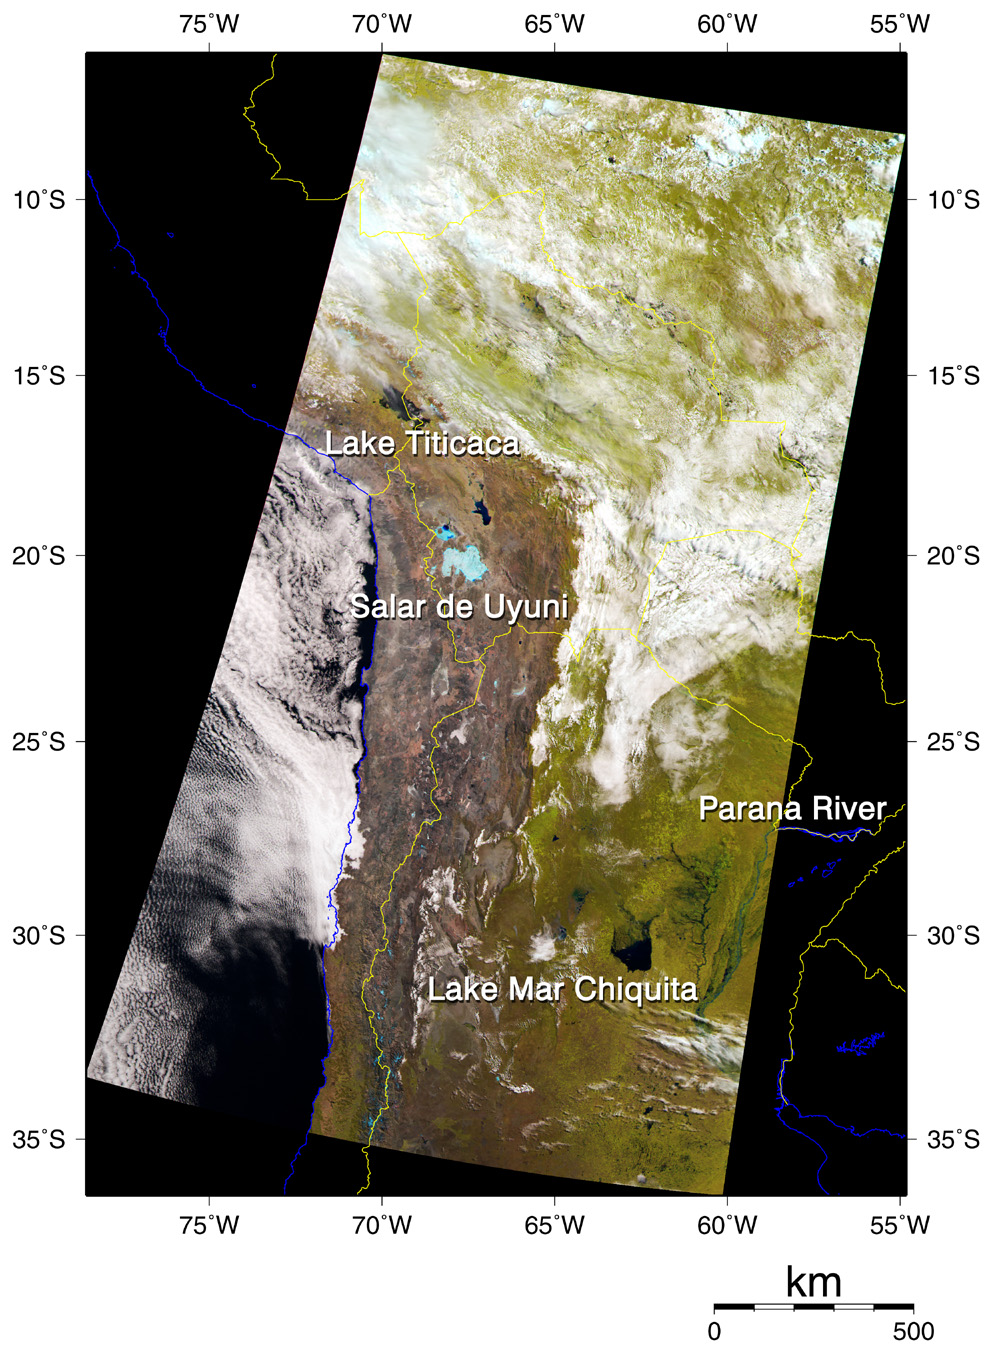
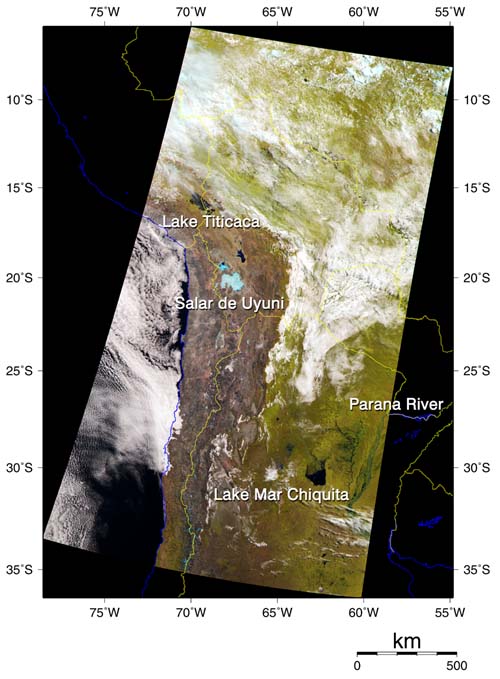
This image of the central part of South America was captured by GLI on April 7, 2003. The brown you see aligned from north to south in the middle of the image is a dry alpine belt of the Andes that runs down through Peru, Bolivia, Chile, and Argentina. The olive-green part in the east is Gran Chaco, which extends through Bolivia, Paraguay, and Argentina. Just west of the Andes is the Pacific Ocean.
At 8,000 kilometers, the Andes is the longest mountain range in the world. The image shows the middle of the range where there are 6,000-meter mountains. White areas are clouds, which are found in the low sky because they cannot pass over the Andes.
The black part at 15° south latitude and 70° west longitude is Lake Titicaca. The elevation of the lake's surface is 3,812 meters, making it the highest navigable lake in the world. Light blue the south of the lake is Uyuni, world's biggest salt lake. The area is about 100×120 kilometers, and in the rainy season (from November to March) it has a little water. In the dry season, however, it is dried up and is cut off to get salt. When dry, it appears white. It now seems light blue, so we know it is a little wet. This area around Lake Titicaca and Lake Uyuni is called Altiplano, and forms a basin between mountain ranges of 6,000 meters in the east and west.
The black part in the lower right of the image is Lake Chiquita; we can also see the Parana River east of that. In this area, it rained over twice as much as in normal years from February to April this year, causing the heaviest flood in ten years. In this image, Lake Chiquita seems three times bigger and Parana River and its branches seem to be wider than shown on the map, which means this image is consistent with the above-mentioned report, and we can determine flood conditions from that.
The picture was generated from GLI spectral channel 26 (1240nm) in red, channel 19 (865nm) in green, and channel 13 (678nm) in blue. |