Evolution of El Nino in 1997/98
The distribution of precipitation over the tropical Pacific is apparently different between El Nino and La Nina years. When these phenomena occur, increased rainfall is observed at seasons or locations in which little rain is observed in normal years, or, on the contrary, not observed over generally heavy rainfall regions. During the 1997/98 El Nino event, which was the strongest in the record, fire by slash-and-burn farming was not controlled and developed to large-scale fire disasters because of less rainfall over the western tropical Pacific in the rainy season.
| Comparison of PR and TMI | |
 |
|
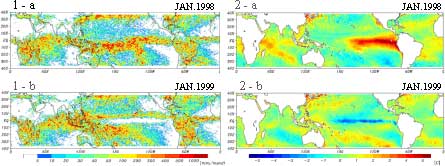
Figures 1a and 1b show estimated monthly accumulated rainfall near the surface derived from the Precipitation Radar(PR) aboard the Tropical Rainfall Measuring Mission (TRMM) satellite for January 1998 (Fig. 1a) and 1999 (Fig. 1b). Figures 2a and 2b show sea surface temperature (SST) anomaly derived from the TRMM Microwave Imager (TMI) for January 1998 (Fig. 2a) and 1999 (Fig. 2b), which are defined as deviations from the climatological monthly mean SST compiled by the Japan Meteorological Agency. Since El Nino still continued in January 1998,, heavy rainfall shifted from the western to the central Pacific (Fig. 1a), unlike the normal year. Due to the effects of El Nino, the Inter-Tropical Convergence Zone (ITCZ) was located along the Equator in Fig.1a, and areas of heavy rainfall in the south Pacific shifted further to the east than in normal years. In Fig. 2a, there was a much higher (red) SST than normal over the central and eastern equatorial Pacific, but a lower SST over the western equatorial Pacific. Figure 1b shows the rainfall distribution in January 1999, after the El Nino event. Unlike Fig. 1a, there was little rainfall in the central equatorial Pacific, and ITCZ was in the normal location. In addition, heavy rain was observed in Indonesia, and the center of active convection was observed in its normal location. Figure 2b shows that the strong El Nino disappears and a colder than normal (blue) SST year occurs over the central and eastern Pacific. This corresponds to the light rainfall region in Fig.1b and indicates the El Nino cold event (La Nina). Such shift of the maximum rainfall region in the tropics linked to convective activity variations, caused by El Nino and La Nina events, should significantly affect world weather. |
| Sea Surface Temperature Change | |
| Figure shows the global sea surface temperature change from 1998 to 1999 measured by TRMM Microwave Imager (TMI). |
- Evolution of El Nino in 1997/98
- Evolution of El Nino in 2002