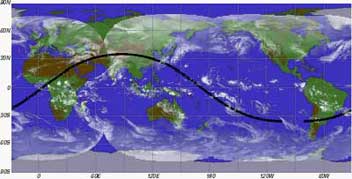
Figure shows the single-orbit observation on Dec. 8 ,1997(UTC) when the PR observed the tropical cyclone PAM (inside the white rectangle). TRMM passed over Okinawa and observed the center of the cyclone PAM which can be seen to the northeast of New Zealand at 18:00 on Dec. 8. The orbit in this figure shows a swath width (about 220km) of PR observation. The infrared images in this figure are from geostationary meteorological satellites of Japan (GMS), the U.S. (GOES) and Europe (METEOSAT).
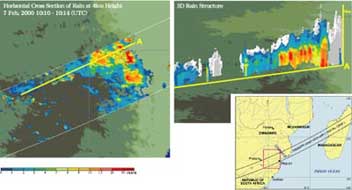
Precipitation Rate (3-dimensional and horizontal) Feb. 7, 2000
These images show heavy rainfall over Mozanbique observed by the Precipitation Radar (PR) aboard the Tropical Rainfall Measuring Mission (TRMM) satellite. Left figure shows the vertical cross section of rain, and right shows the horizontal cross section. It is observed that more than 30mm heavy rainfall in wide areas.
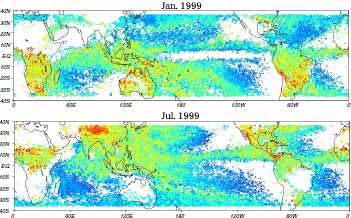
Precipitation Top Height Jan. 1999 & Jul. 1999
Global Storm Height Distribution Observed by the TRMM Precipitation Radar These figures show the global distribution of storm height from sea level observed by the Precipitation Radar (PR) aboard the Tropical Rainfall Measuring Mission (TRMM) satellite in January 1999 (upper panel) and July 1999 (lower panel).
As observed in Africa and other continents in the lower panel, the storm height over the land is higher than that over the sea because ground surfaces tend to be heated and convections are more easily developed over the land than over the sea.