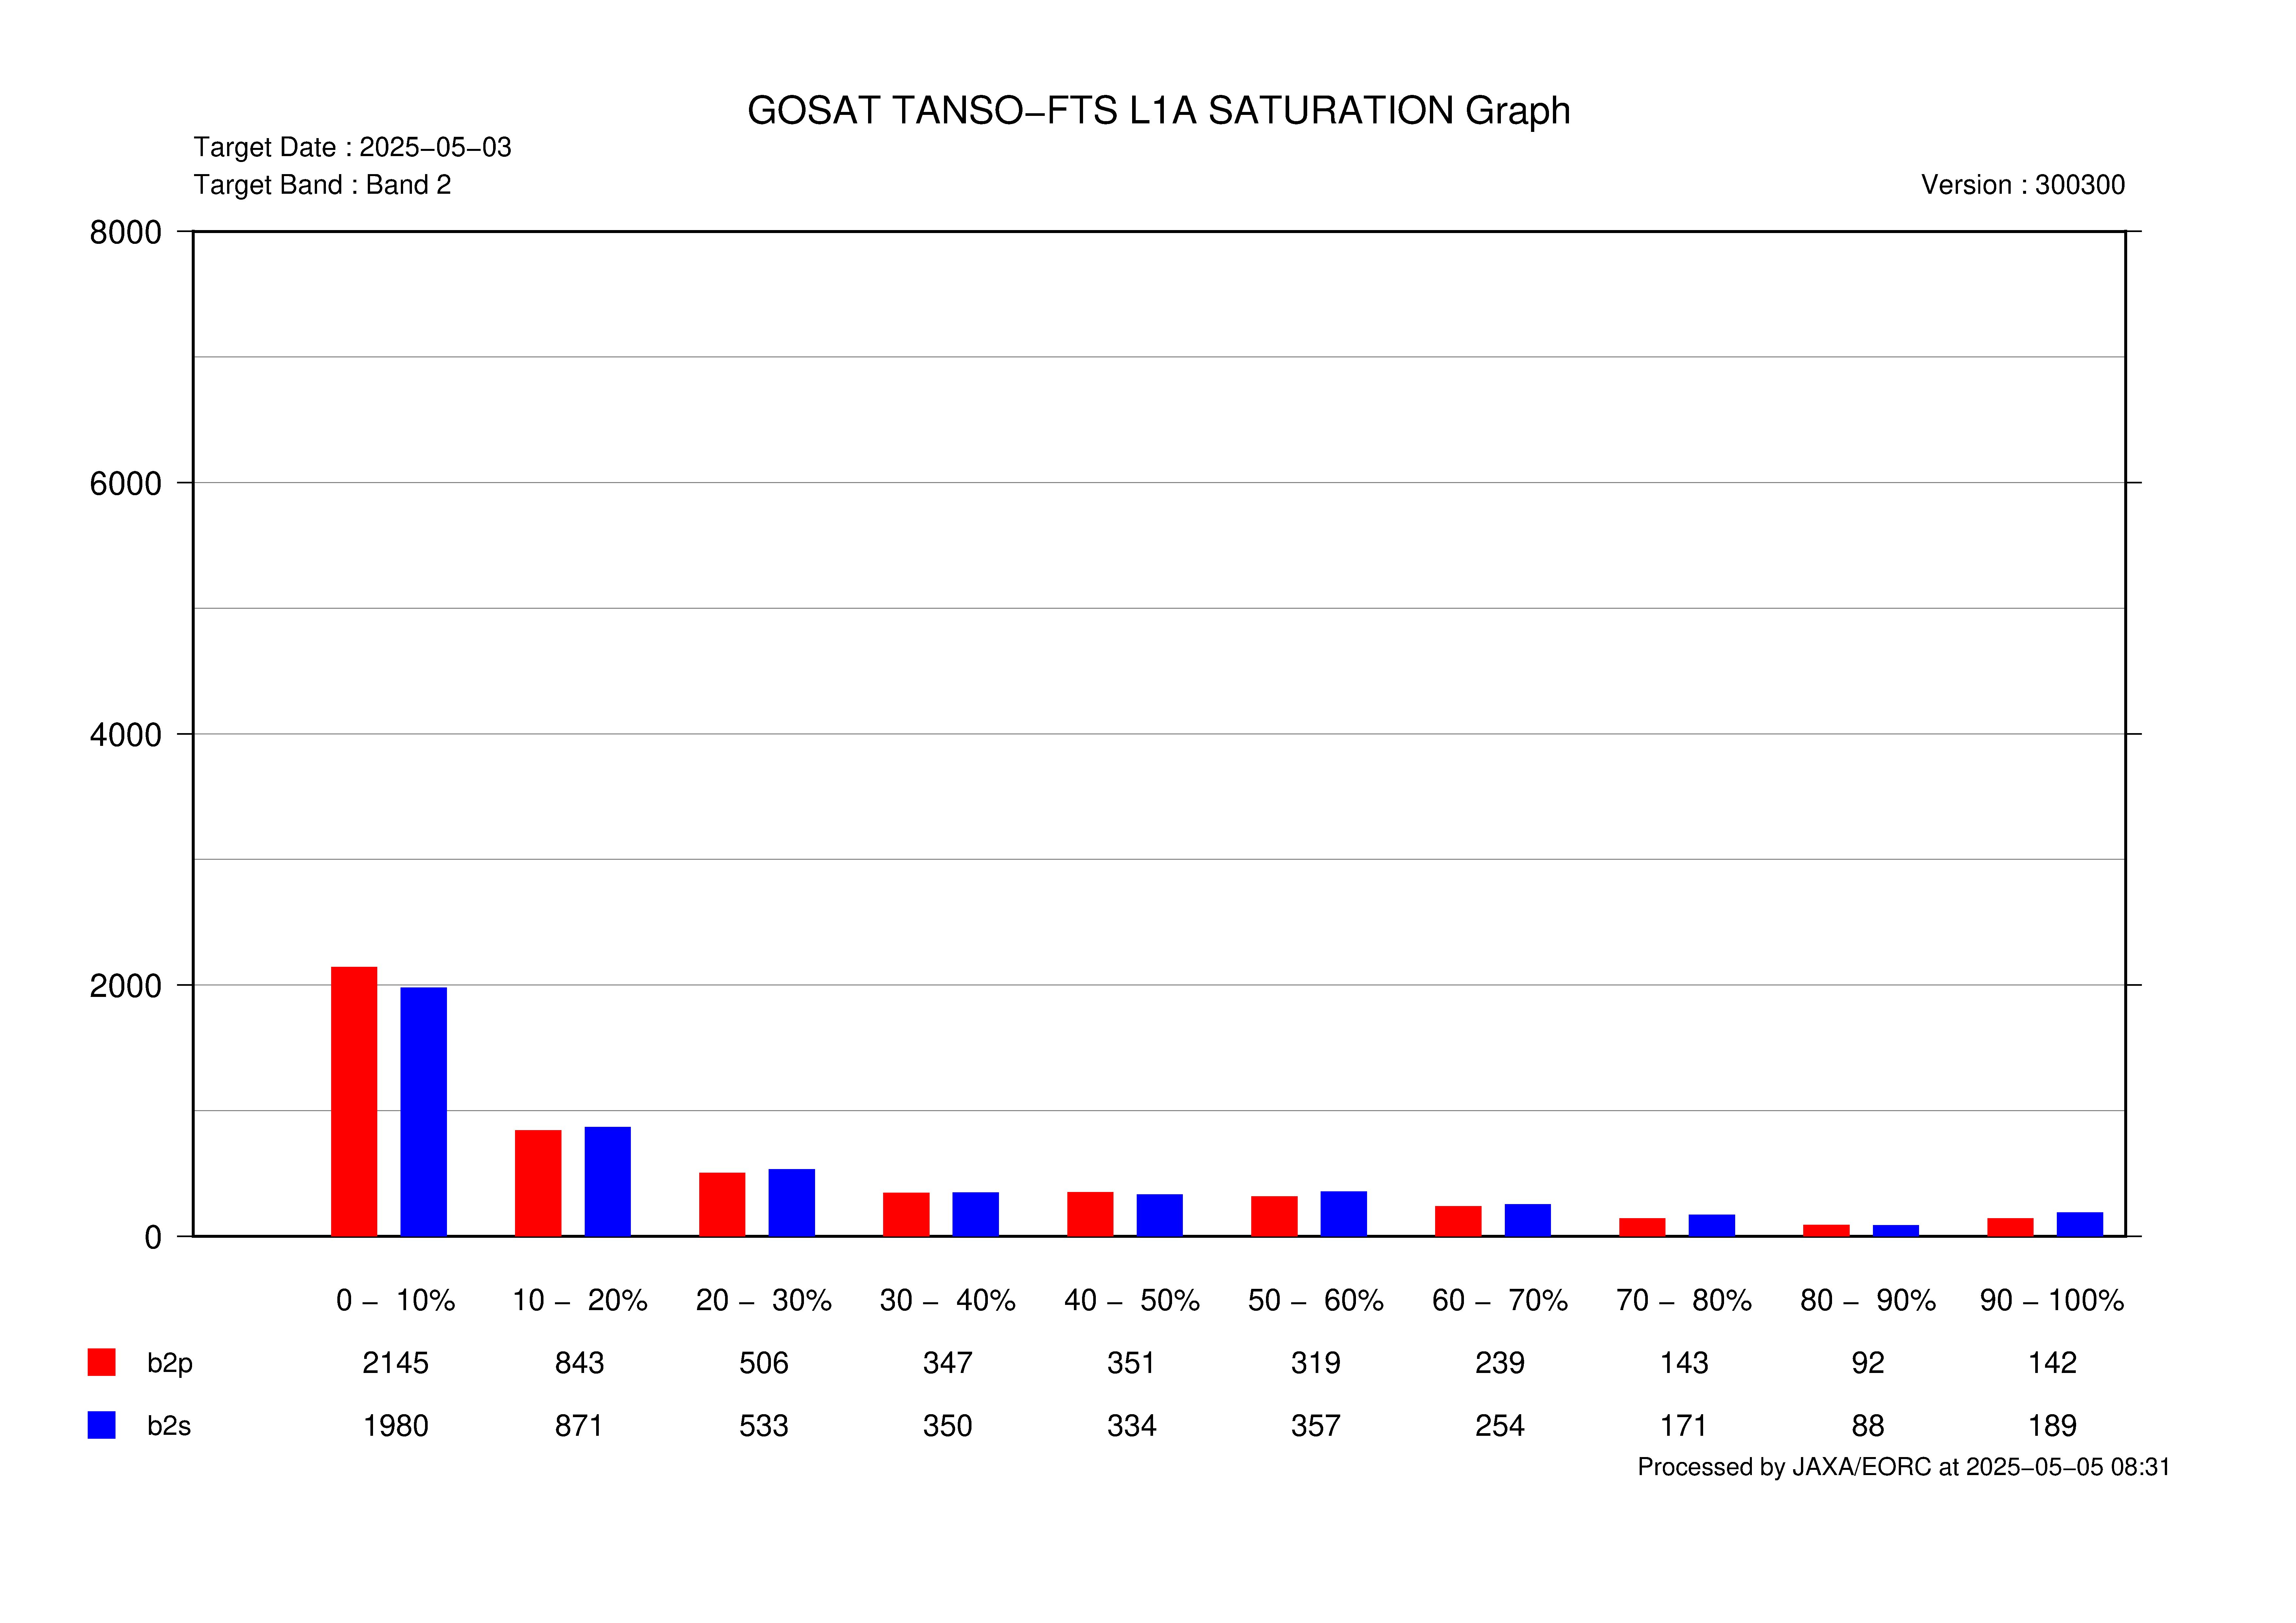
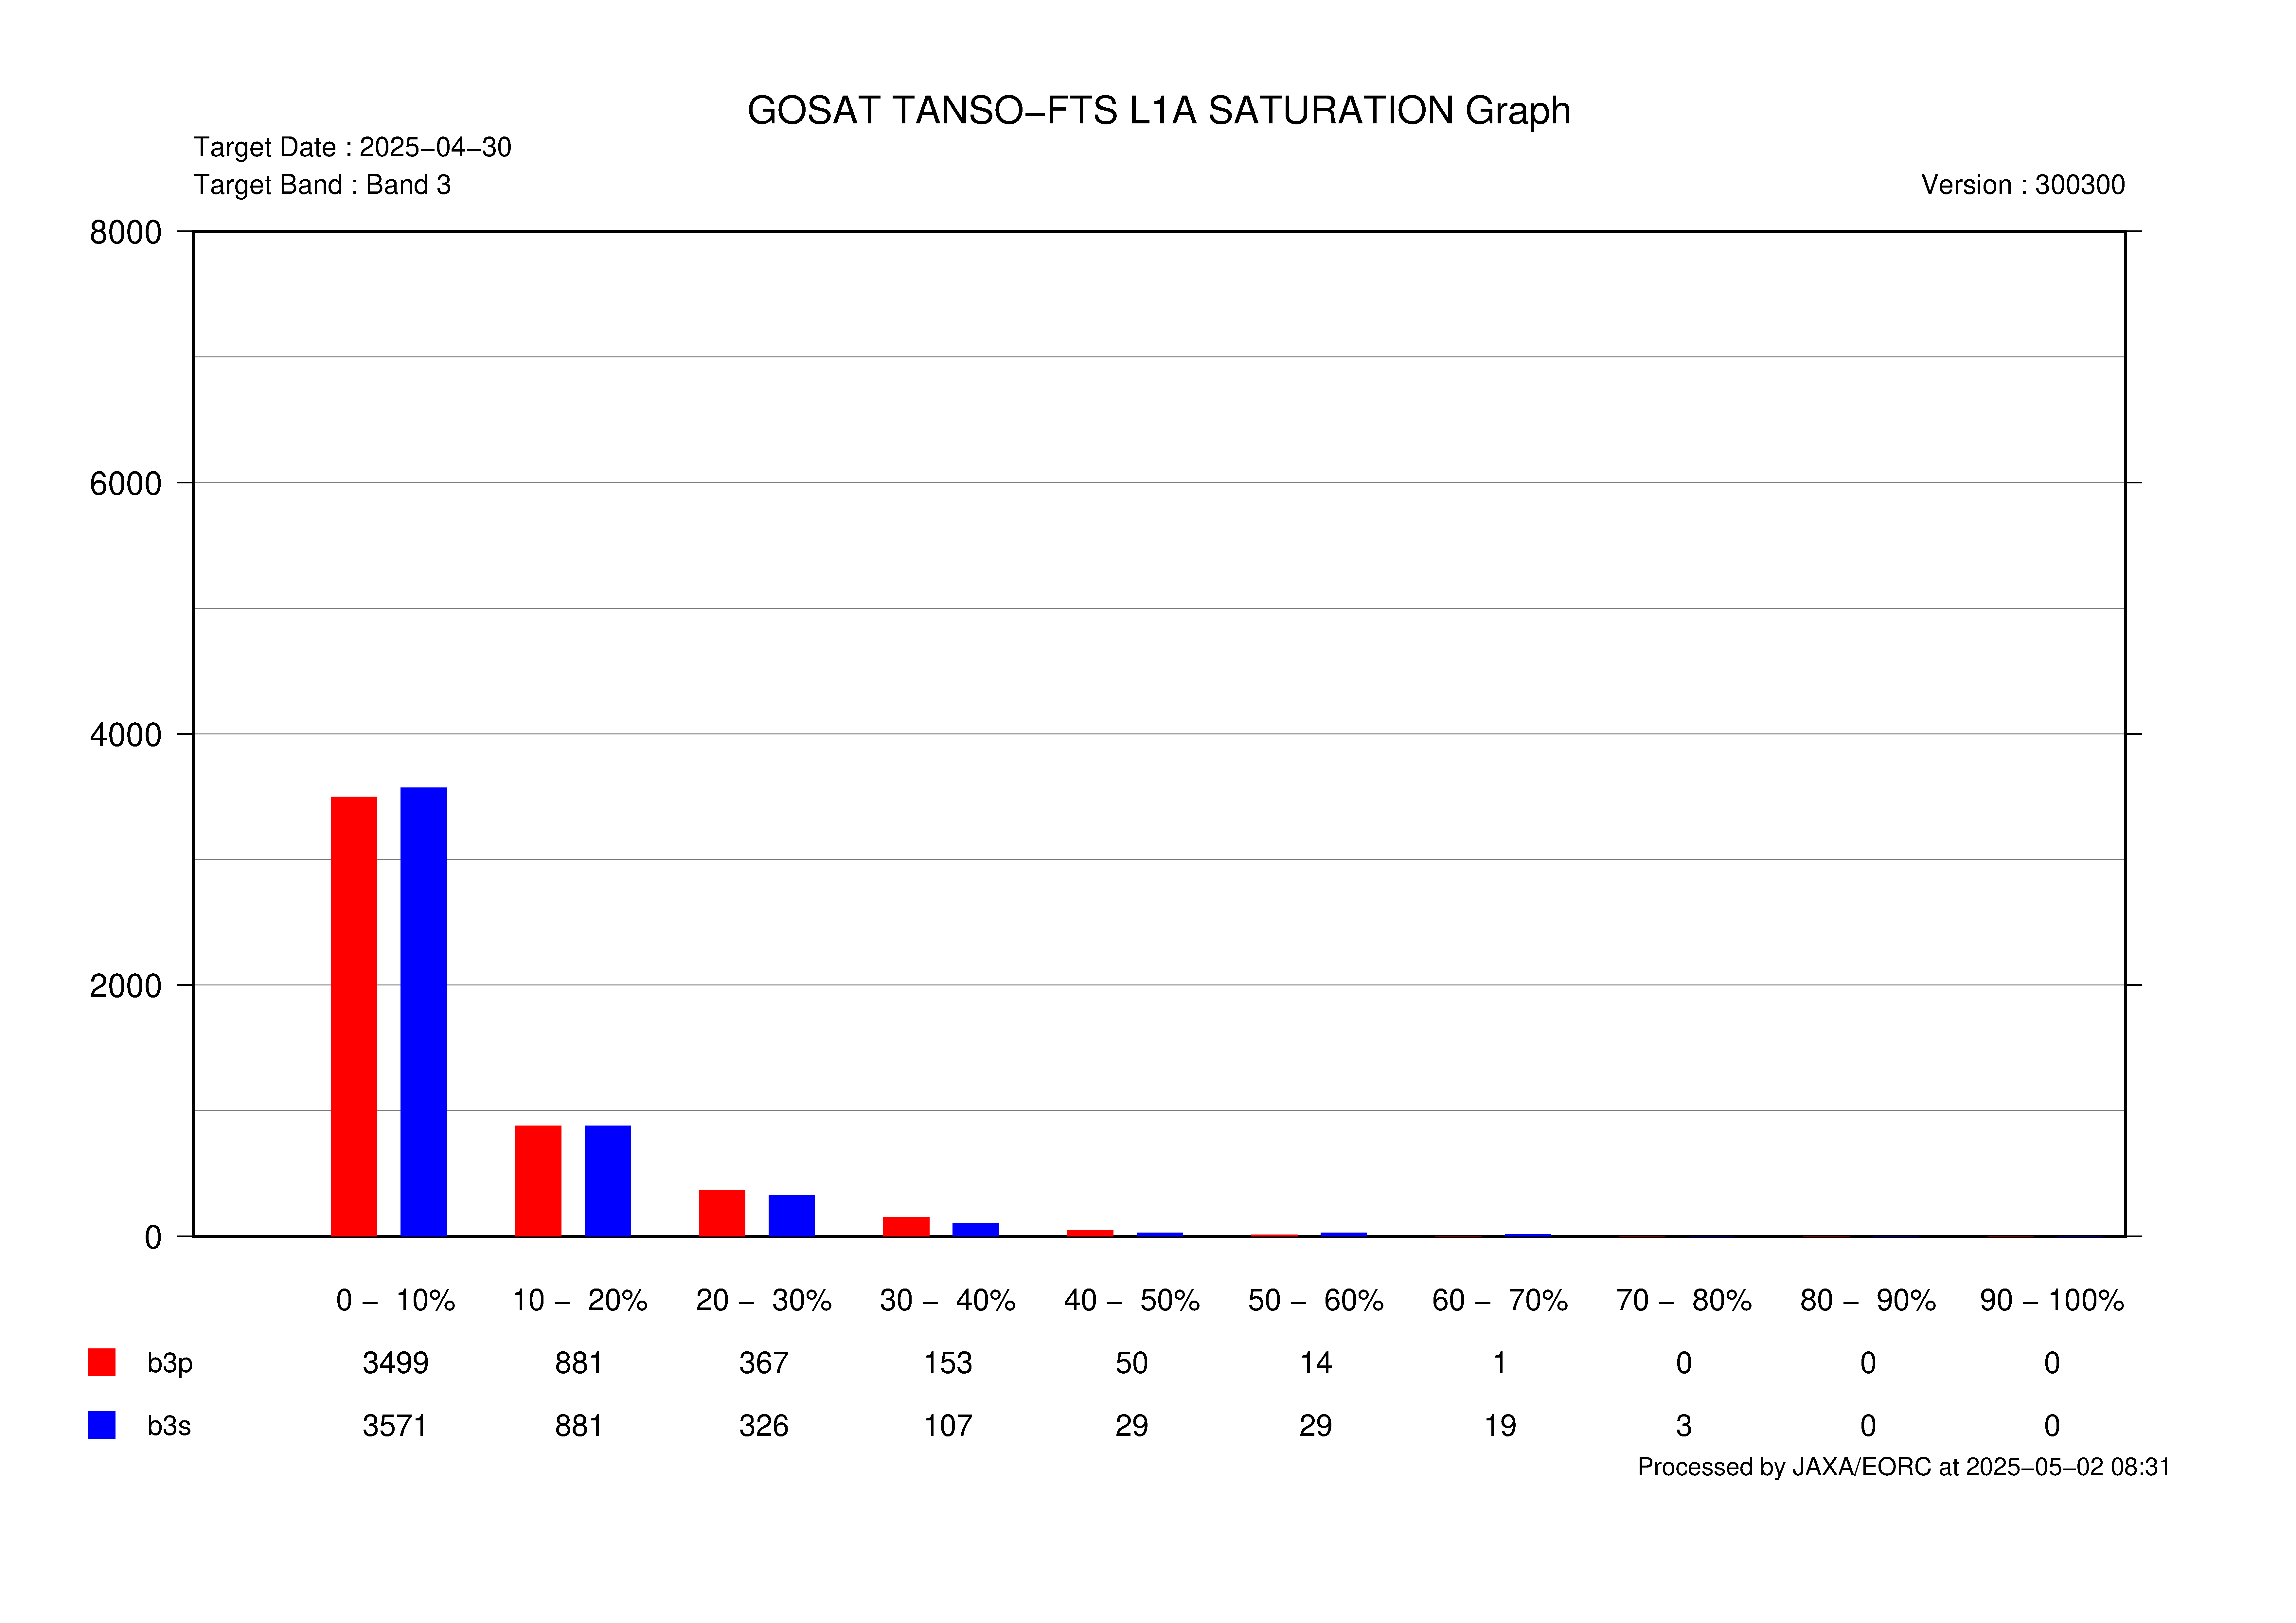
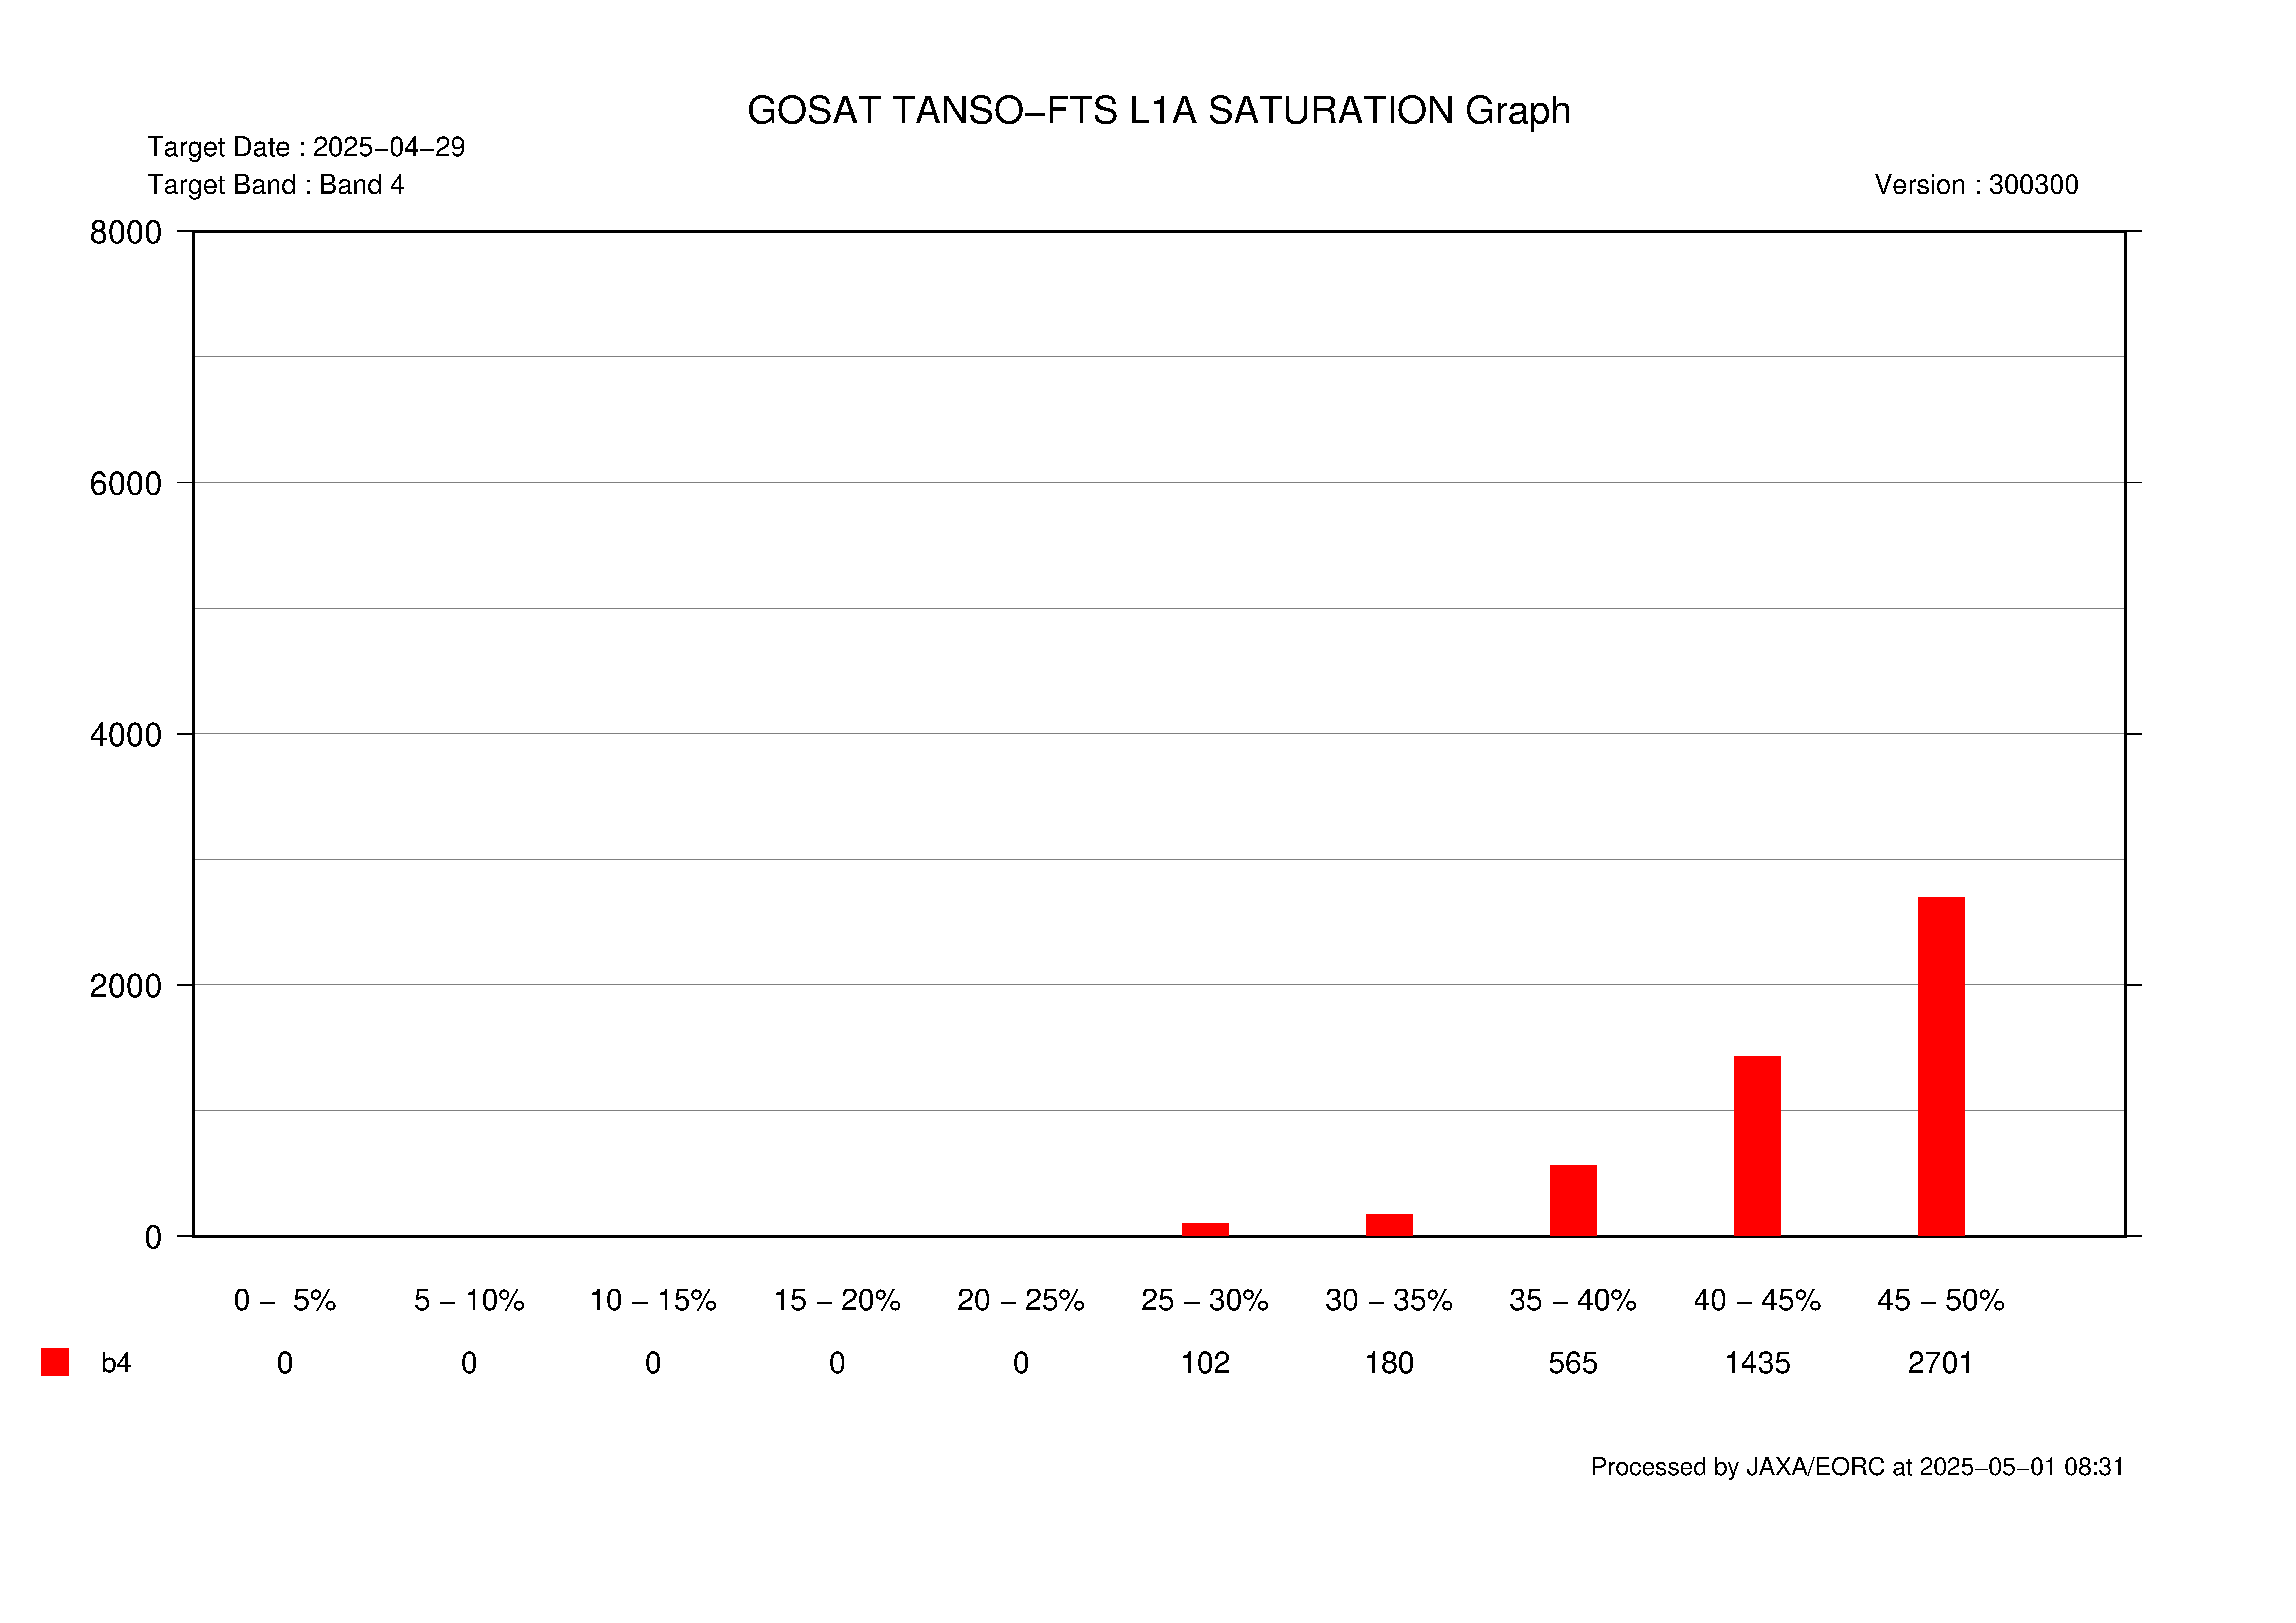
TANSO-FTS L1A interferogram saturation graph :
The TANSO-FTS L1A Histgram count only normal observation (day side,
grid observation: OB1D) judged by the following flags.
・ TANSO-FTS pointing mirror stability quality information
(pointingMirrorStableFlag)
・ Data missing flag (missingFlag)
・ The pointing stability flag during exposure (pointingStableFlag)
・ ELU stable flag (ELU_StableFlag)
The saturation fraction is calculated with the maximum of interferogram
and upper limit of interferogram for each band. The histogram bin size of
saturation fraction is 10 % for band 1-3 and 5 % for band 4.
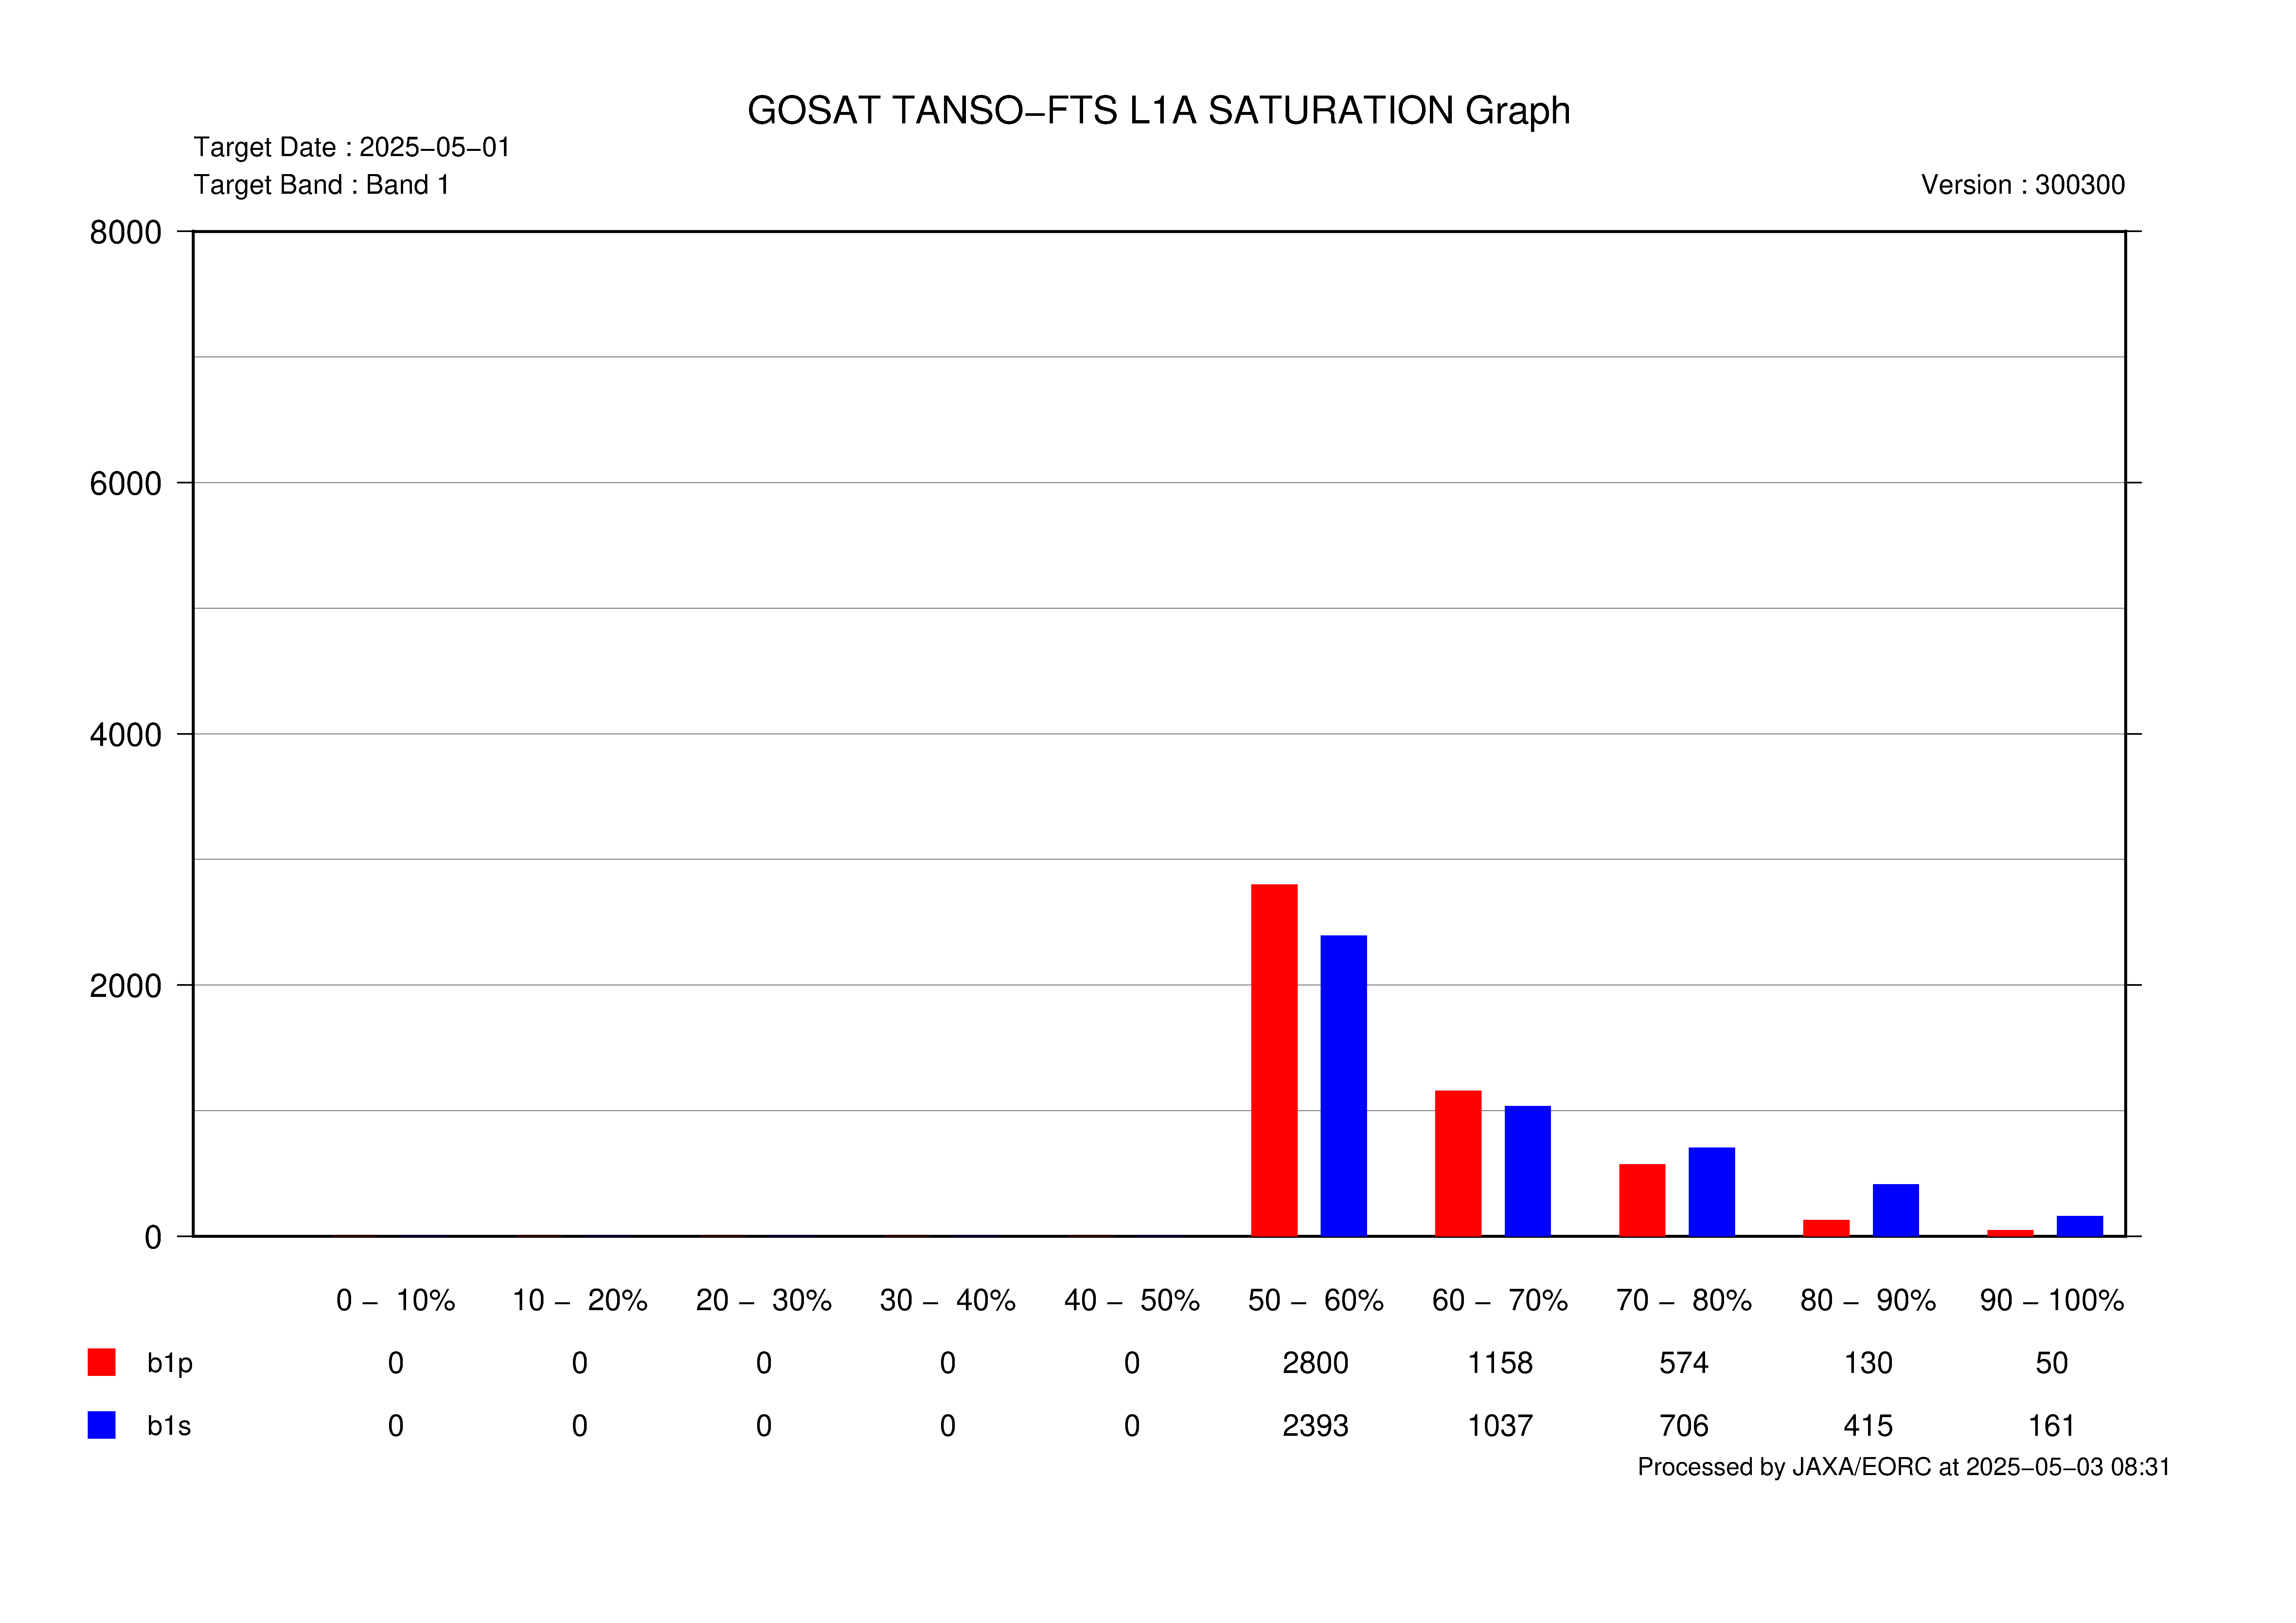
- L1A Band1
- L1A Band2
- L1A Band3
- L1A Band4
GOSAT path number map
Cycle 1
- Map :
- Path Map Image
Path number : 42 1 4 7 10 13 16 19 22 25 28 31 34 37 40
Cycle 2
- Map :
- Path Map Image
Path number : 43 2 5 8 11 14 17 20 23 26 29 32 35 38 41
Cycle 3
- Map :
- Path Map Image
Path number : 41 44 3 6 9 12 15 18 21 24 27 30 33 36 39 42
Archives
- 2026 (Latest Data)
- 2025
- 2024
- 2023
- 2022
- 2021
- 2020
- 2019
- 2018
- 2017
- 2016
- 2015
- 2014
- 2013
- 2012
- 2011
- 2010
- 2009
