Image Library
Emergency Observation on the Solomon Islands Earthquake
At around 5:39 a.m. on April 2 (Japan Standard Time, JST, or at around 7:39 a.m. local time,) an 8.1 magnitude earthquake hit the Solomon Islands. The Japan Aerospace Exploration Agency (JAXA) performed emergency observations using the Advanced Land Observing Satellite "Daichi," and, as a result of the data analysis, we were able to acquire image data of disaster-stricken areas by the onboard observation equipment, AVNIR-2*1 and PALSAR*2. (Please see the following images.)
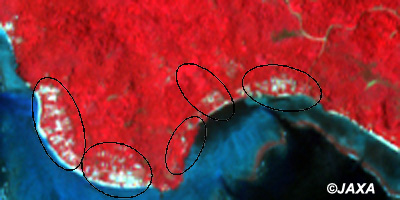
Figure 1 is an image taken by the AVNIR-2 at around 8:38 a.m. on April 8. It is a false color image*3 allocating the band 4, 3, and 2 to red, green and blue respectively. In this image, trees are in red, and bodies of water are darkened. Figure 2 is an enlarged image of the southern region of Gizo Island, which was closer to the epicenter. Figure 3 is an image of the same area taken on March 8, 2007 showing the landscape before being hit by the earthquake. By comparing them, we were able to clarify the areas where forests and trees seemed to be destroyed by tsunami waves.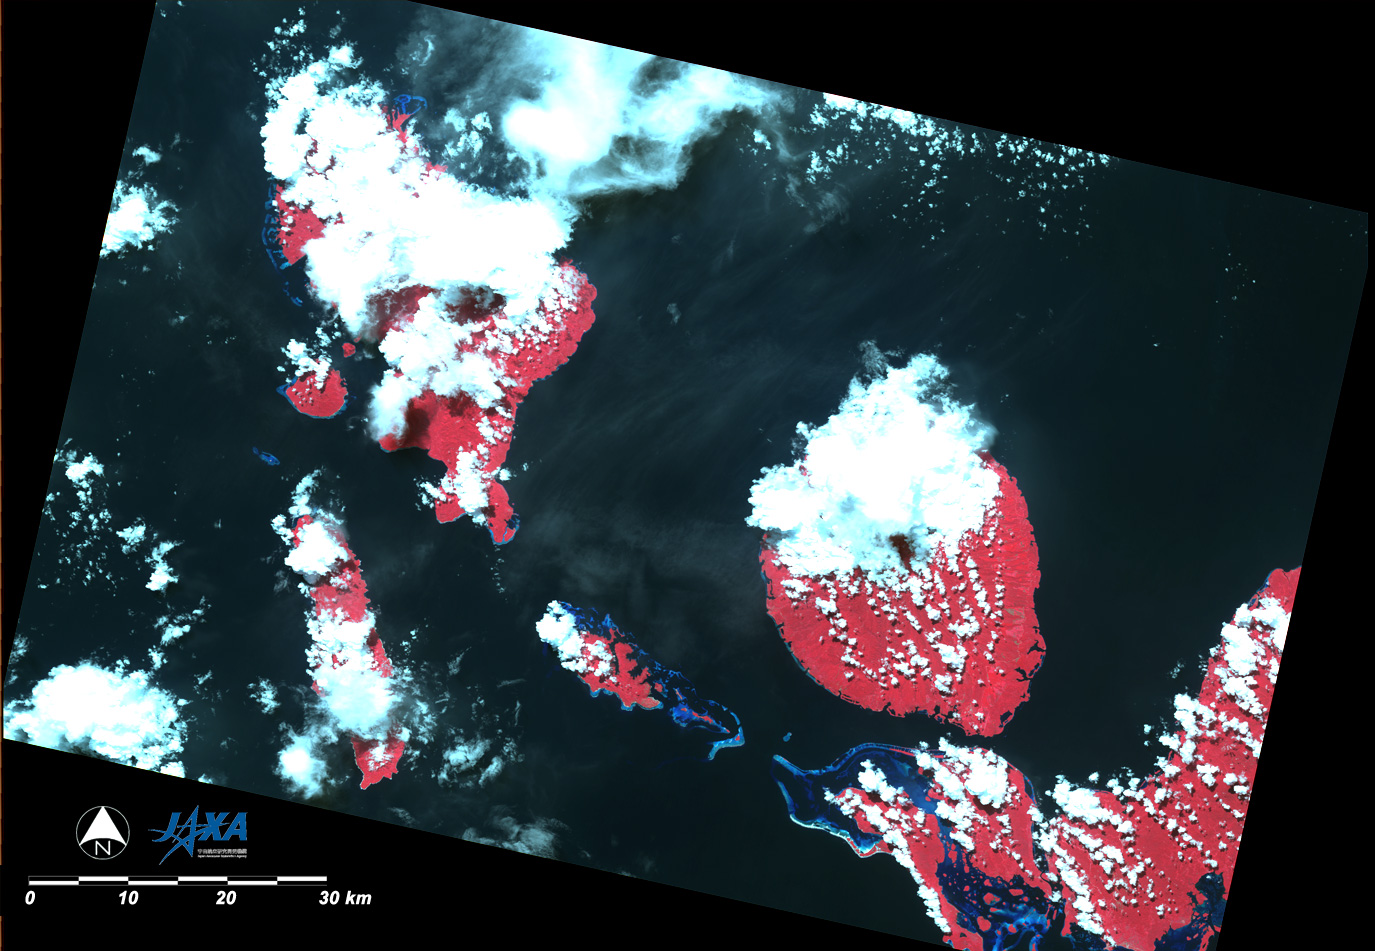
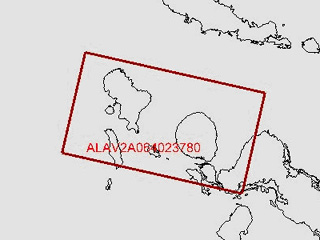
(The map below shows the location of the above satellite image.)
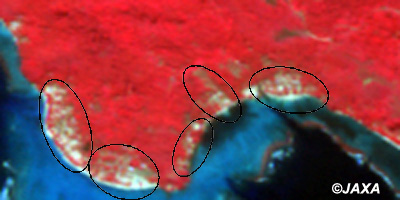
The enlarged image of the southern area of Gizo Island taken by the AVNIR-2 on April 8, 2007.
Compared to Figure 3 below, which shows the area before the earthquake, trees and forests shown in red obviously decreased in the black circled areas.
It appears to have been caused by tsunami waves.
Enlarged Image taken by AVNIR-2 on March 8, 2007
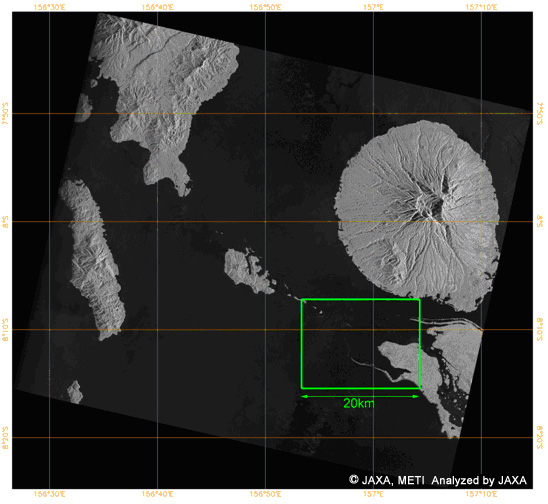
This image taken by the PALSAR (on April 8, 2007) shows the area encircled by a square in Figure 4. Compared to Figure 6 below, which shows the Area A at the time of low-tide level, the land obviously extended (circled by a green line.)
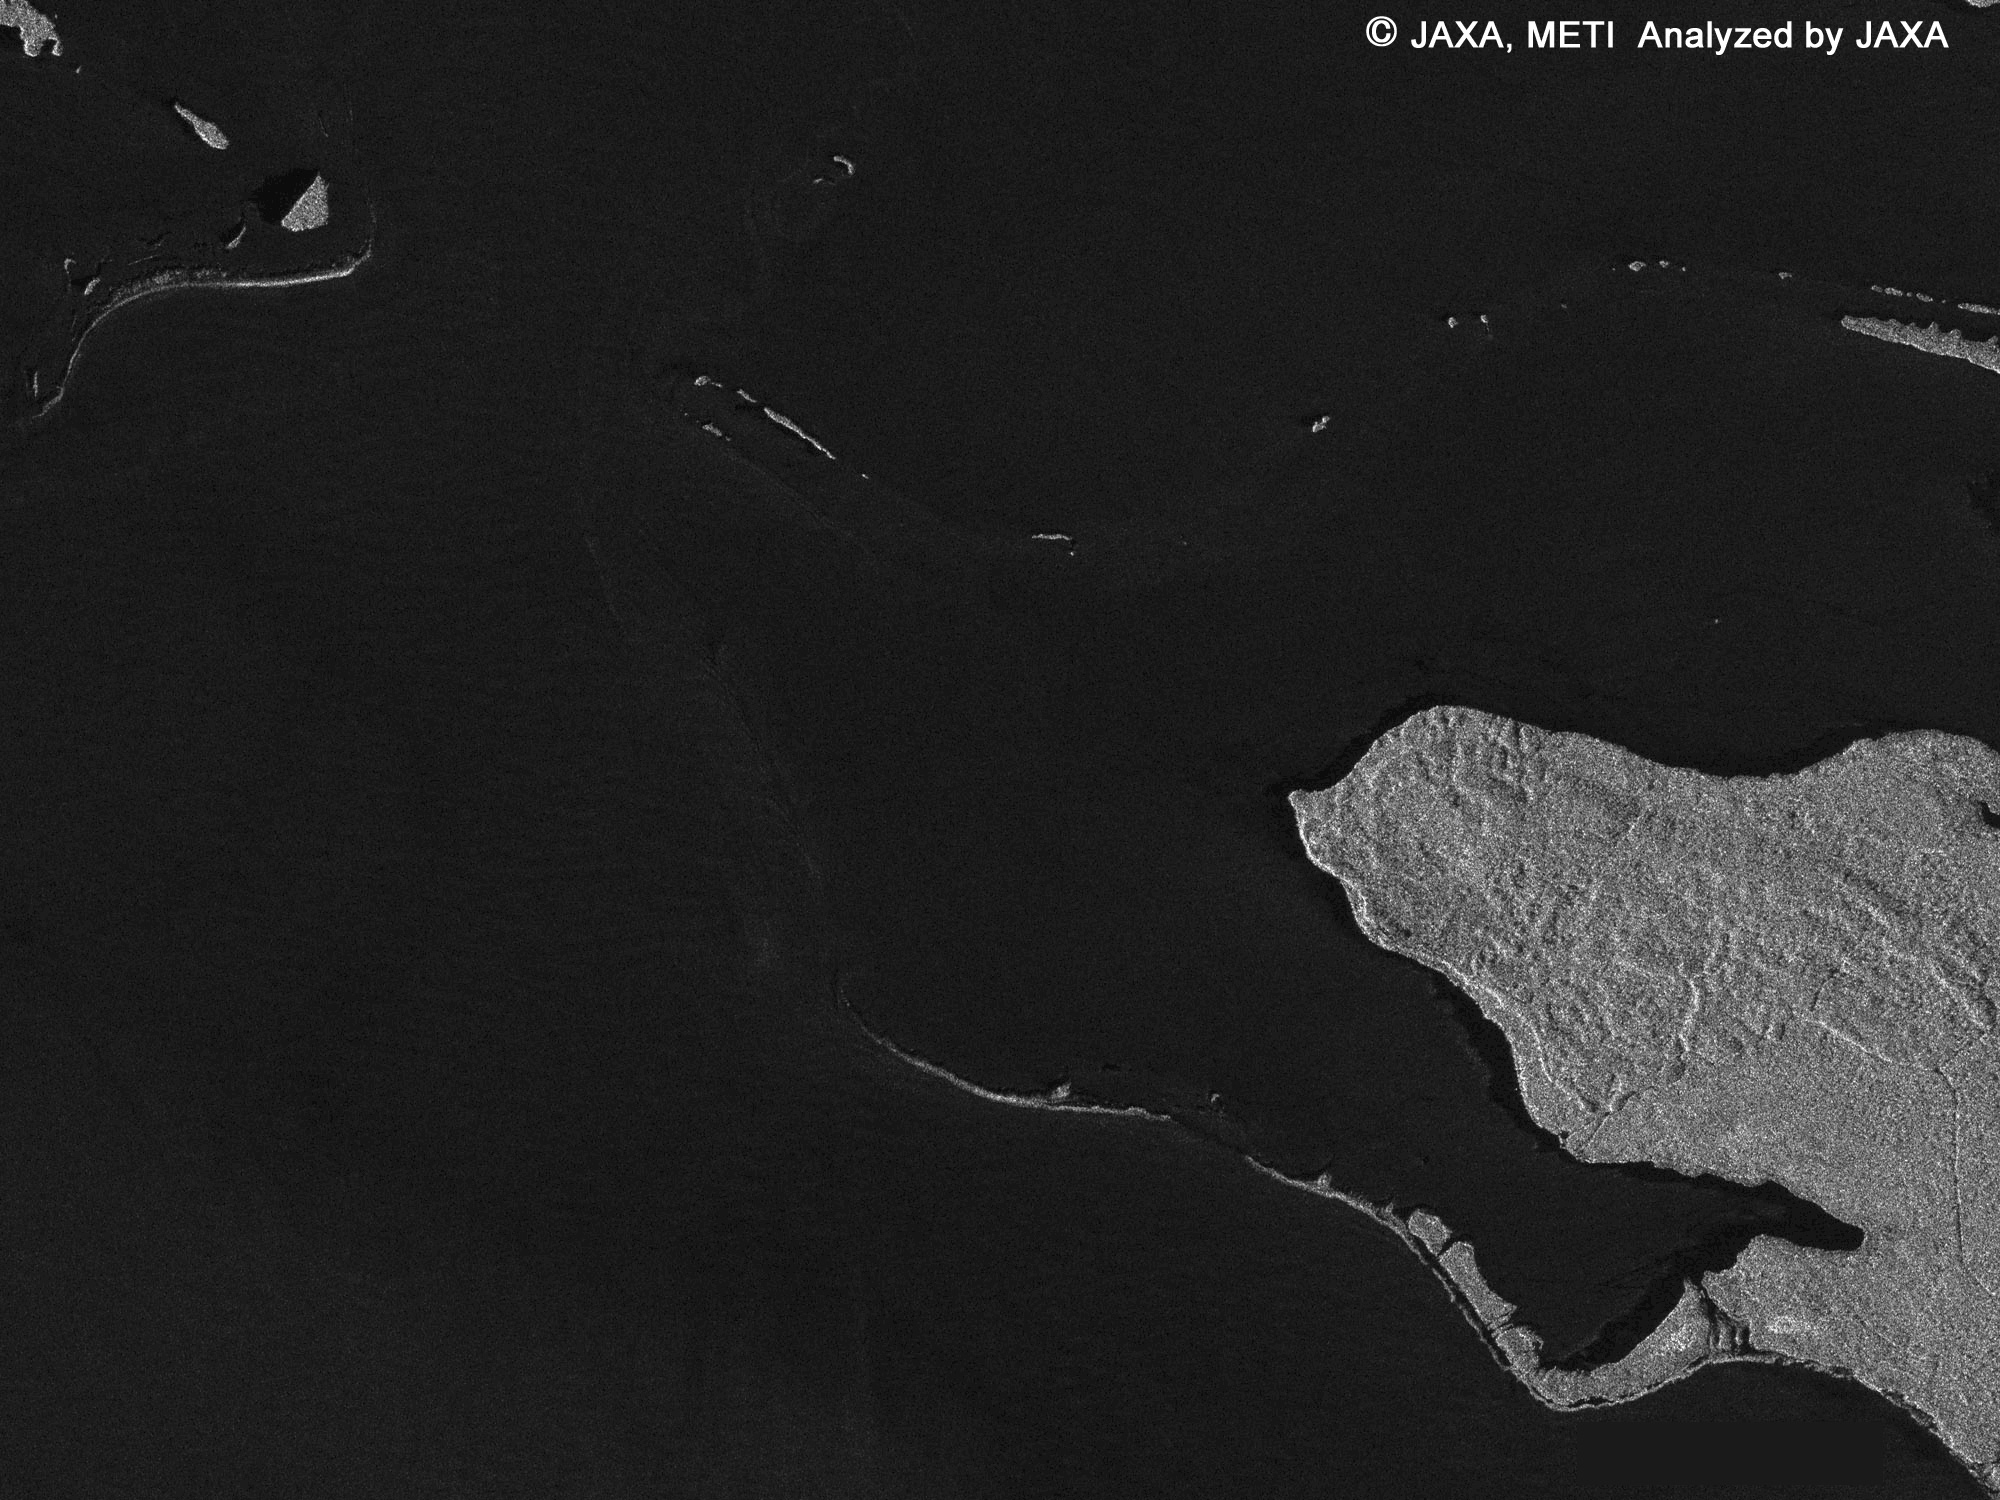
The same area as Figure 5 taken by the PALSAR (on January 31, 2007). It was taken when the tide level was at its lowest.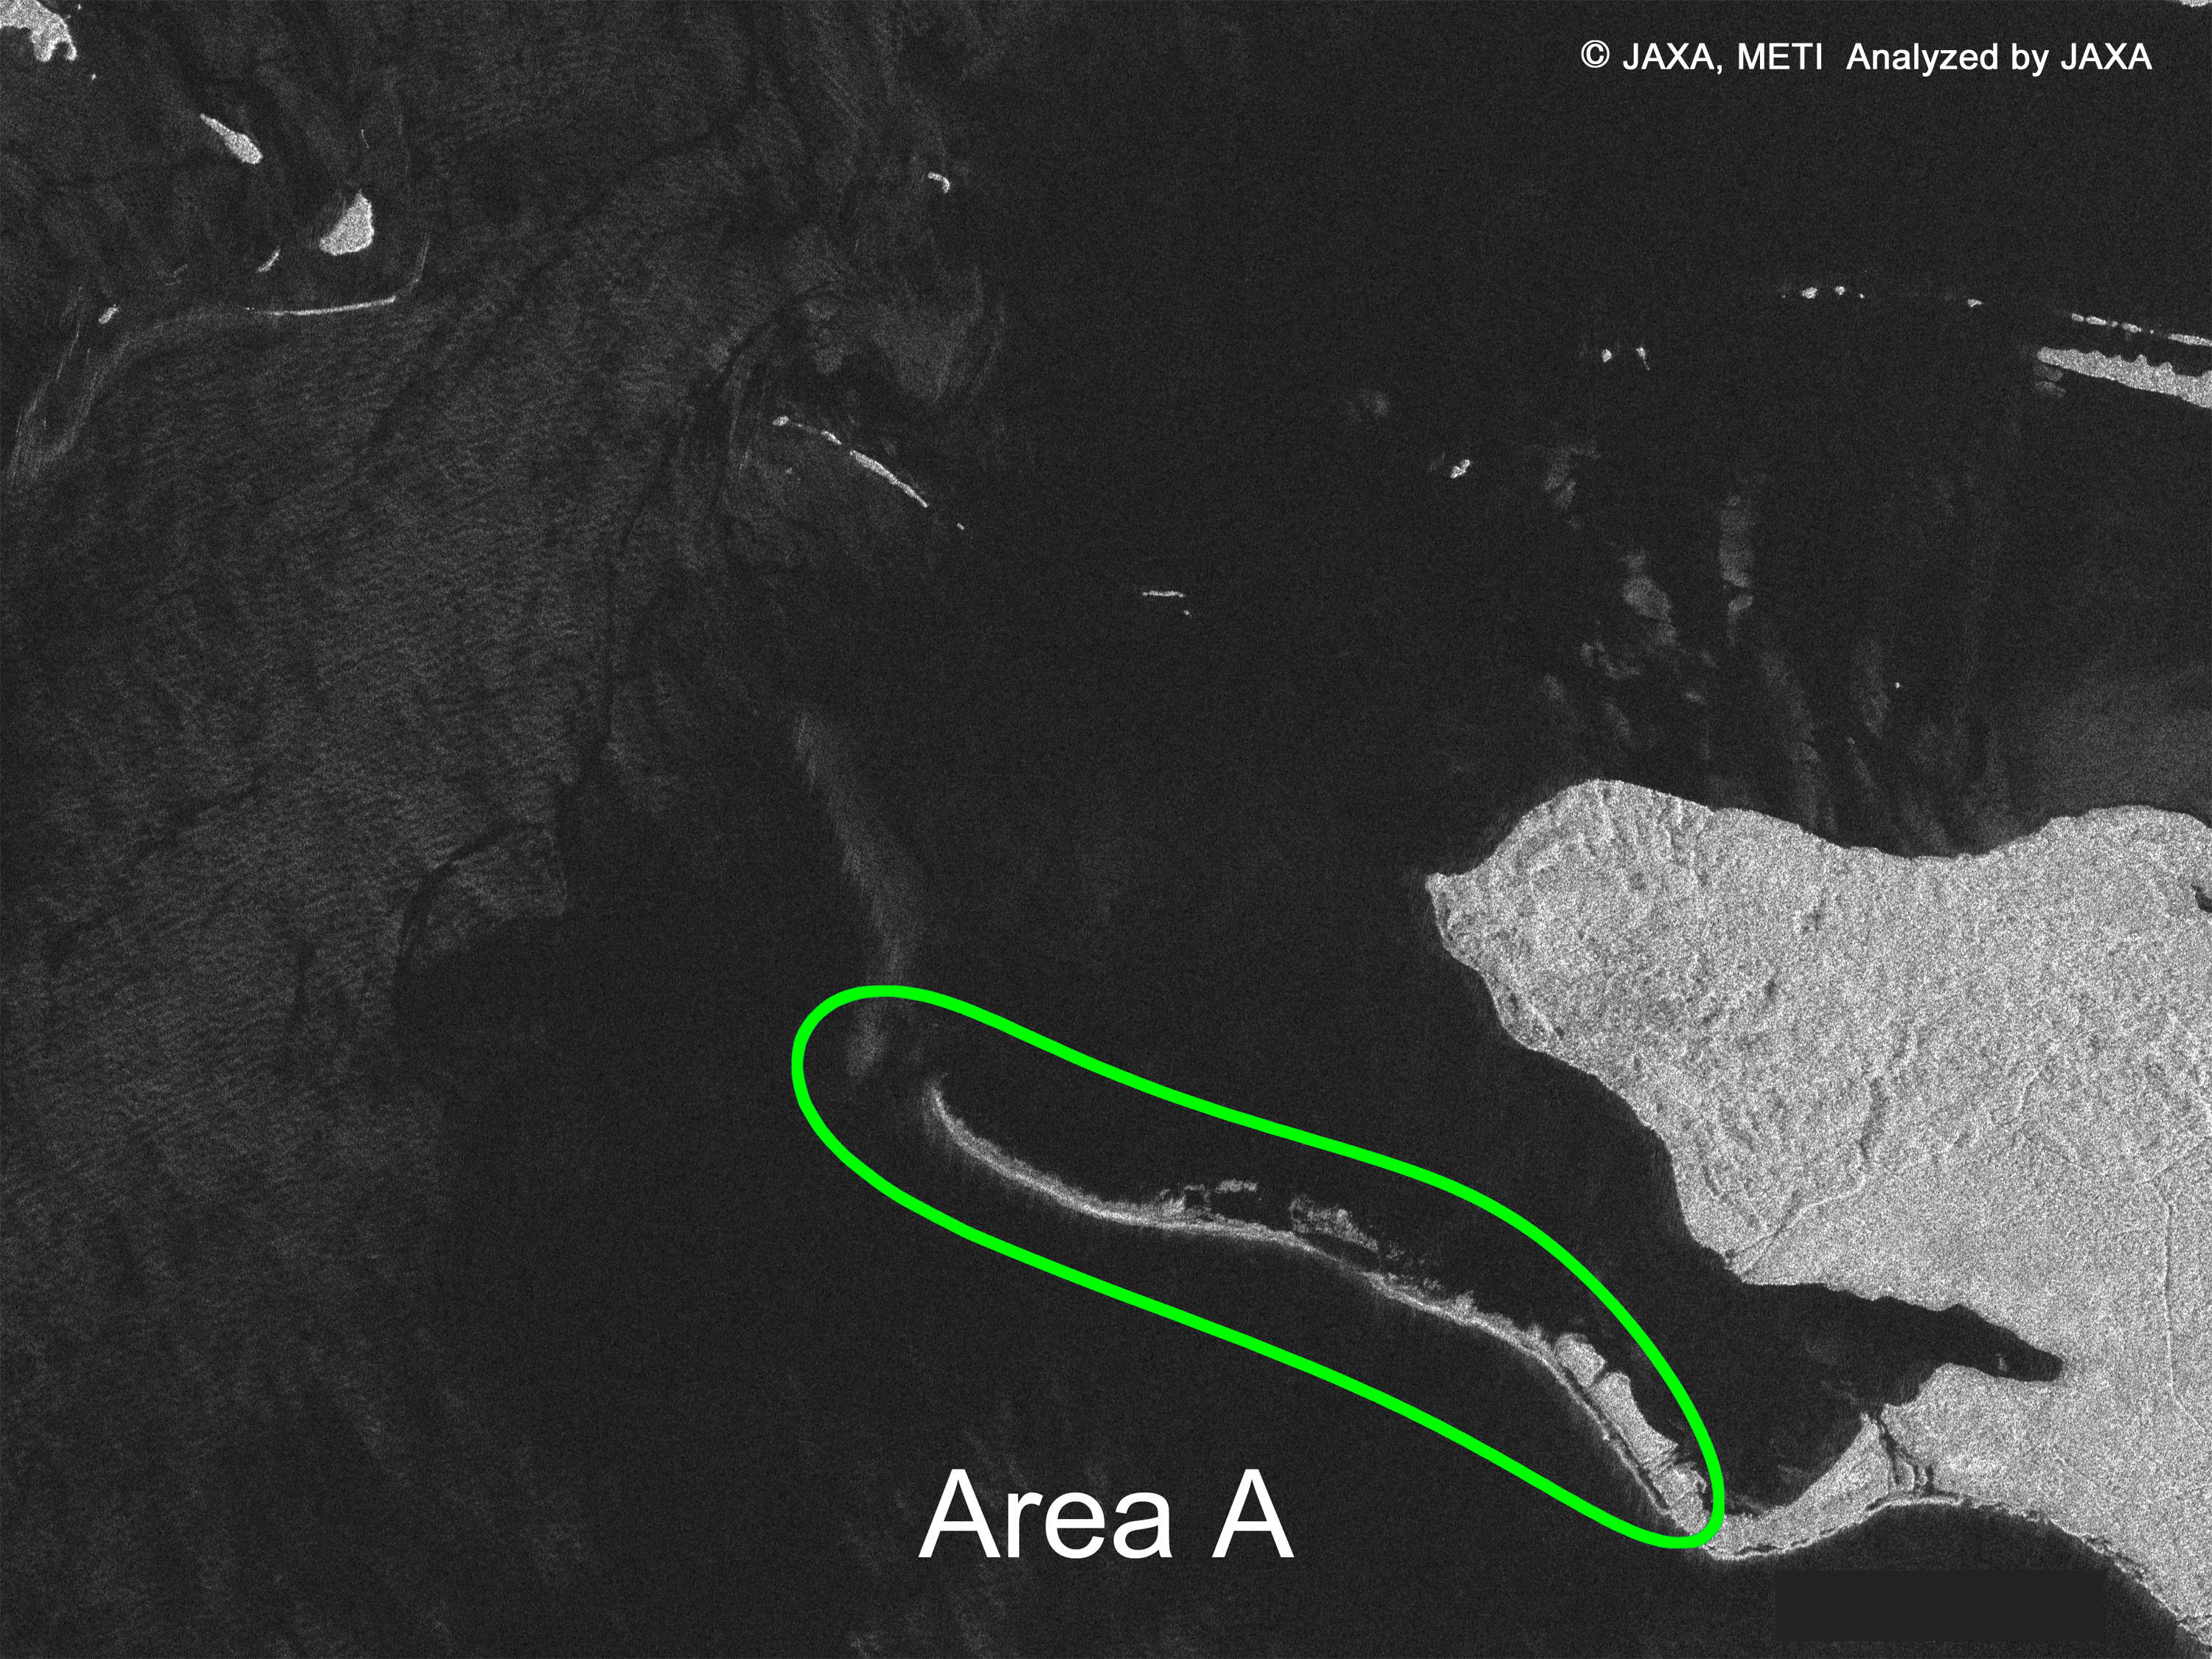
*1 AVNIR-2 can acquire color images with its resolution of 10 meters on the ground when Daichi is above that spot.
*2 PALSAR is a microwave sensor receiving radio wave reflections transmitted from the satellite. It can acquire image data regardless of the weather and time of a day.
*3 False color images are synthetic color images by allocating bands of colors that are different from actual colors visible by the human eye. In this case, the high sensitive near infrared band (Band 4) was allocated with red to show plants and trees in order to clearly show their change.