Image Library

ALOS/PALSAR Observation Results of the Magnitude-6.3 Earthquake in the South Island of New Zealand in 2011

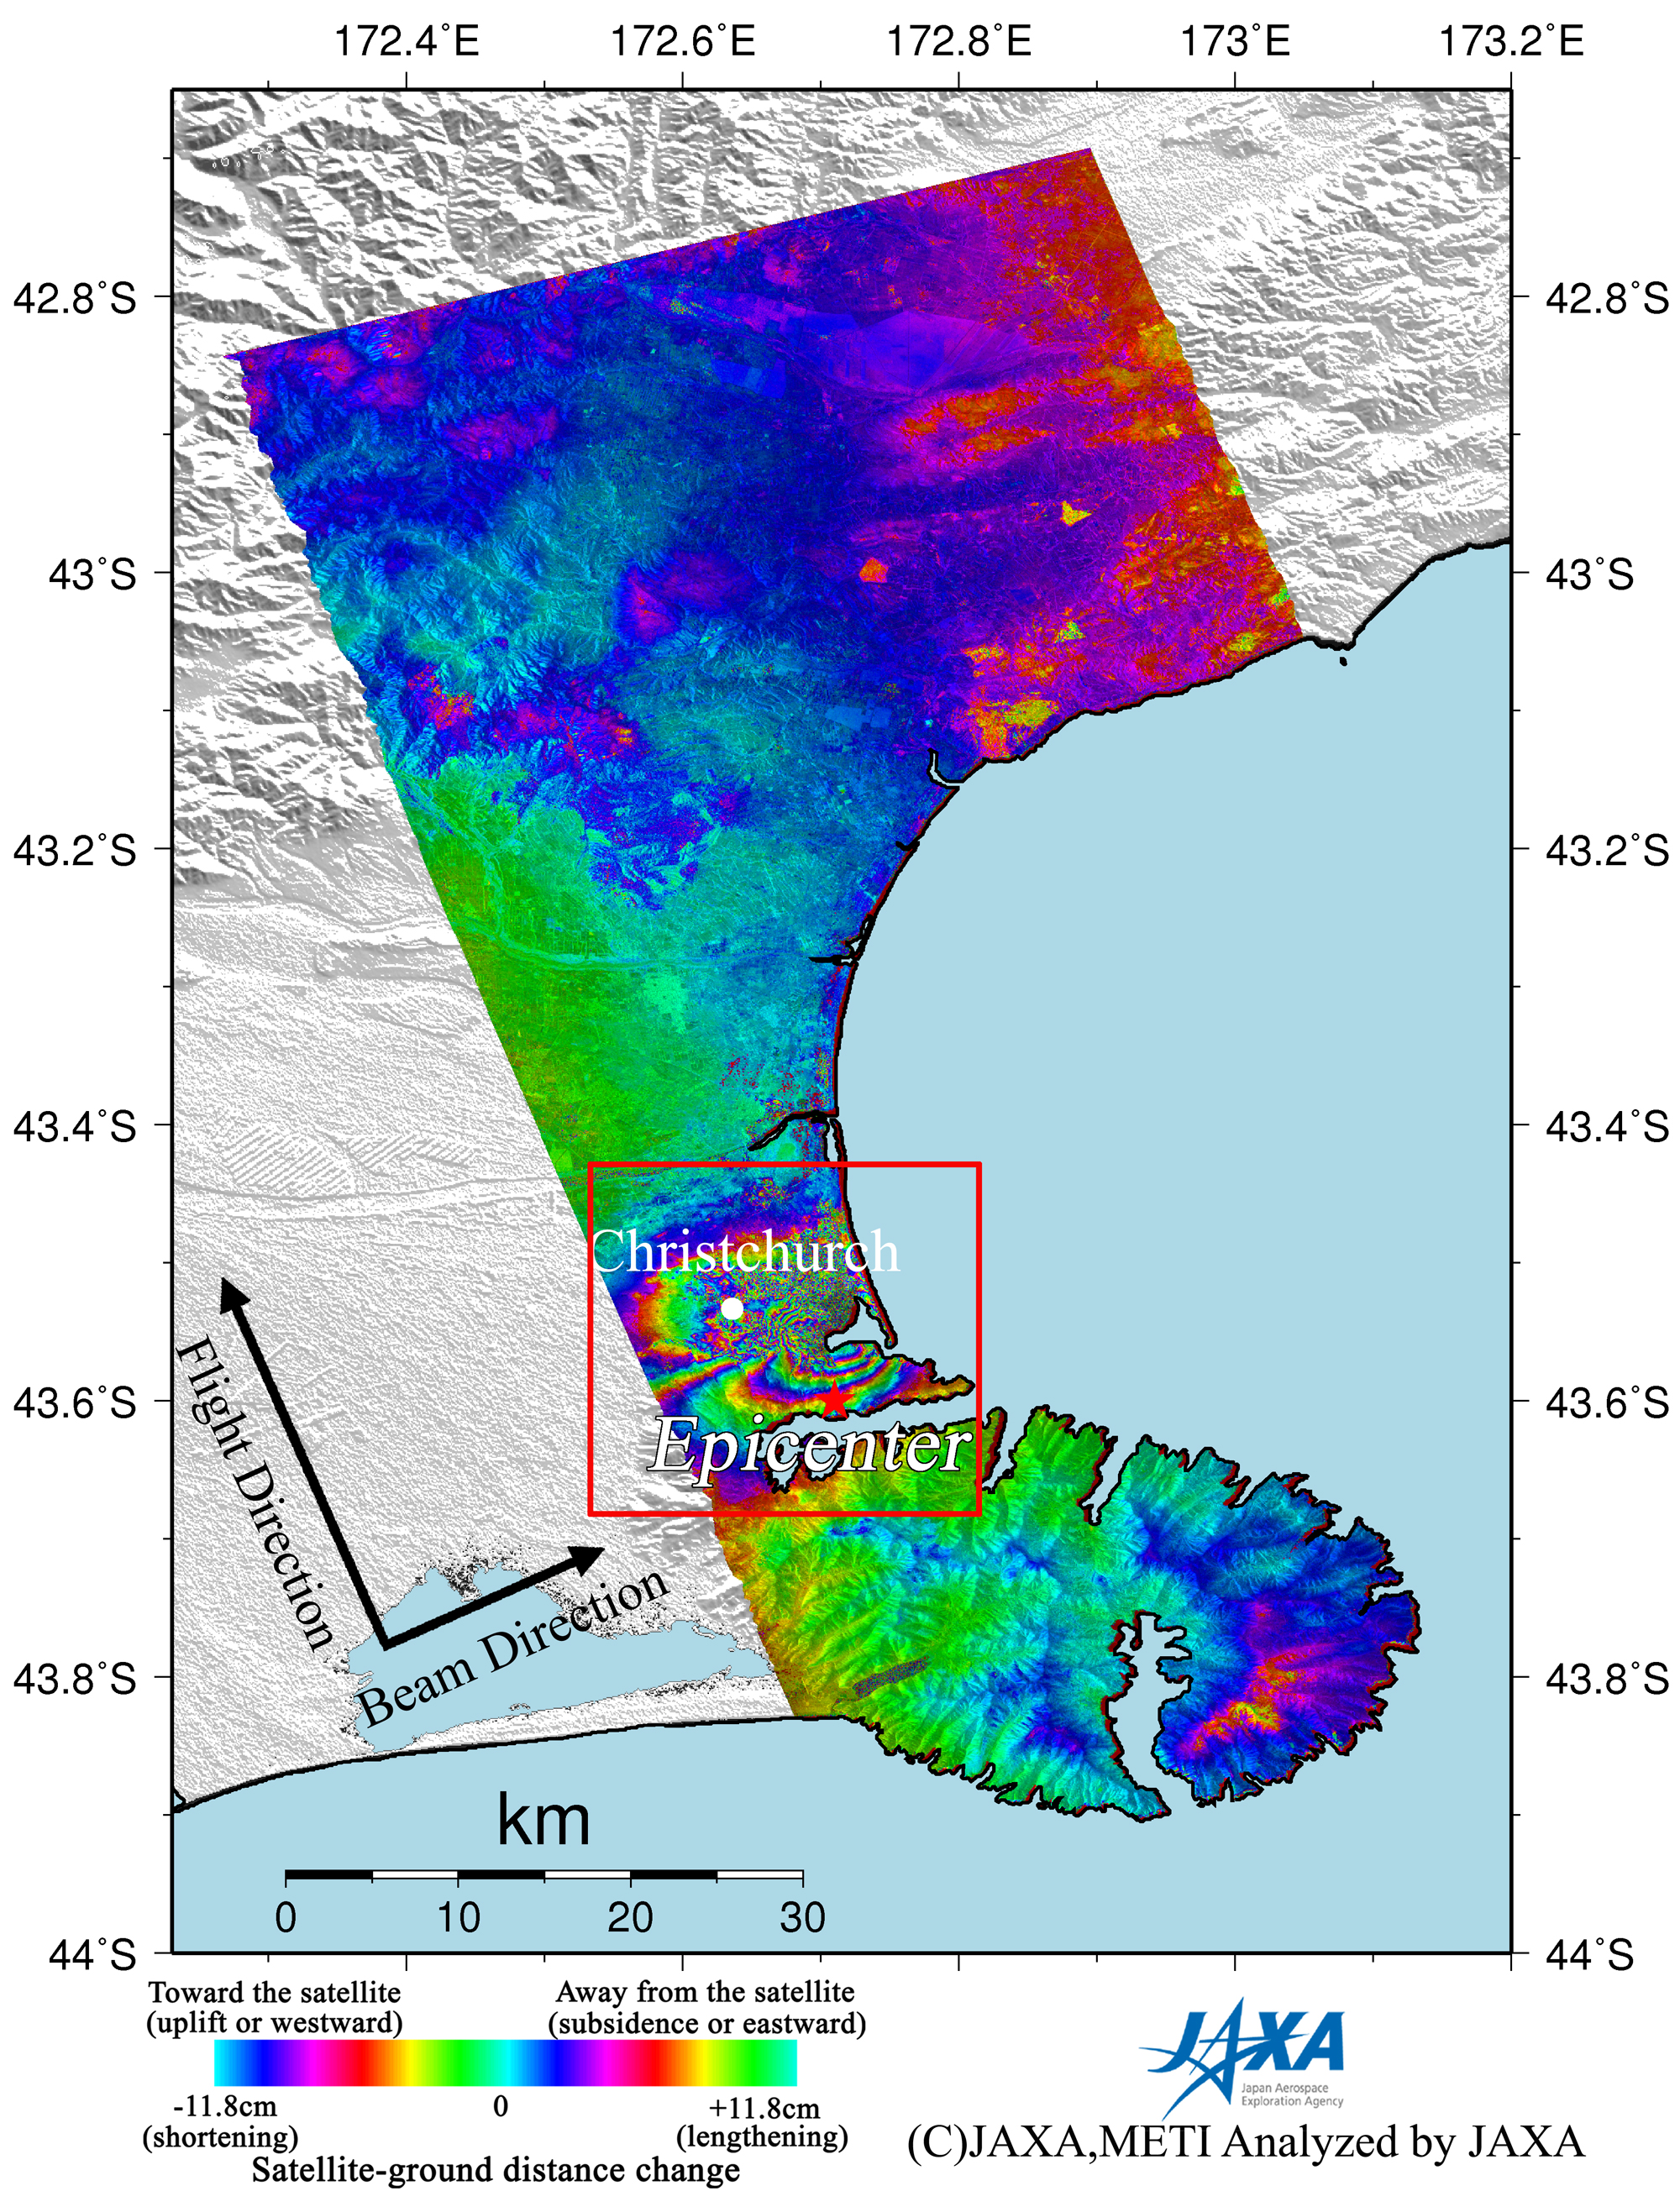
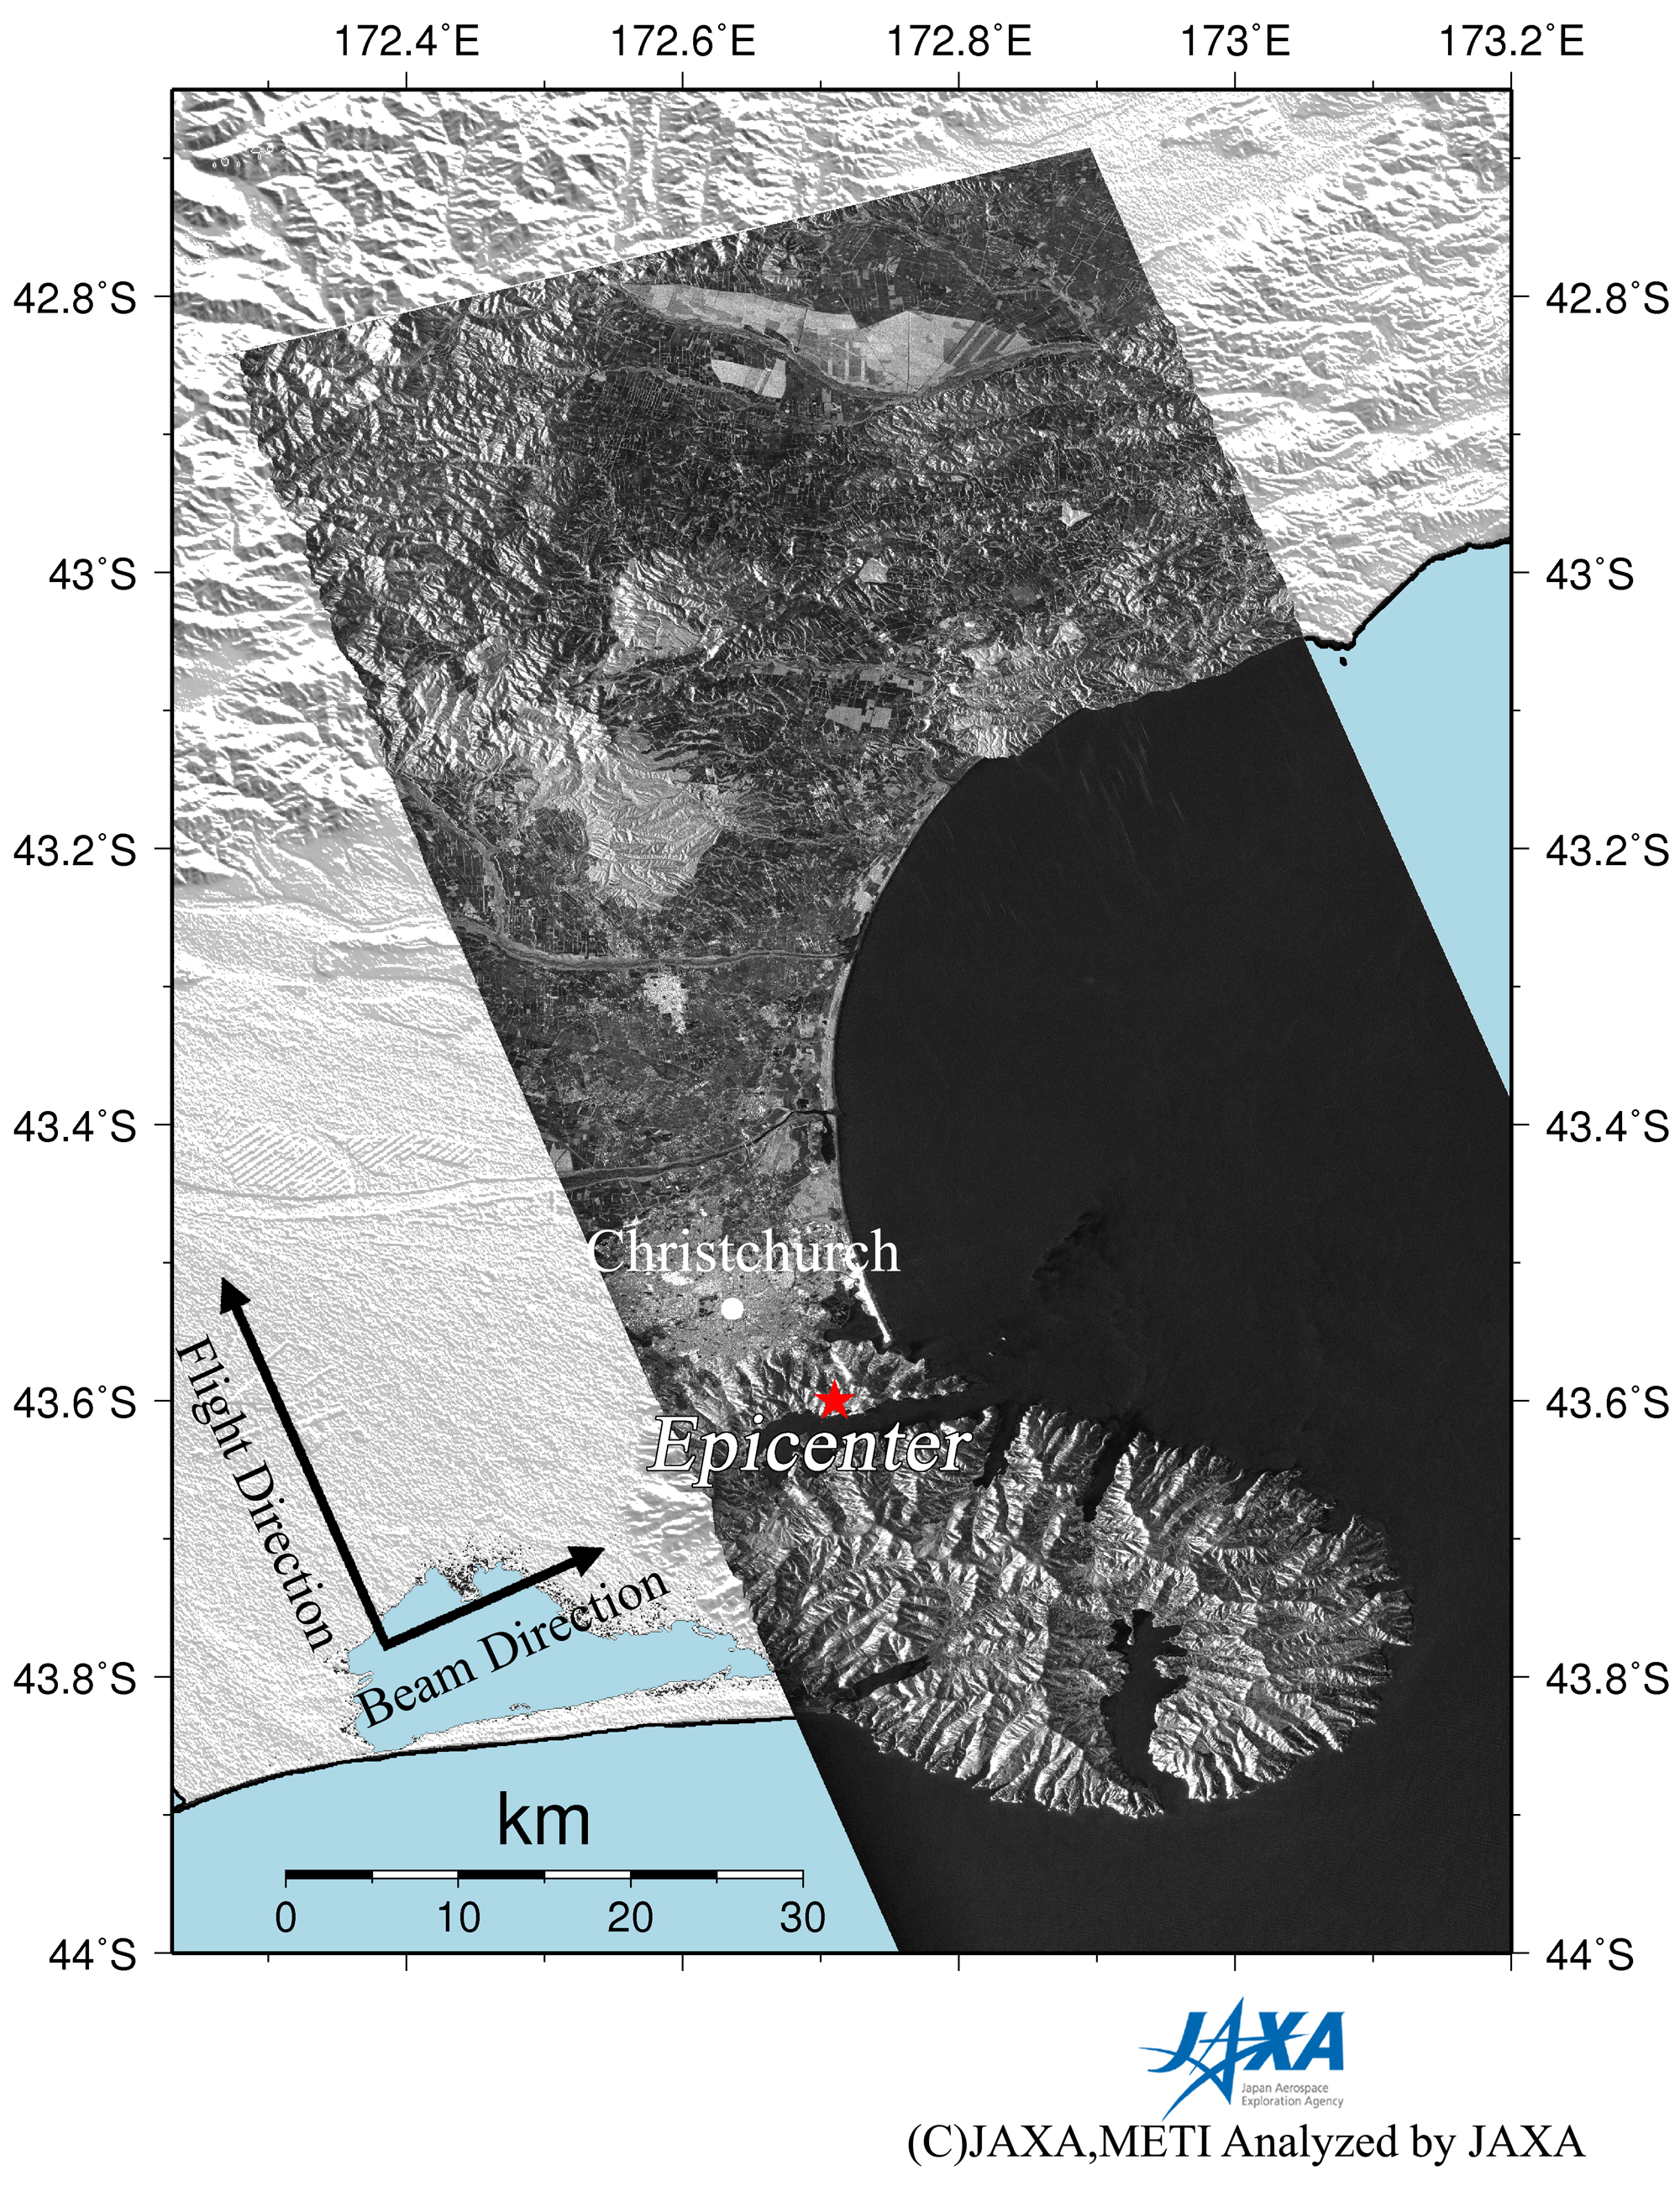
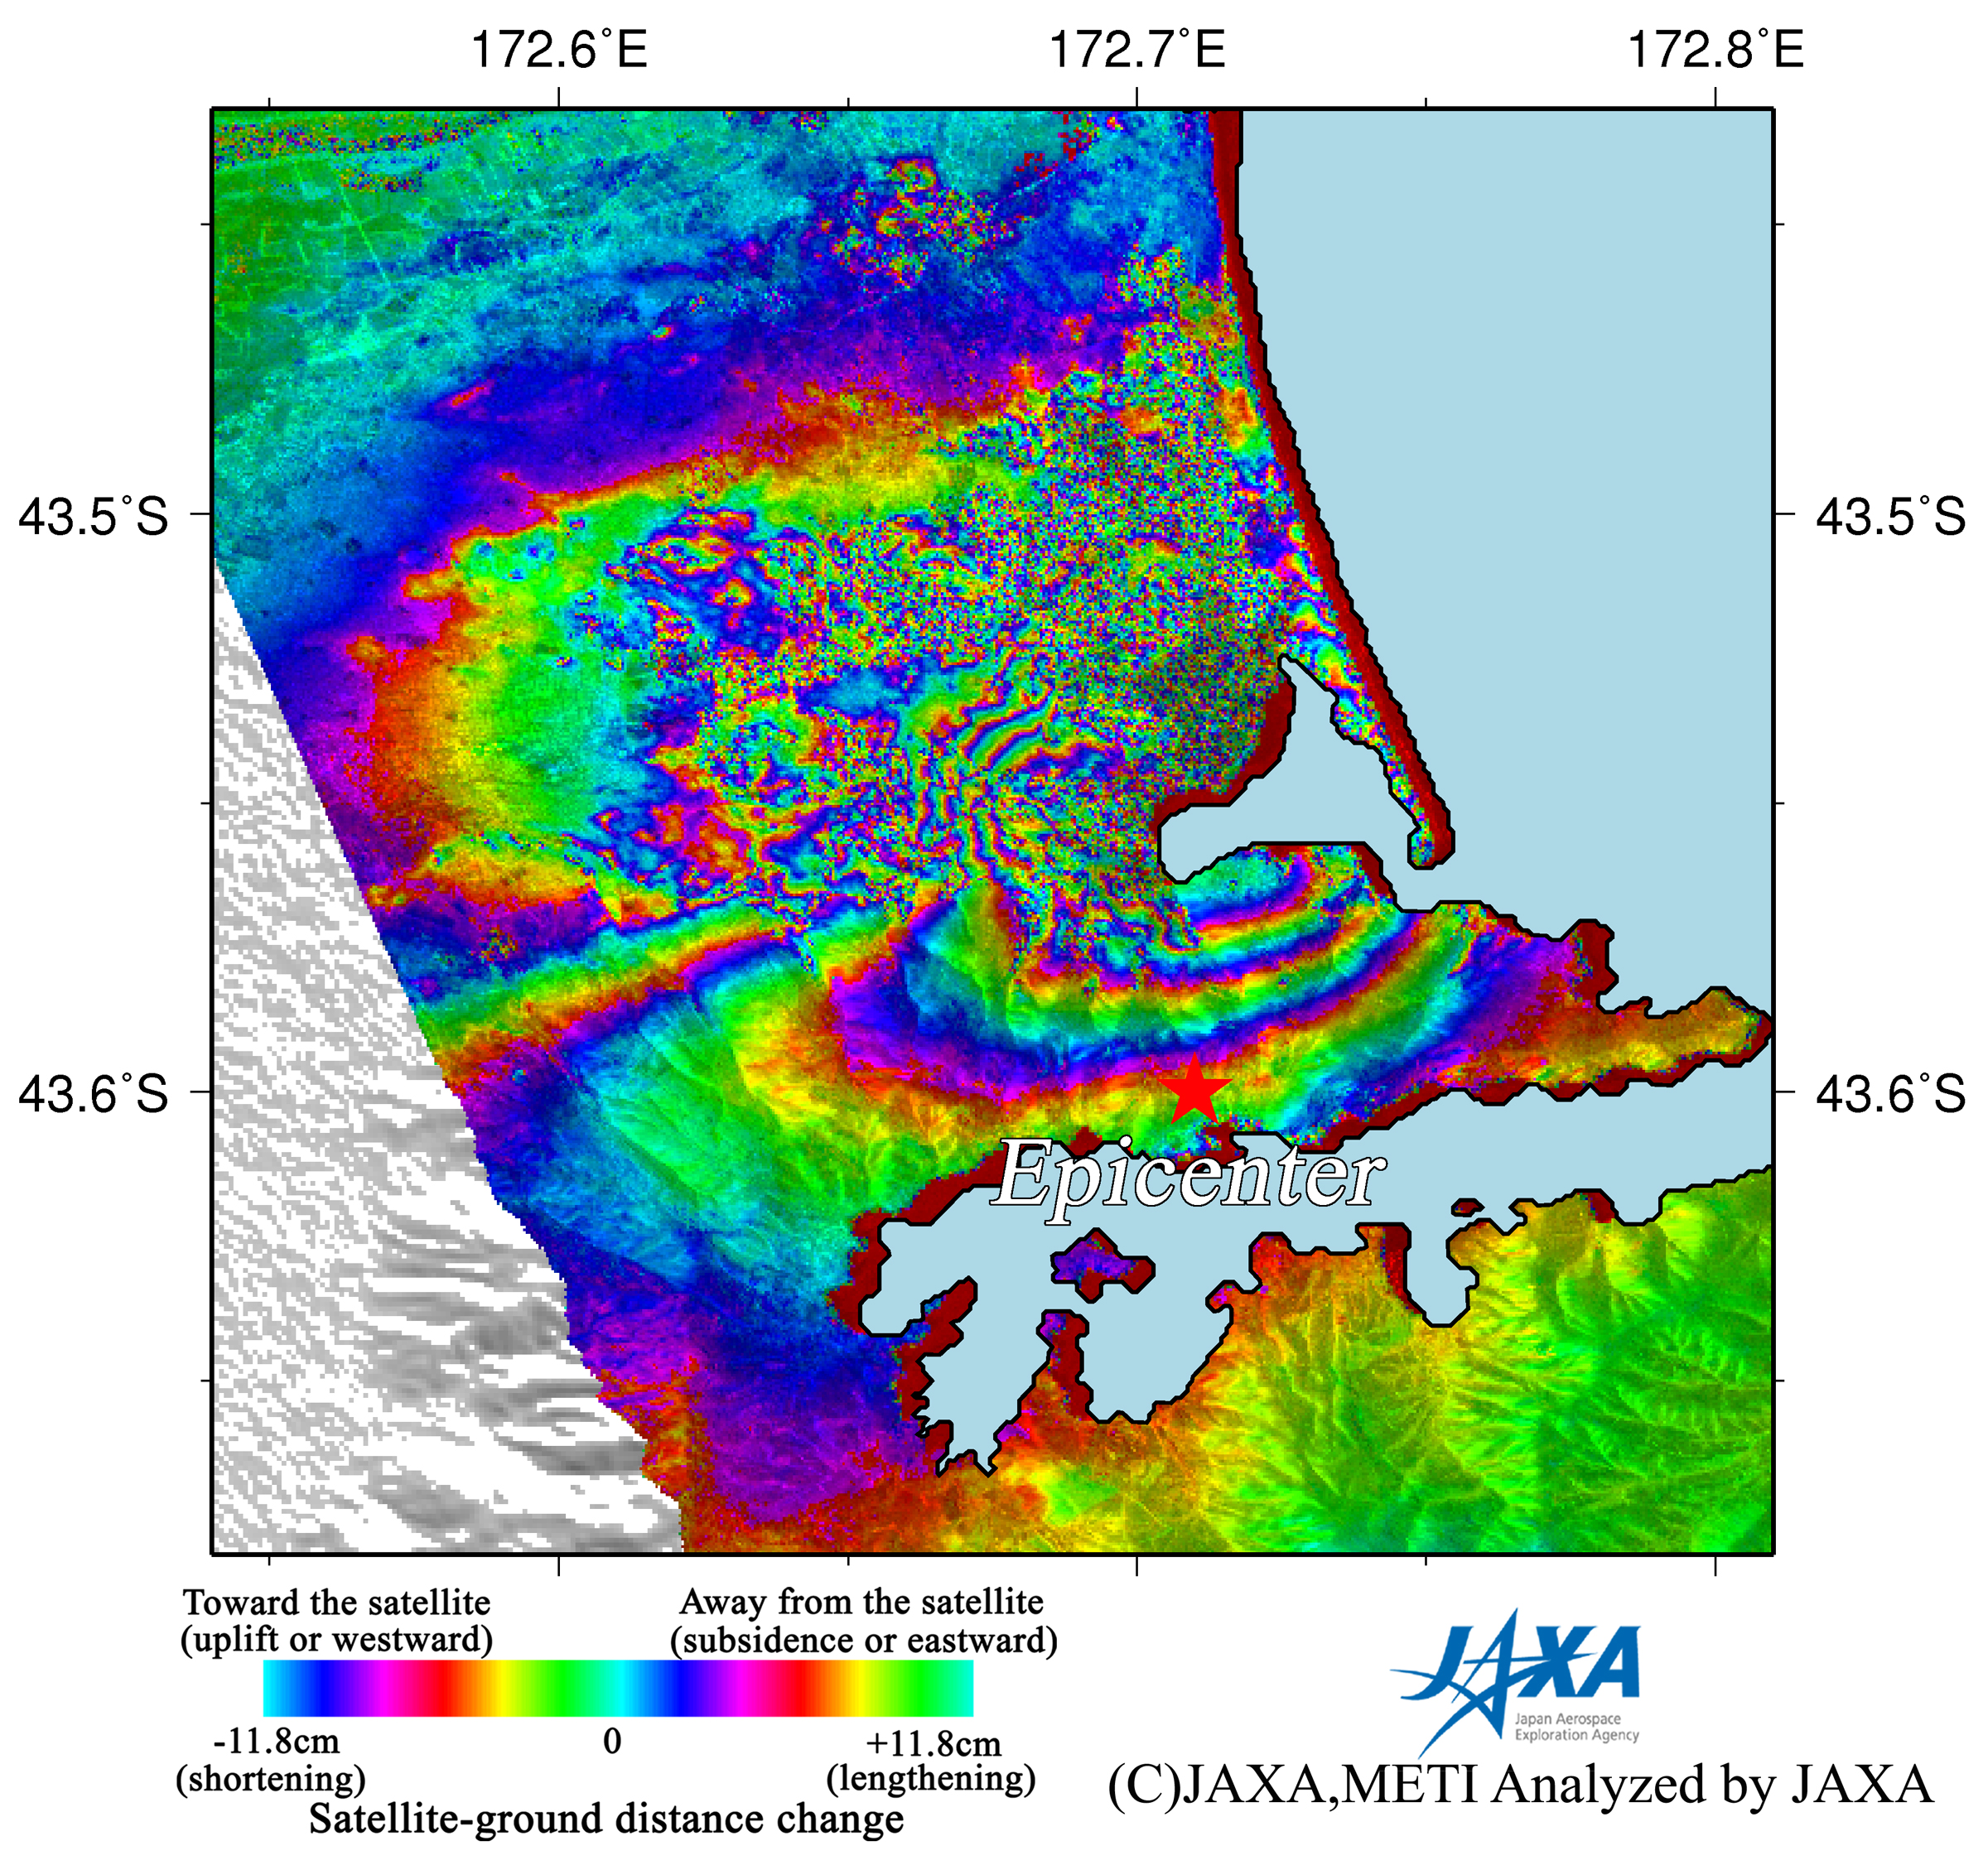
On February 21, 2011 (UTC), a magnitude 6.3 earthquake occurred inland (43.60°S, 172.71°E, 5 km in depth) on New Zealand's South Islands, where is 40km east from the epicenter of the previous earthquake (Darfield Earthquake) on September 4, 2010. The Japan Aerospace Exploration Agency (JAXA) performed an emergency observation on February 25 using the Phased Array type L-band Synthetic Aperture Radar (PALSAR) installed on the Advanced Land Observing Satellite (ALOS). In this report, we conduct differential interferometric SAR (DInSAR) processing to detect crustal deformation associated with the earthquake using PALSAR data acquired before (January 10, 2011) and after (February 25, 2011) the earthquake.

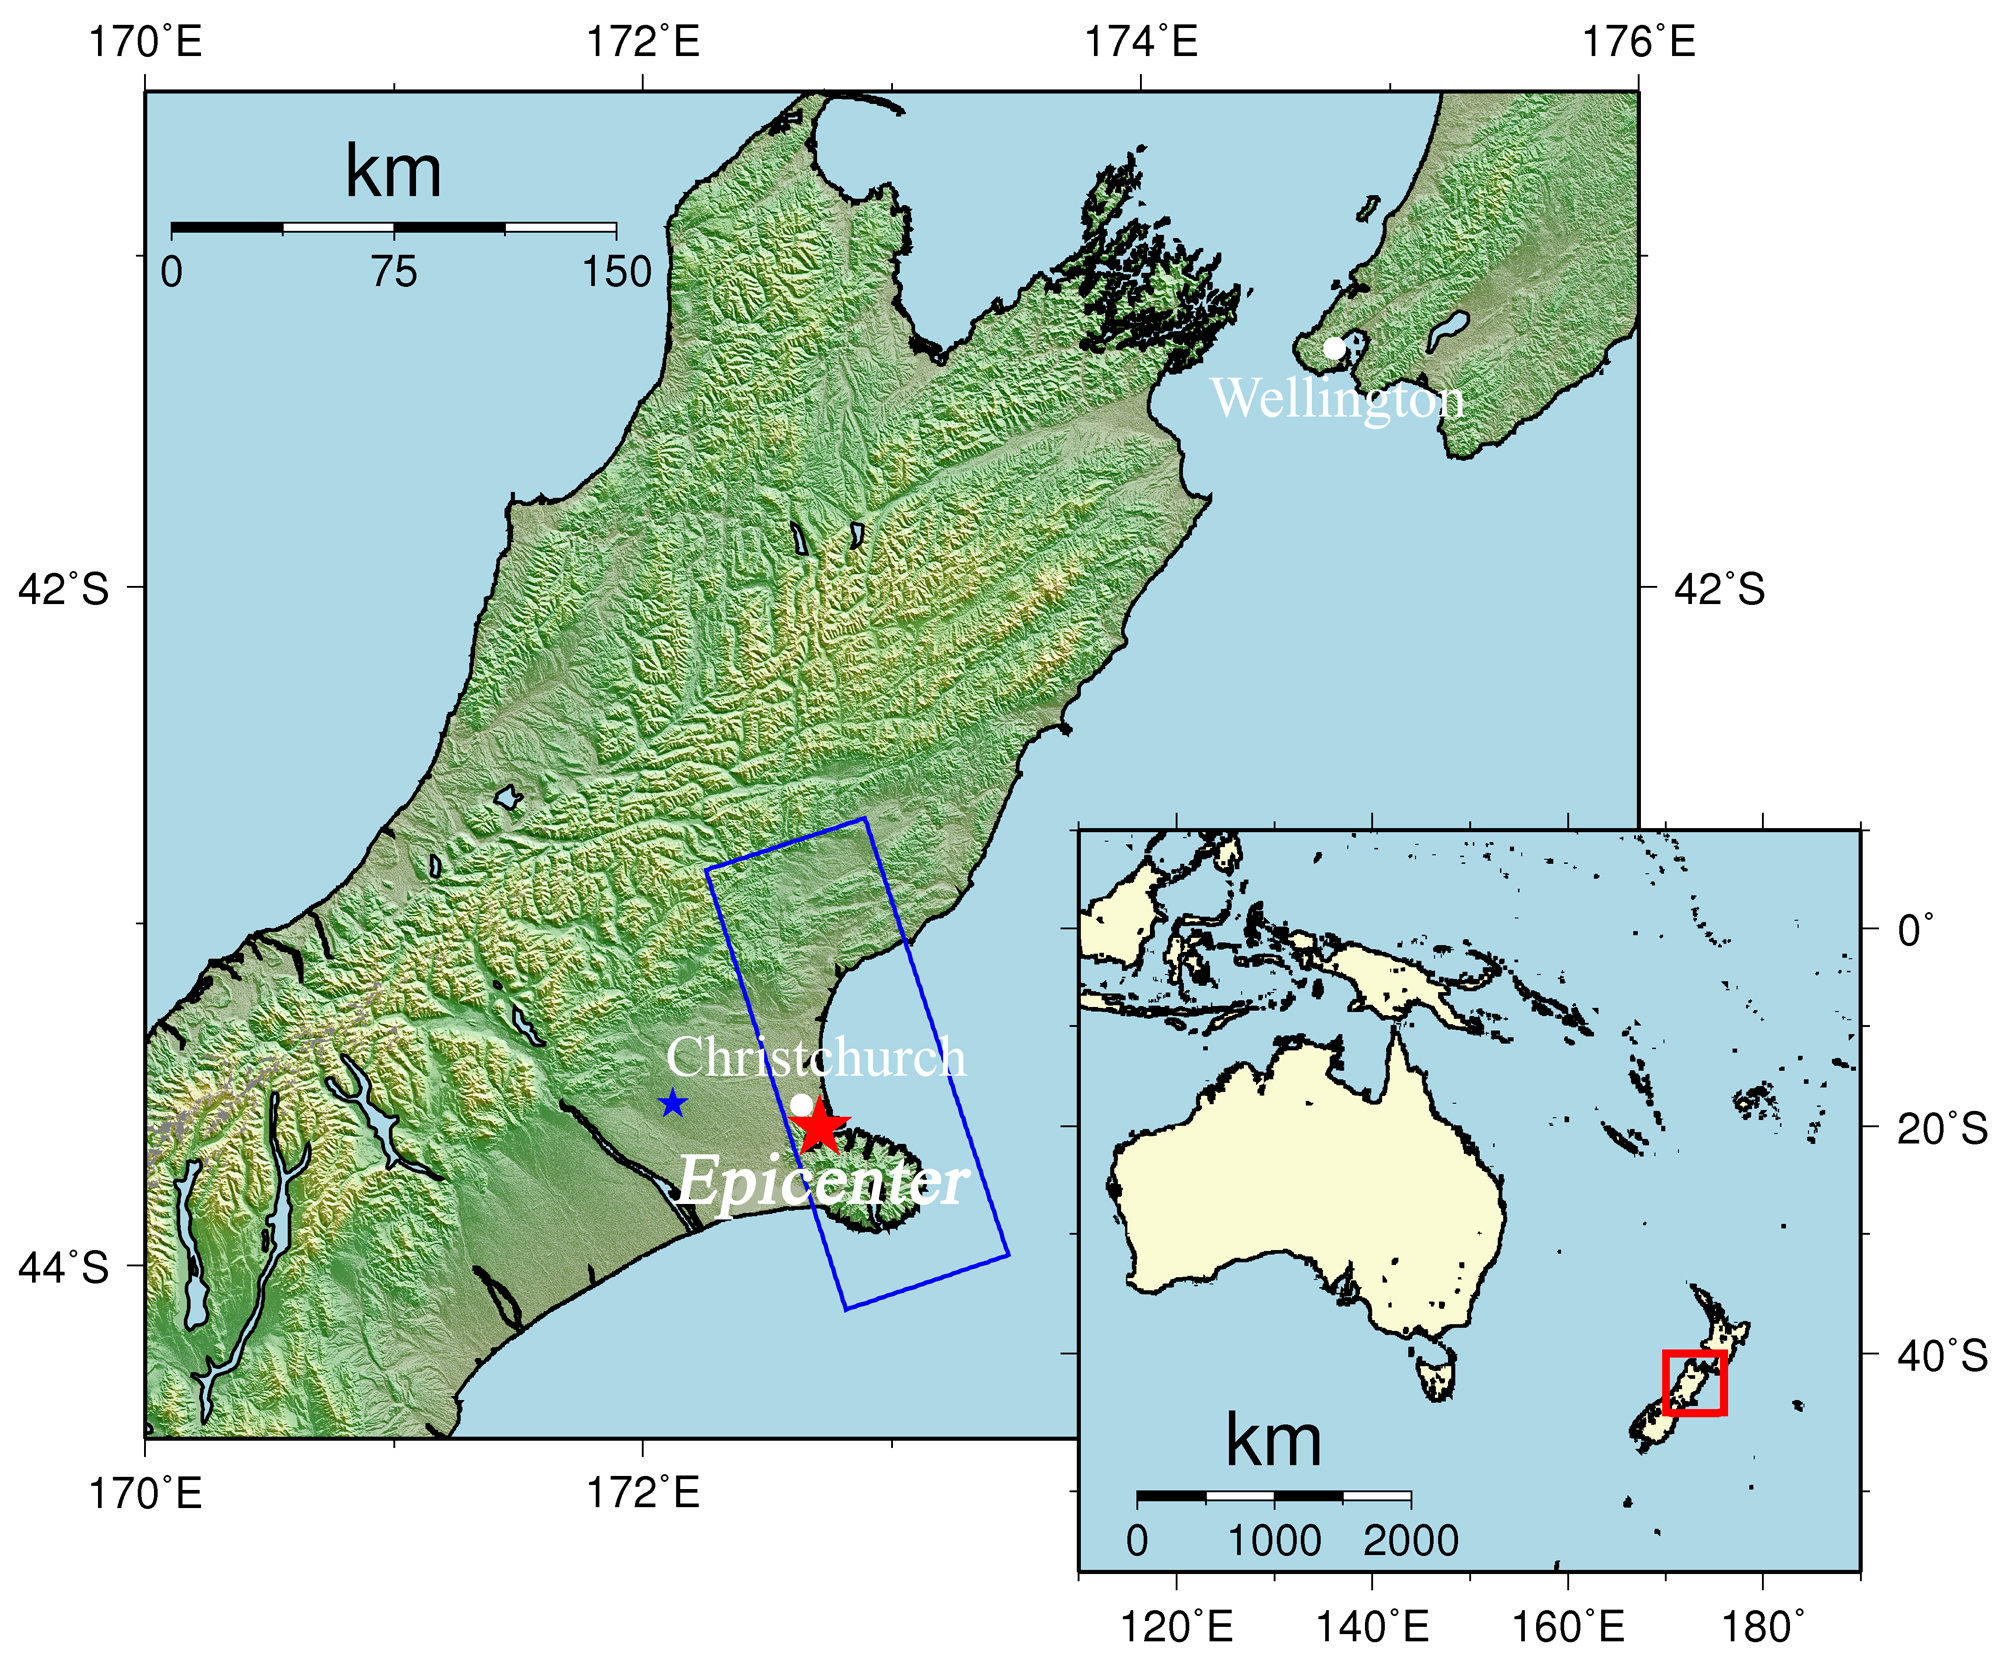
ALOS/PALSAR observed the epicentral area including Christchurch where was severely damaged by the 2011 earthquake.

The blue rectangle indicates the observation area shown in Fig. 2. The red star represents the epicenter of this earthquake, and the blue star represents the epicenter of the previous earthquake on September 4, 2010.
Fig.1
Fig.1: An overall view of the observation area (We refer to SRTM3 as terrain data).
(Click to view enlarged image)
Fig.2
Fig.2: PALSAR interferogram indicating crustal deformation
(Click to view enlarged image)
Fig.2
Fig.2: PALSAR amplitude image observed after the earthquake (2011/2/25)
(Click to view enlarged image)
Figure 2 (left) is an interferogram generated from PALSAR data using the DInSAR technique. Figure 2 (right) is a PALSAR amplitude image acquired after the earthquake. In the interferogram of Figure 2 (left), there are obvious color fringes in the epicentral area around Christchurch. A color fringe illustrates changes of satellite-ground distance, meaning crustal deformation along a slant range, for the period. The resultant interferogram indicates a crustal deformation (more than 40 cm at its maximum) concentrated on Christchurch and the surrounding area. In Figure 3, we found a low coherence area in east area of Christchurch city probably due to heavy liquefactions. Overall fringe pattern shows crustal deformations caused by a right-lateral strike slip or reverse faulting with a strike in the east-west direction. However, different fringe pattern are shown in Christchurch, which may indicate a localized complicated surface deformation due to a quite shallow faulting.
Fig.3
Fig.3: Enlarged interferogram enclosed by the red square in Fig. 2 (left).
(Click to view enlarged image)
JAXA plans to continue ALOS observations of the afflicted area in the New Zealand.
The color changes from blue to red, yellow, green, and back to blue indicate an extension (and an opposite pattern indicates a shortening) of the satellite-ground distance. One color cycle is equal to 11.8 cm.
JAXA EORC