- Top
- Disaster
- 2010
- Observation Results of ALOS/PALSAR Relating to the Magnitude 7.0 Earthquake in Haiti (1)
Observation Results of ALOS/PALSAR Relating to the Magnitude 7.0 Earthquake in Haiti (1)
On January 12, 2010 (UTC), a magnitude 7.0 earthquake occurred in the Republic of Haiti, in the Caribbean. The Japan Aerospace Exploration Agency (JAXA) performed an emergency observation on January 16 using the Phased Array Type L-band Synthetic Aperture Radar (PALSAR) installed on the Advanced Land Observing Satellite (ALOS) to determine the state of damage caused by the earthquake. In this report, we compare PALSAR amplitude images taken before and after the earthquake to detect collapsed buildings in inhabited areas and conduct differential interferometric SAR (DInSAR) analysis to detect crustal deformation associated with the earthquake using the data acquired on February 28, 2009.
The red and blue rectangles indicate observation areas shown in Figure 2 and Figure 6, and the red star represents the epicenter.

Fig.1: An overall view of the observation area (We refer to SRTM3 as terrain data.)
(Click to view enlarged image)
1. Detection of Damaged Area
Reddish or bluish areas in this image indicate change of backscatter for the period, so there is a possibility that some kind of surface change occurred in these areas.
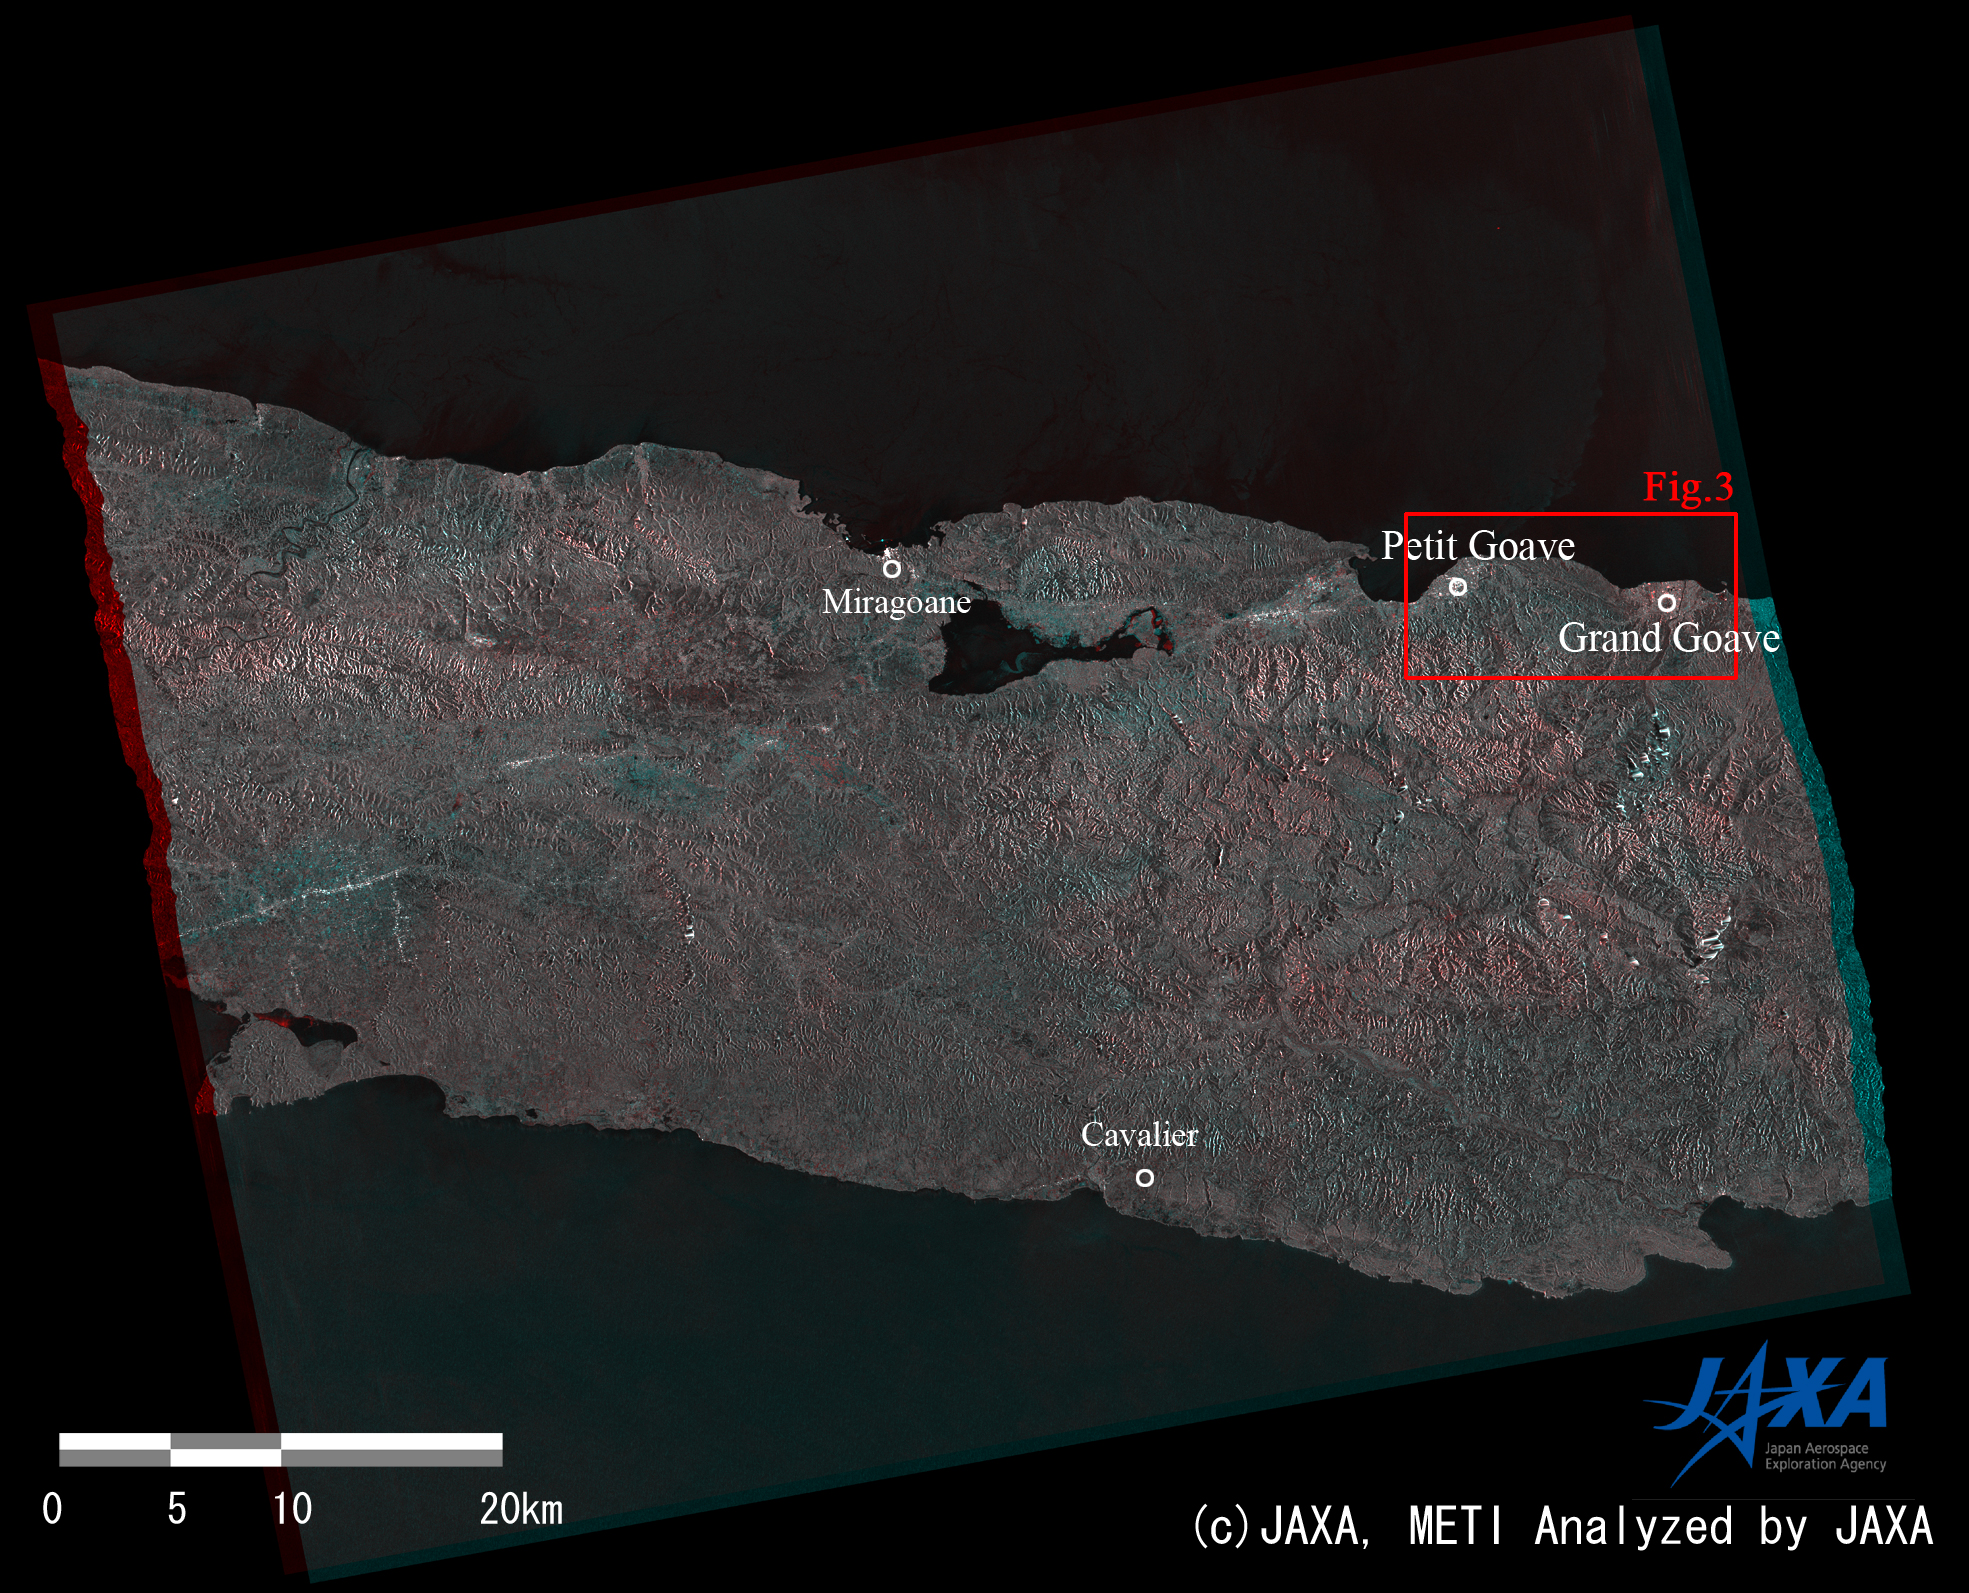
Fig. 2: A color composite image generated from PALSAR amplitude images acquired before (red: 2009/2/28) and after (green & blue: 2010/1/16) the earthquake
(Click to view enlarged image)
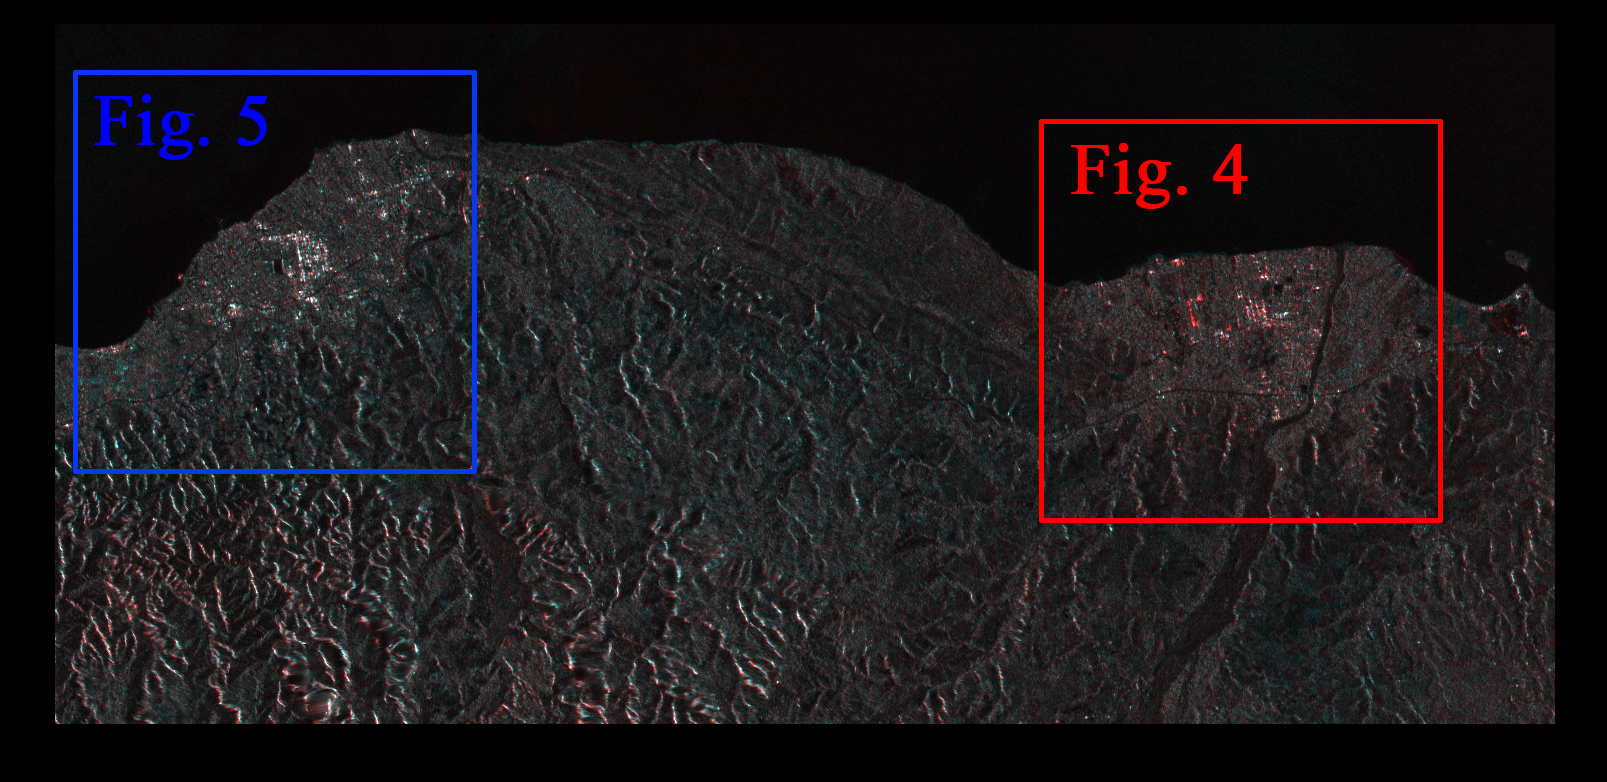
Fig. 3: An enlarged color composite image enclosed by a red rectangle in Figure 2. Petit Goave (left) and Grand Goave (right) are located in blue and red rectangles
(Click to view enlarged image)
If the radar backscattering weakens after the earthquake, the red-colored image acquired before the earthquake are enhanced in the composite image. Therefore, reddish parts of an inhabited area may correspond to collapses of buildings. In Figure 7, obvious fringes are found in same area. This means that surface deformation occurred in this area.
There are many reddish dots in the color composite image (right). This suggests that several buildings collapsed in Grand Goave.
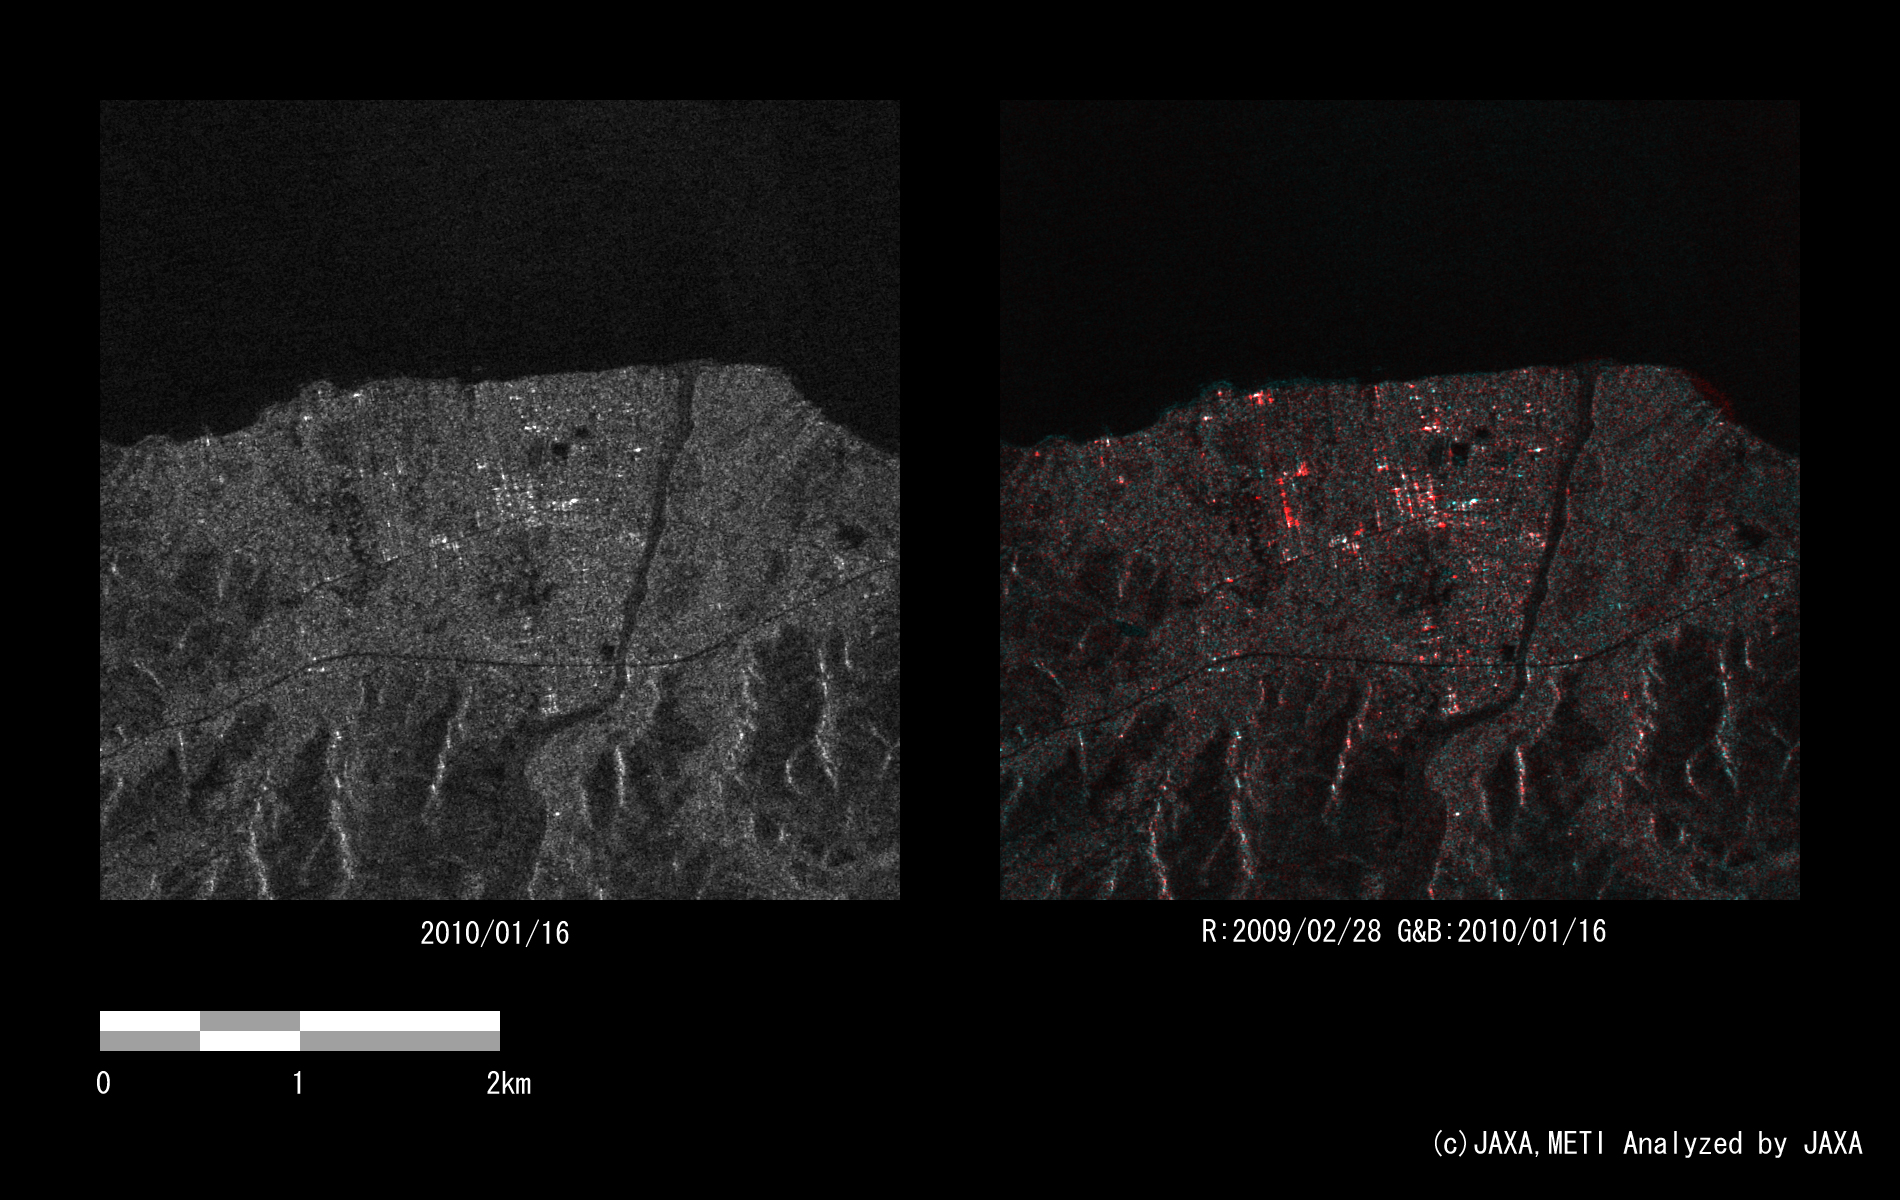
Fig. 4: An enlarged amplitude image around Grand Goave (left) and a color composite image (right) enclosed by the red rectangle in Figure 3
(Click to view enlarged image)
There are fewer reddish dots in the color composite image (right) than in Figure 4 (right) above. This suggests that the damage in Petit Goave was less than that of Grand Goave.
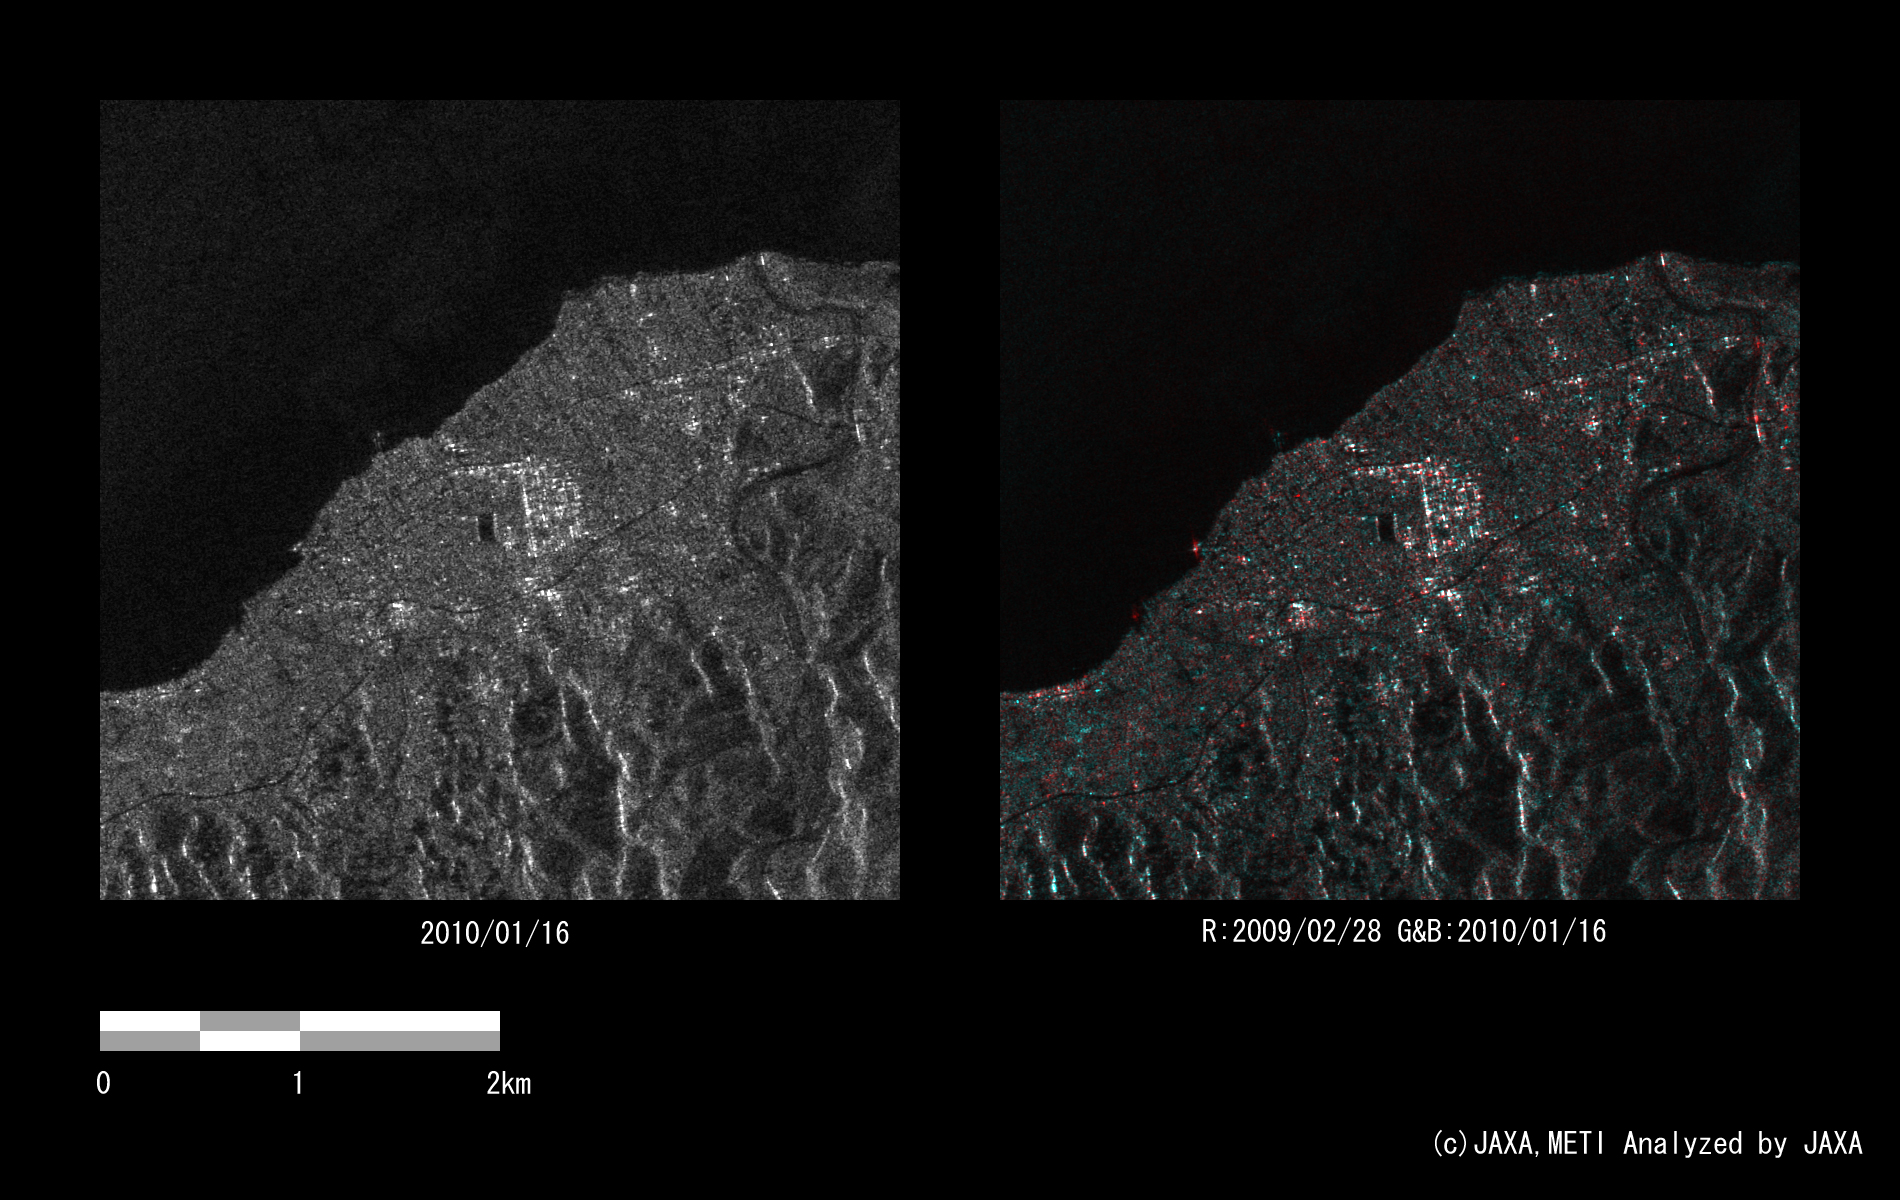
Fig. 5: An enlarged amplitude image around Petit Goave (left) and a color composite image (right) enclosed by the blue rectangle in Figure 3
(Click to view enlarged image)
2. Detection of Crustal Deformation
Figure 6 left is an interferogram generated from PALSAR data acquired before and after the earthquake using the DInSAR technique. A color pattern illustrates changes of satellite-ground distance for the period. Figure 6 right is a PALSAR amplitude image acquired after the earthquake indicating an observation field of 150km from south to north.
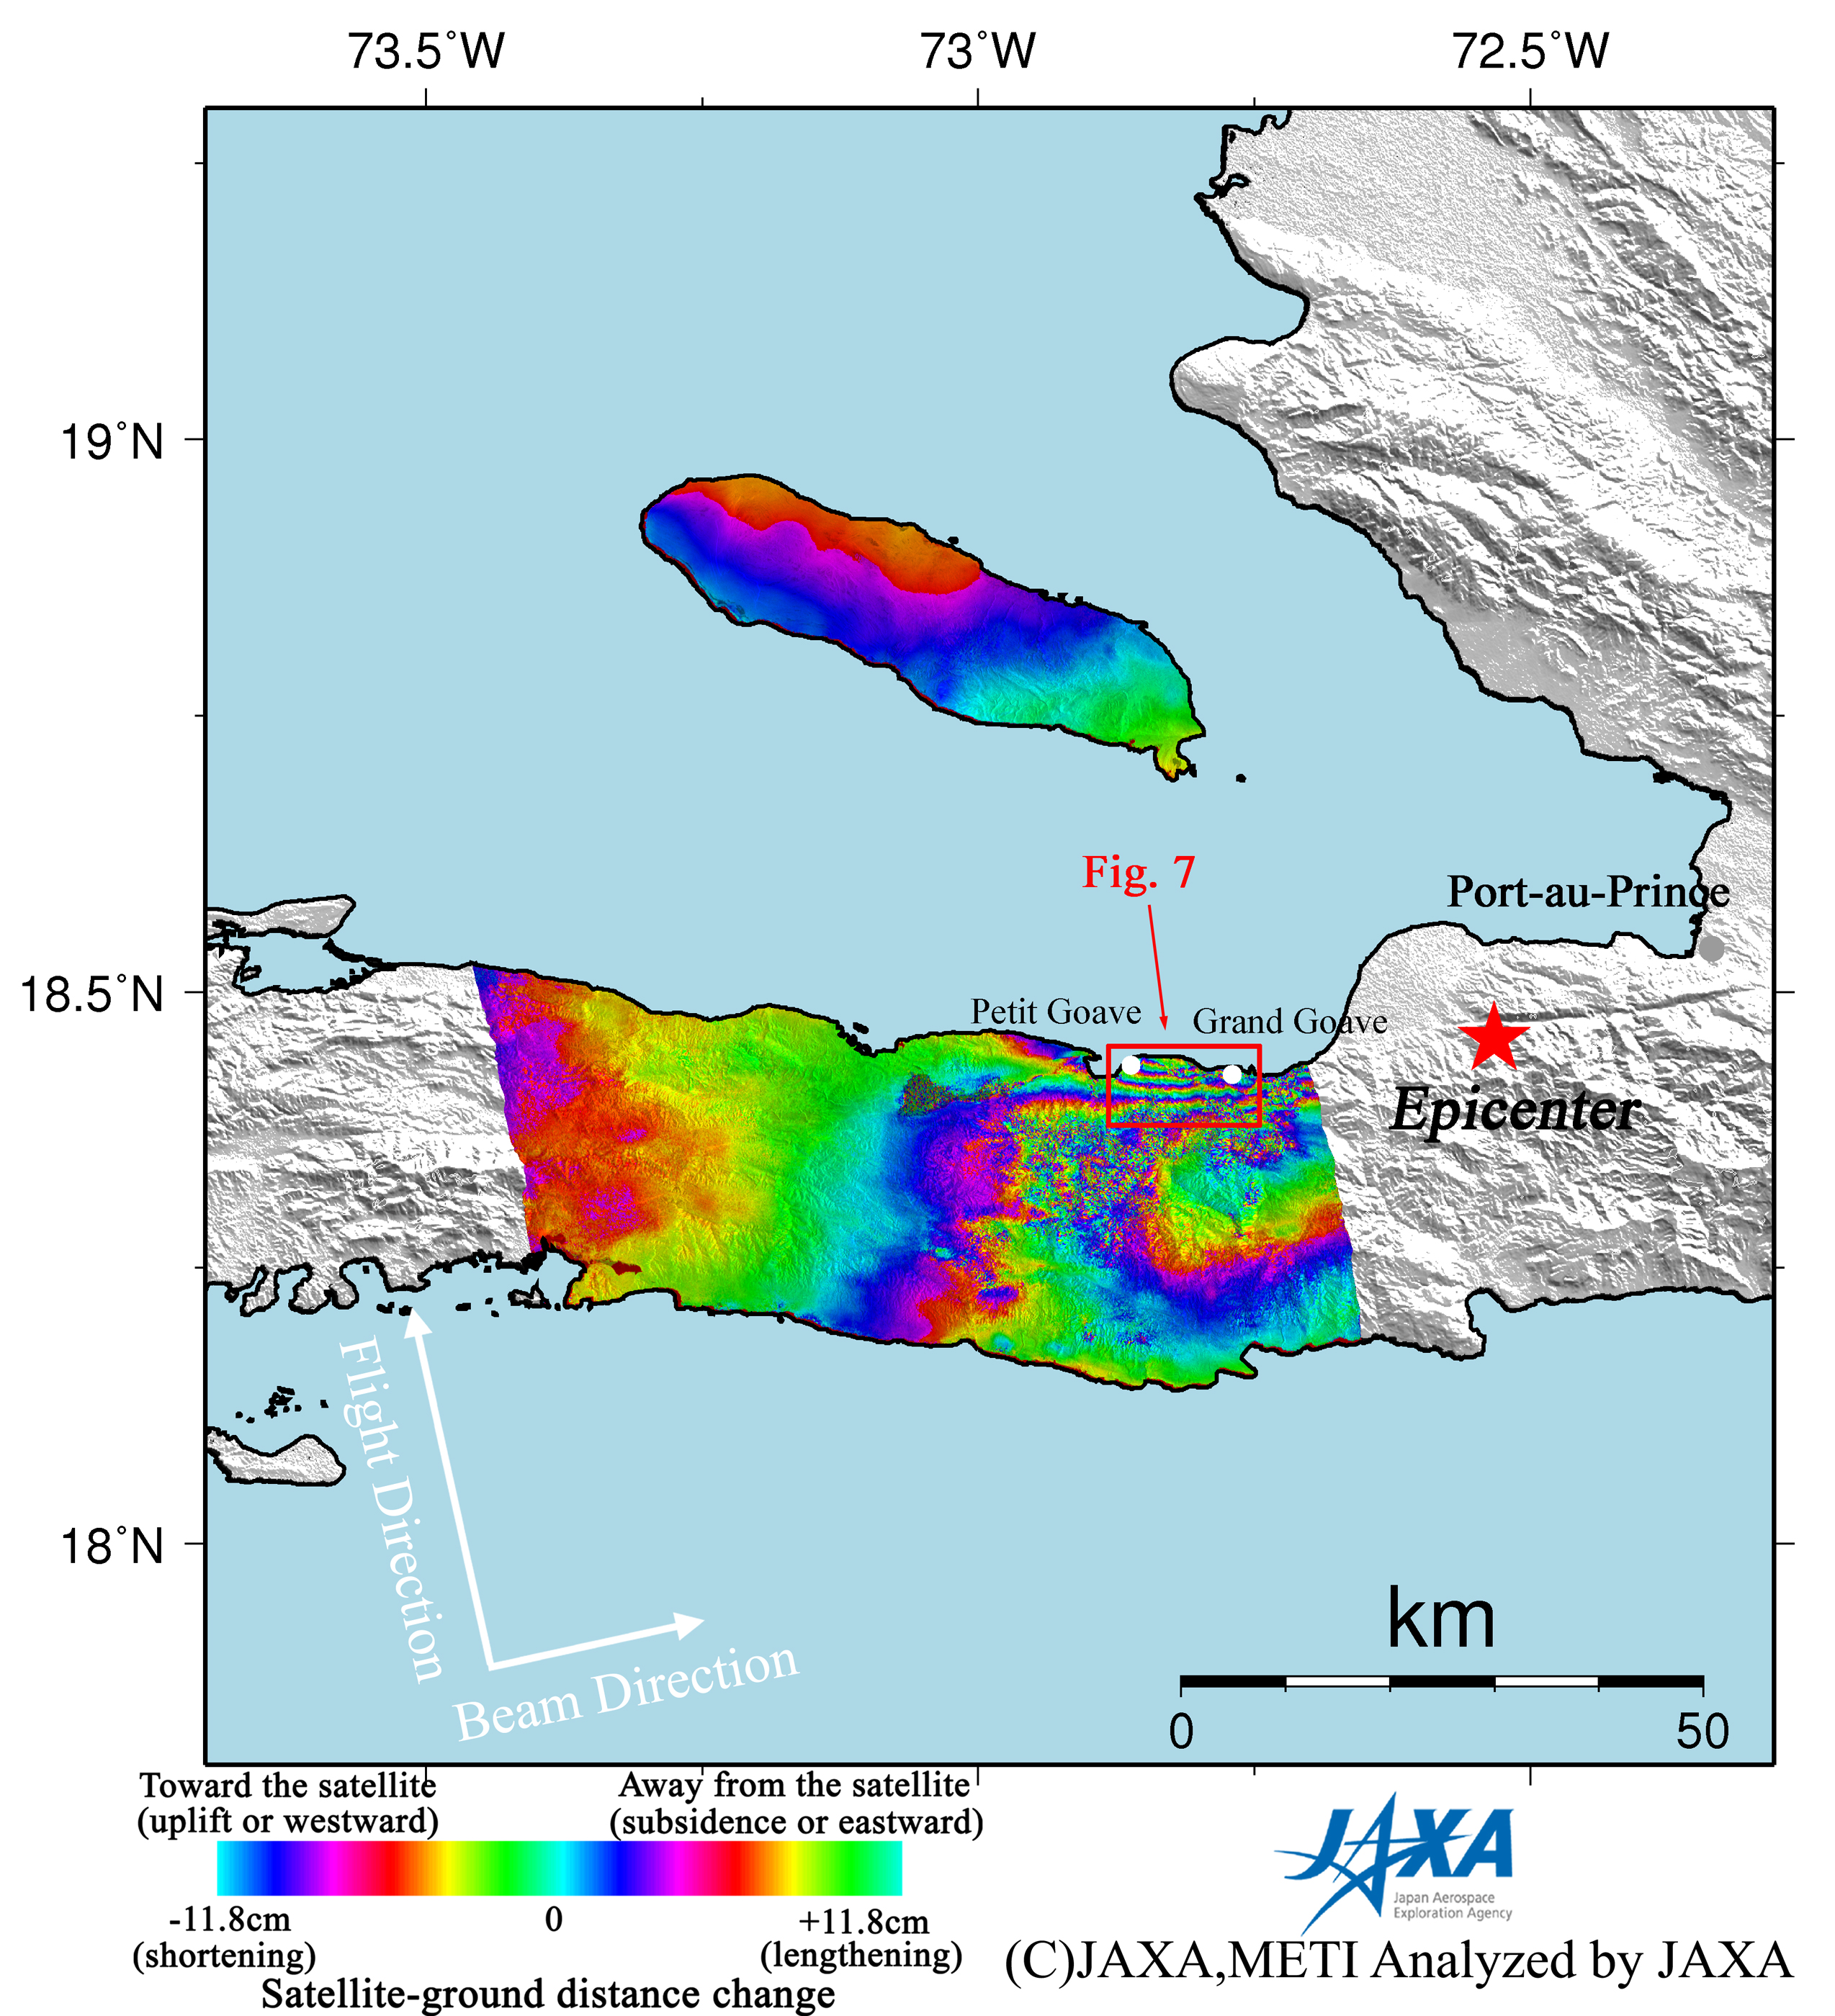
Fig. 6: PALSAR interferogram
(Click to view enlarged image)
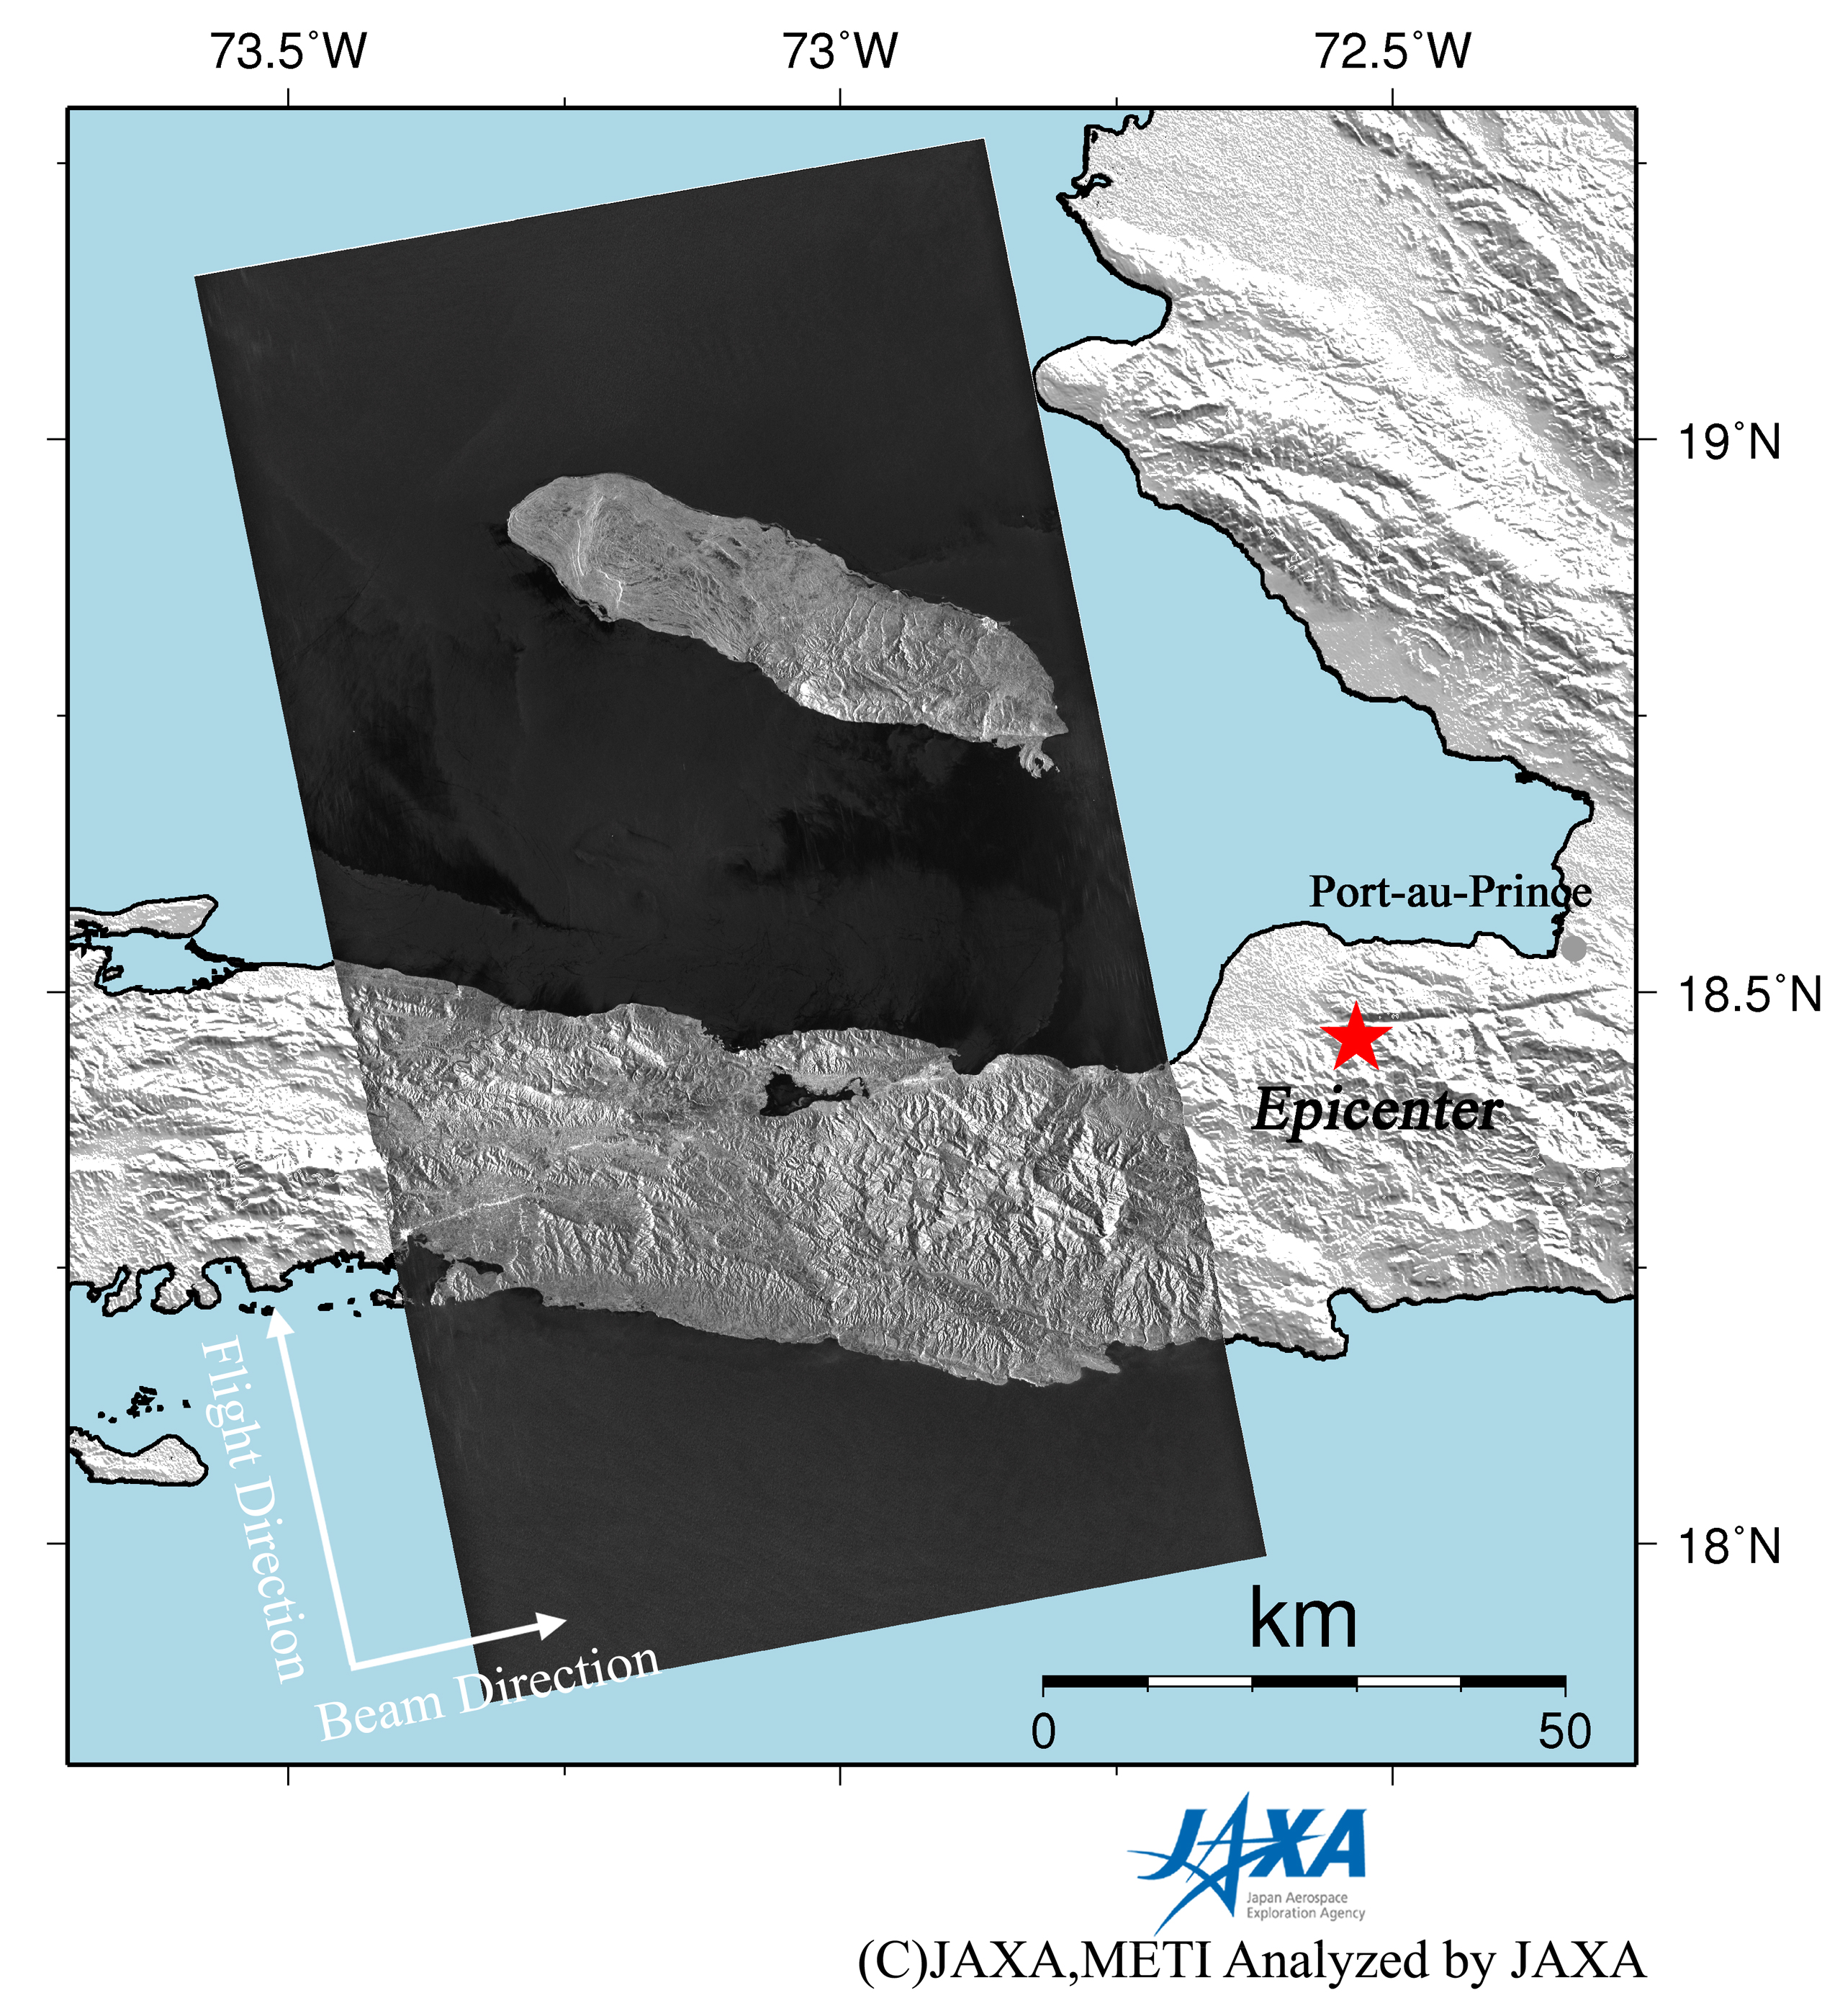
Fig. 6: PALSAR amplitude image
(Click to view enlarged image)
In the interferogram of Figure 6 (left) and Figure 7, there are several color fringes along the northern coast about 20 km west of the epicenter. It is interpreted that relative displacements at the coastal area (around the tip of the white arrow in Figure 7) are at least 35.4 cm. A mechanism of this earthquake is mainly the domination of a left-lateral strike-slip, which means that westward horizontal displacement caused by seismic faulting occurred in this region. Moreover, we can see the opposite pattern in the southern area of Figure 6 (left).
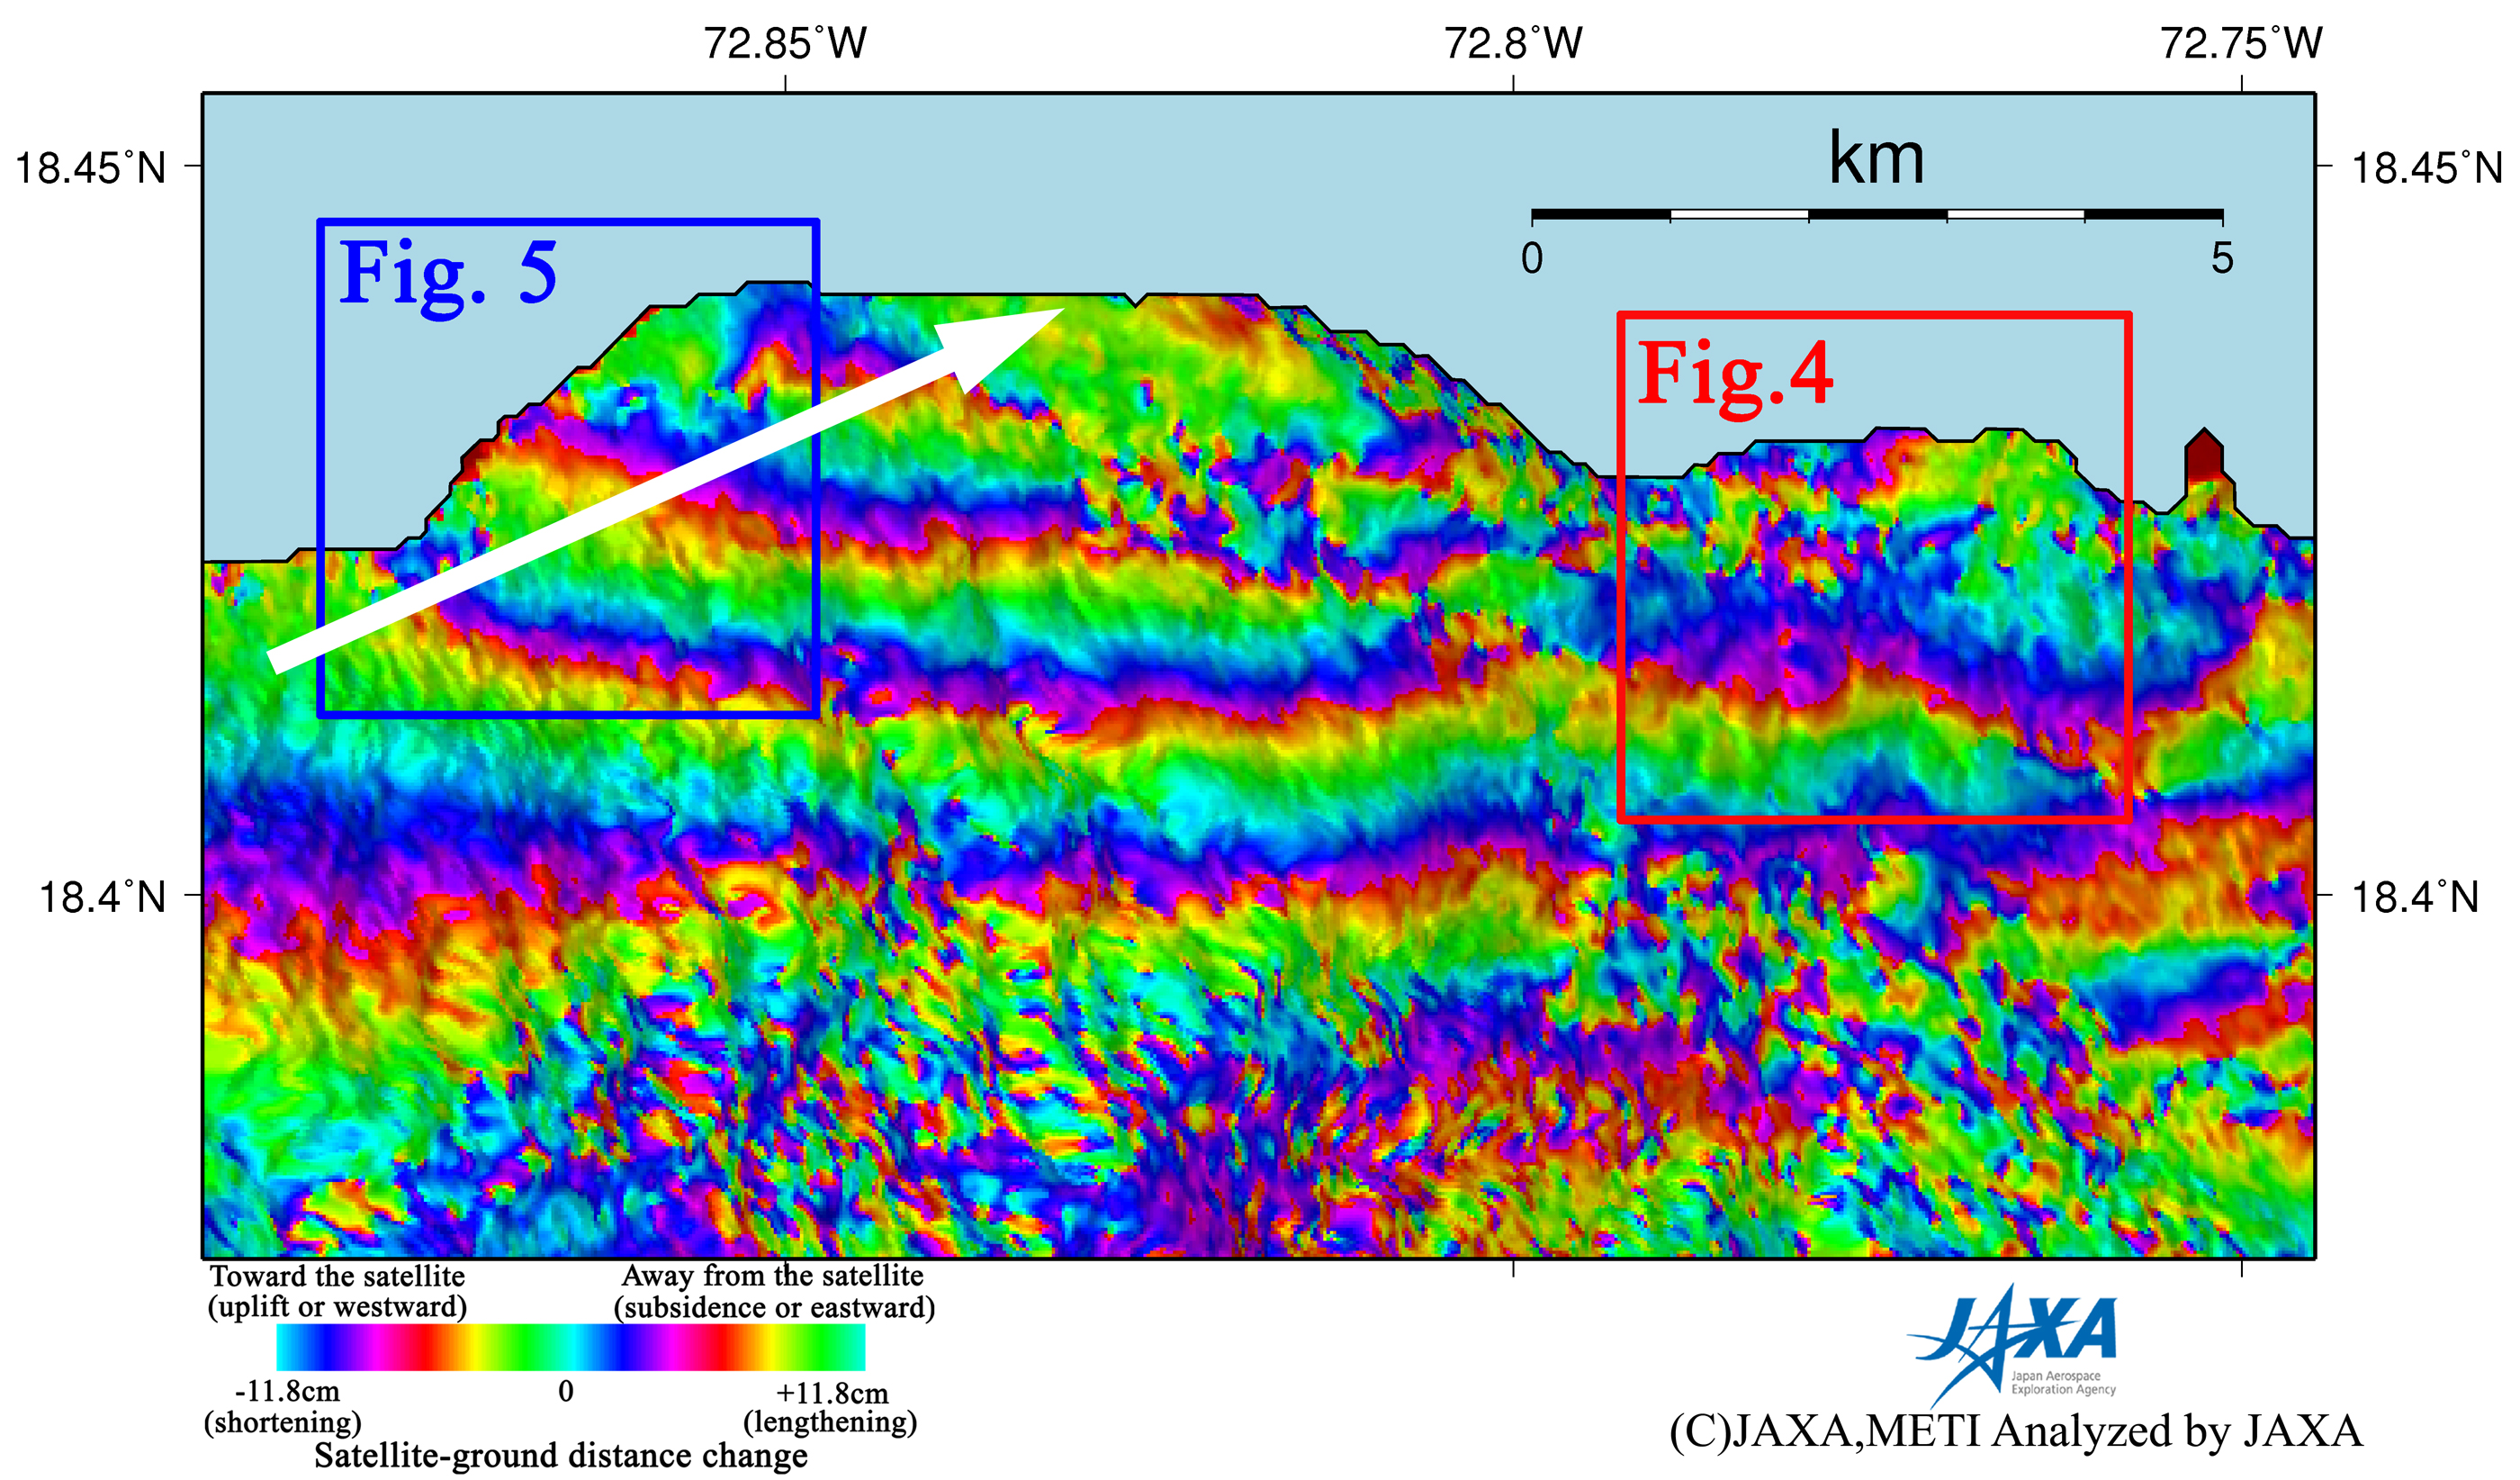
Fig. 7. An enlarged interferogram (Figure 6 left) in the same region as Figure 3
(Click to view enlarged image)
* The color changes from green, yellow, red, blue, and back to green indicate a shortening of the satellite-ground distance, and one color cycle = 11.8 cm.
JAXA plans to continue ALOS observations of the afflicted area in Haiti.