Image Library
ALOS-2/PALSAR-2 observation results on Hualien Earthquake, Taiwan
Posted: Feb. 16, 2018, 9:00 (UTC)
On February 6, 2018, a major earthquake of Mw 6.4 (USGS) occurred in Eastern Taiwan. Japan Aerospace Exploration Agency (JAXA) was requested from SAR working group in the coordinating committee for earthquake prediction, Japan and Sentinel Asia to perform emergency observations by the Phased Array type L-band Synthetic Aperture Radar-2 (PALSAR-2) aboard the Advanced Land Observing Satellite-2 (ALOS-2). Table 1 is a summary of acquired ALOS-2 data.
| Observed date(UTC) | Orbit number | Observation mode | Polarization | Observation direction | Beam number |
|---|---|---|---|---|---|
| Feb. 8, 2018 | 32 | Stripmap 3m | HH | Left | U2-7 |
| Feb. 10, 2018 | 136 | Stripmap 6m | HH+HV+VH+VV | Right | FP6-3 |
| Feb. 11, 2018 | 27 | Stripmap 10m | HH+HV | Right | F2-7 |
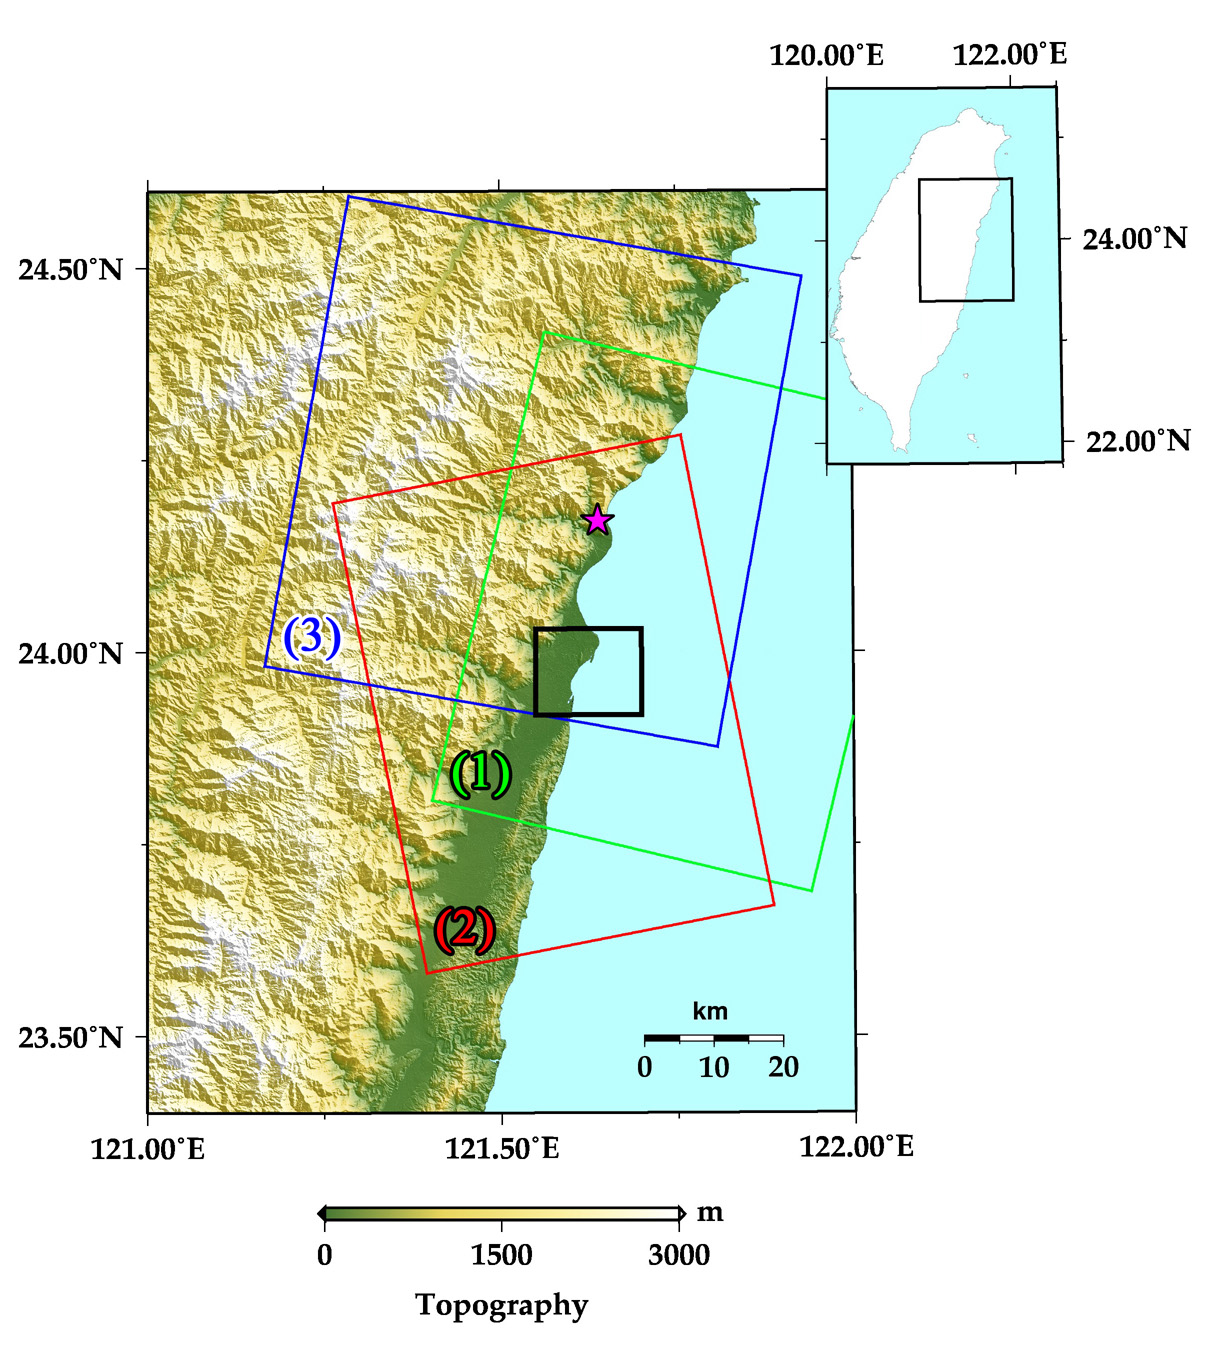
The yellow-green, red, and blue rectangles denote the observed areas of data (1), (2), and (3) in Table 1, respectively. The black rectangle denotes the analyzed area in Figure 2 and 3, around Hualien city. A star mark is the epicenter of the earthquake.
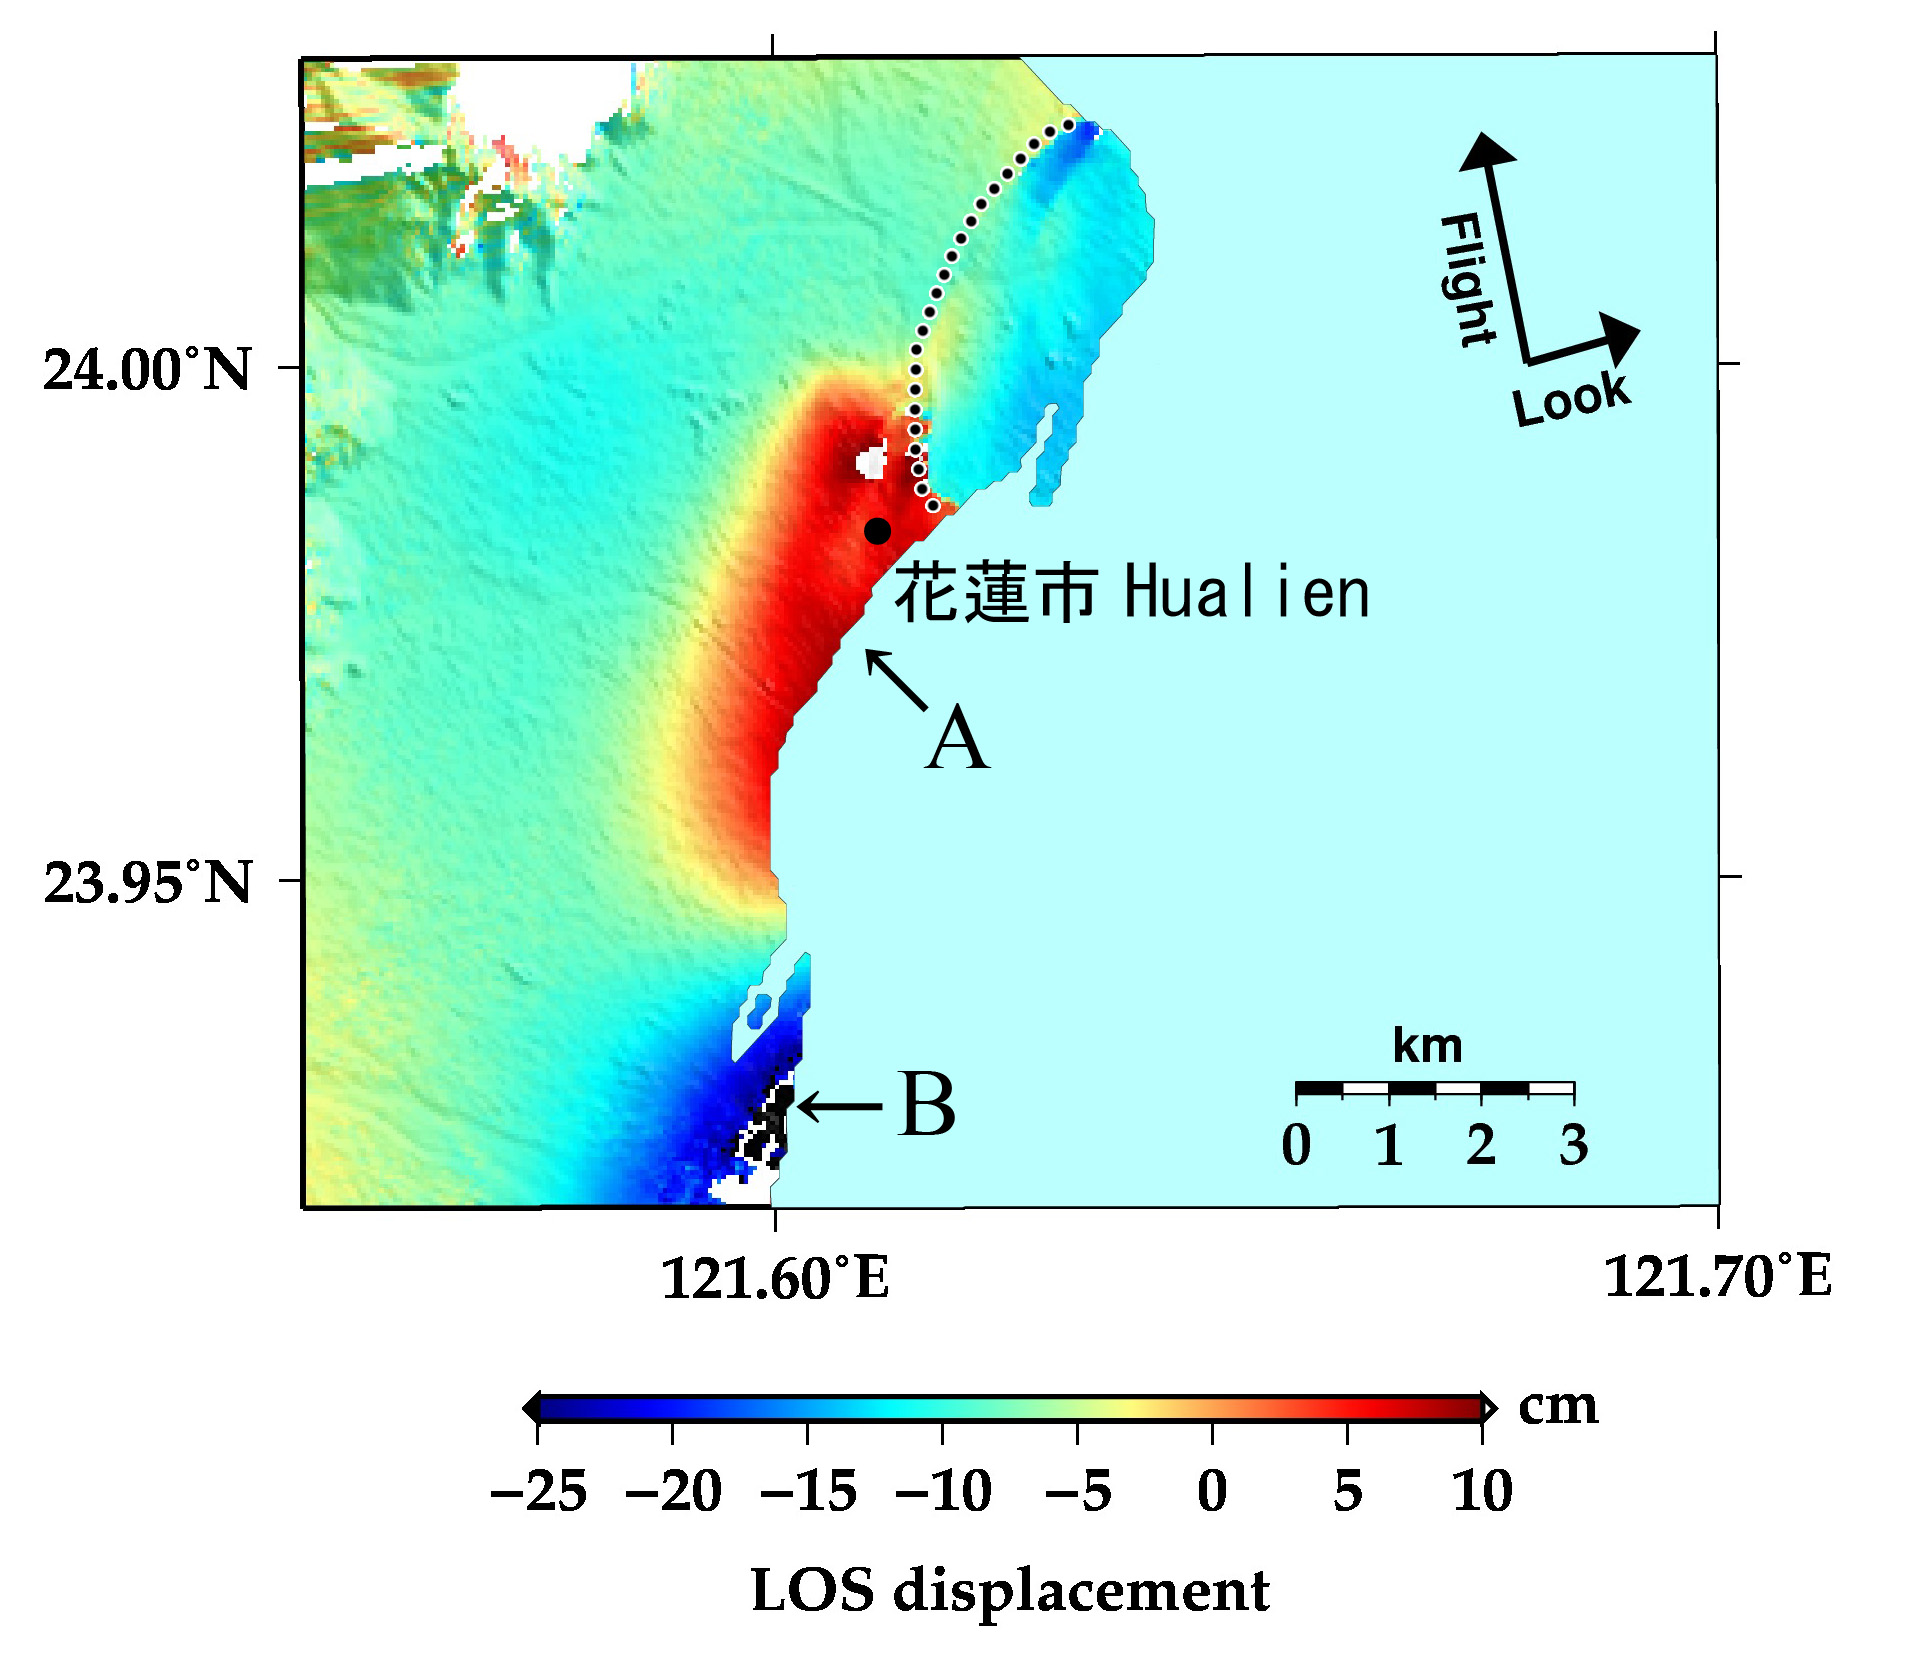
Figure 2 shows the interferogram using the ALOS-2 PALSAR-2 data acquired on November 5, 2016 and after February 10, 2018. This image shows ~10 cm displacement away from the satellite (subsidence or eastward movement) in area A, around Hualien city, which is 20 km away from the epicenter. There is also ~25 cm displacement toward the satellite (uplift or westward movement) detected in area B. Moreover, there is a discontinuity of surface displacement in upper part of Figure 2 (shown in a dotted line), which may correspond to surface fault along this line.
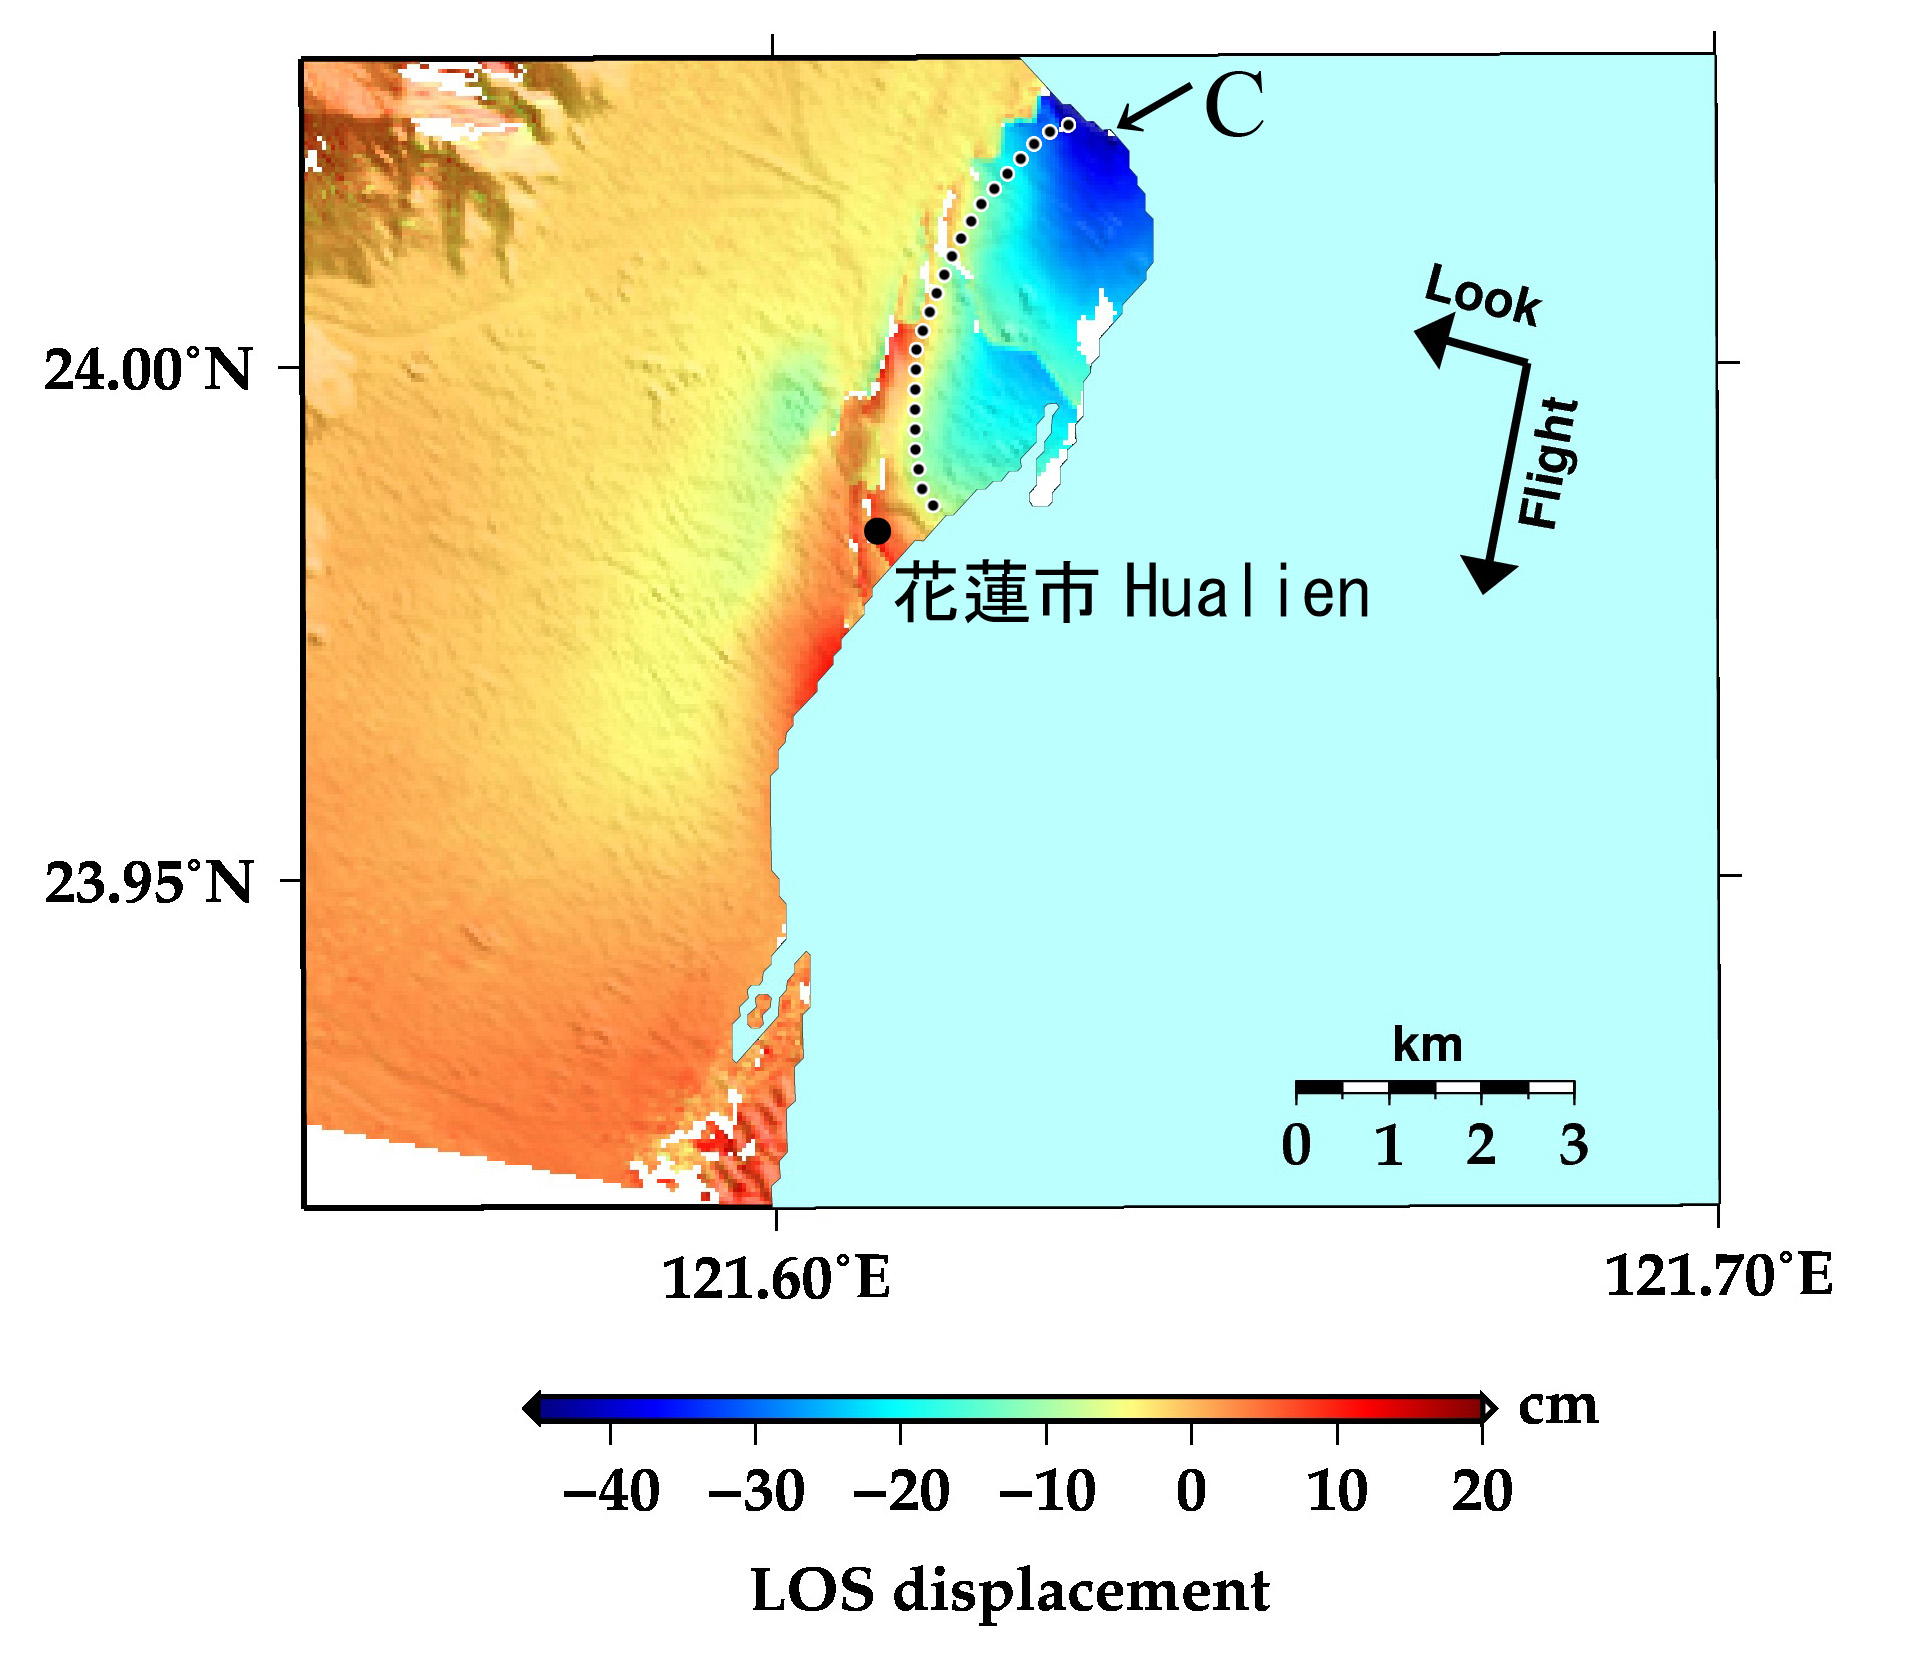
Figure 3 is another interferometric image using the ALOS-2 PALSAR-2 data obtained on June 18, 2016 and after February 11, 2018. This image shows ~ 40 cm displacement toward the satellite (uplift or eastward movement) in area C, and there is a discontinuity of displacement shown in a dotted line as well as that in Figure 2.
JAXA EORC


