Image Library

ALOS-2/PALSAR-2 Observation Results of Flooding on the Mississippi River

Corresponding to emergency requests from NASA and the International Charter of Space and Major Disasters for flooding of the Mississippi River, the Japan Aerospace Exploration Agency (JAXA) performed an emergency observation over the area shown in figure 1 by means of the Phased Array type L-band Synthetic Aperture Radar-2 (PALSAR-2) aboard the Advanced Land Observing Satellite-2 (ALOS-2, "DAICHI-2") on January 6, 2016.
Fig.1
Fig.1: Observation area of the PALSAR-2 on January 6, 2016 (Red box).
(Click to view enlarged image)

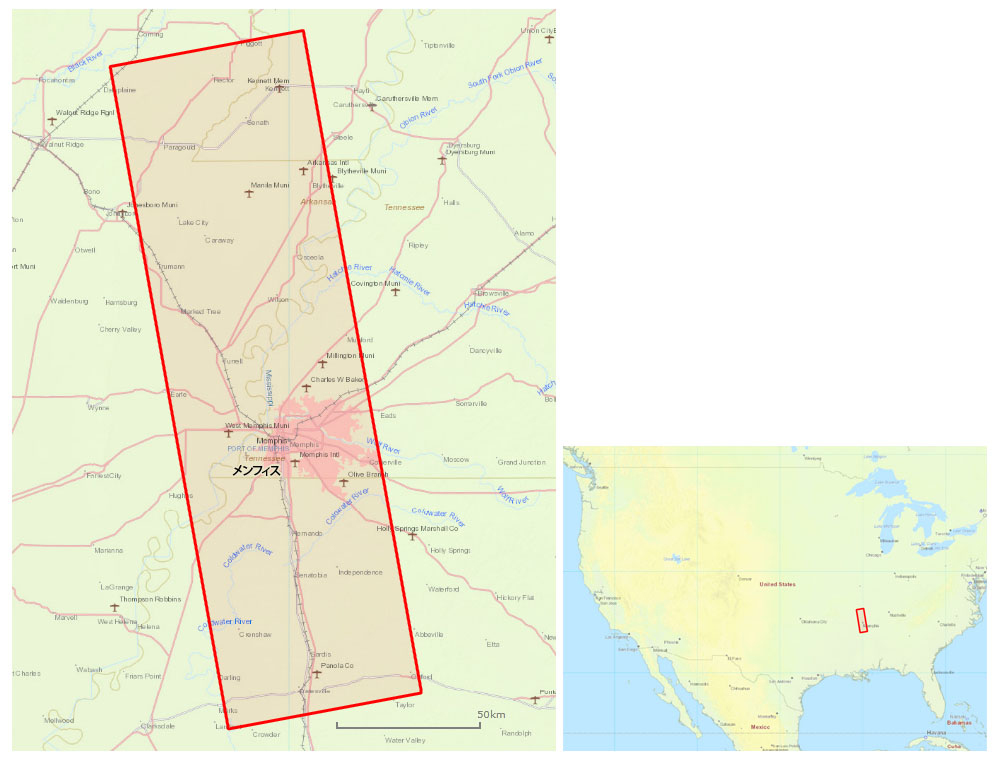
Figure 2 is an interactive comparison of the post-disaster image on Jan. 6, 2016 and a pre-disaster image on Sep. 30, 2015. Both images are acquired by high-resolution 10m mode.

Drag a slider over the image or click on the arbitrary position of the image to compare the images. Required browser: IE9 or later, Safari5.1 or later, Chrome, Firefox or Opera.
Fig.2: Interactive comparison of images before and after flooding (HH polarization)

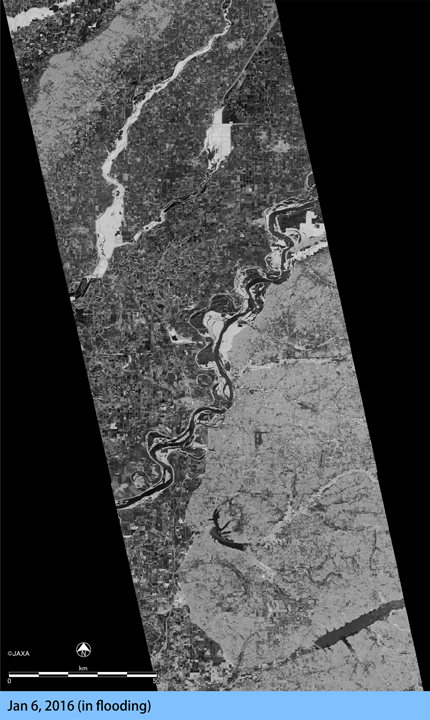
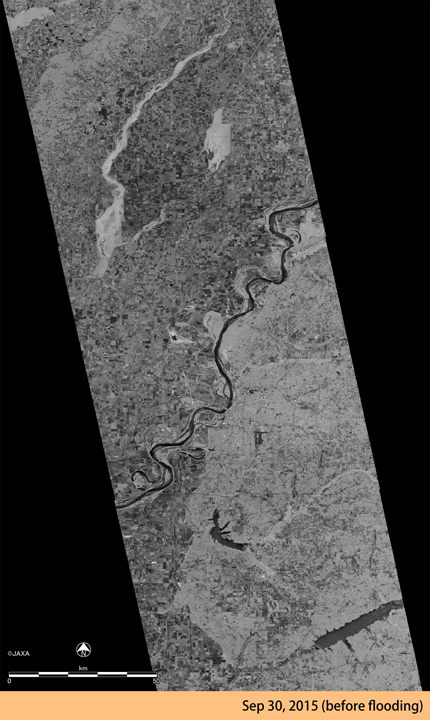
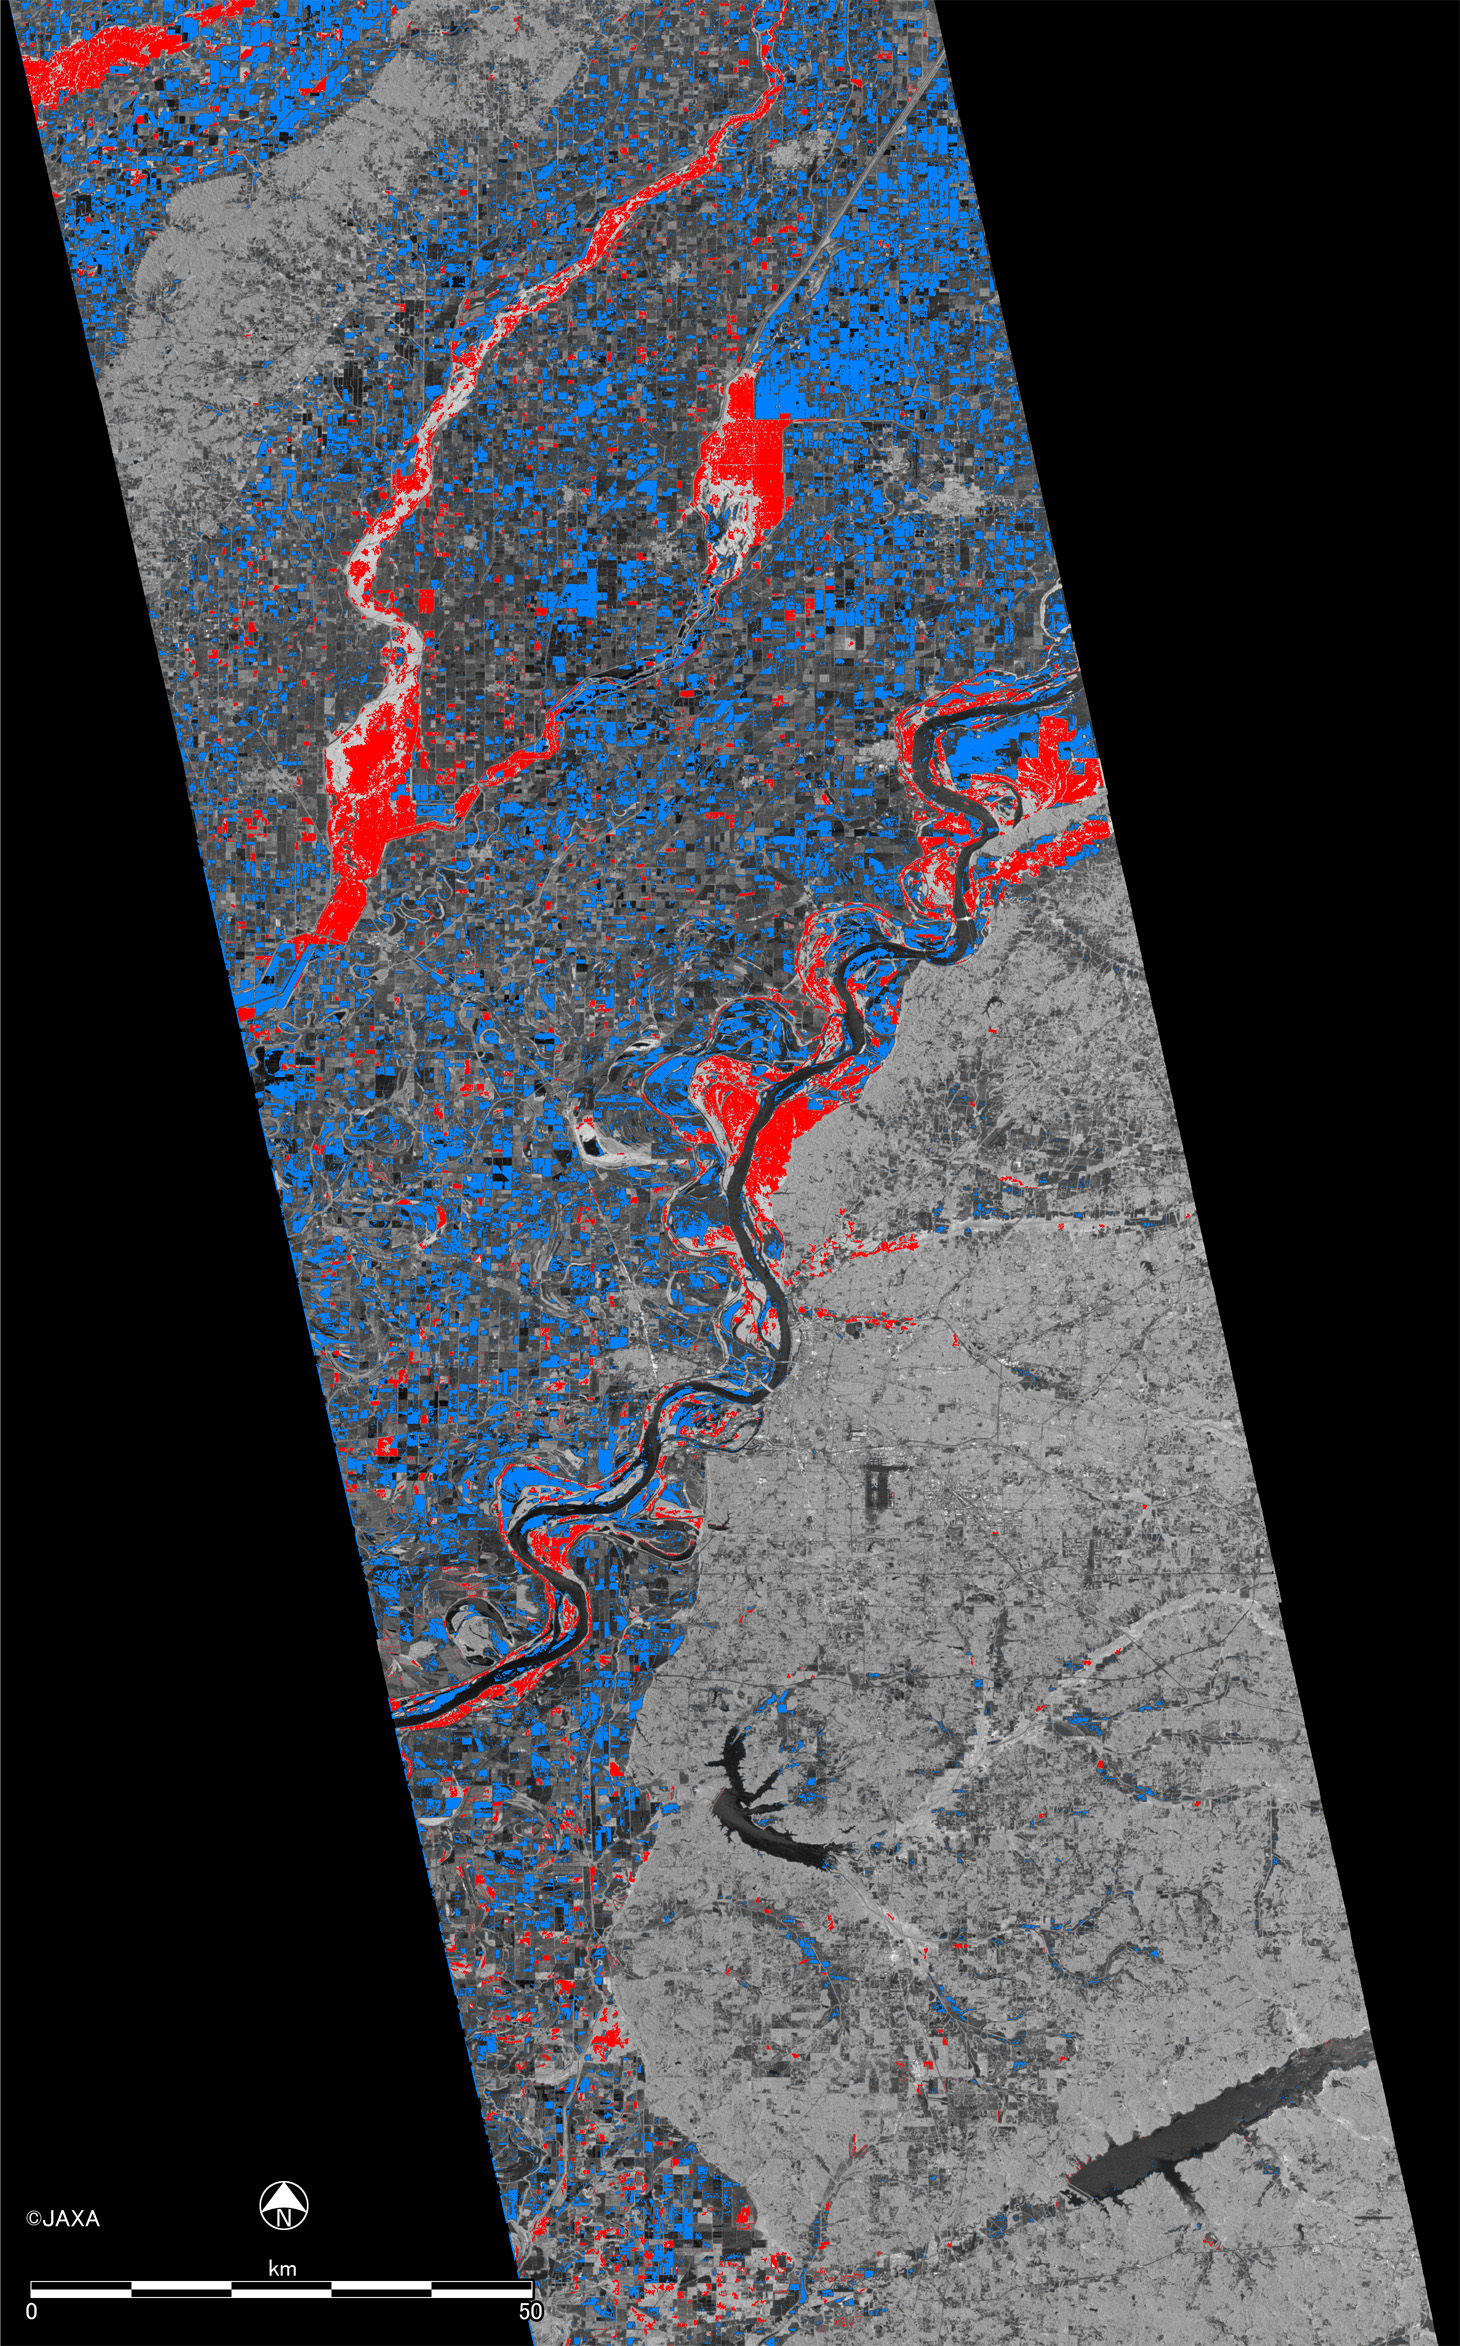
Figure 3 is the flood map obtained by change detection of the observation images. Blue area is considered to be covered with water but also contains normal seasonal change of agriculture fields. Red is inundation area under forests.

Fig.3
Fig.3: Estimated inundation map on Jan. 6, 2016
(Click to view enlarged image)

Update on Jan. 13, 2016

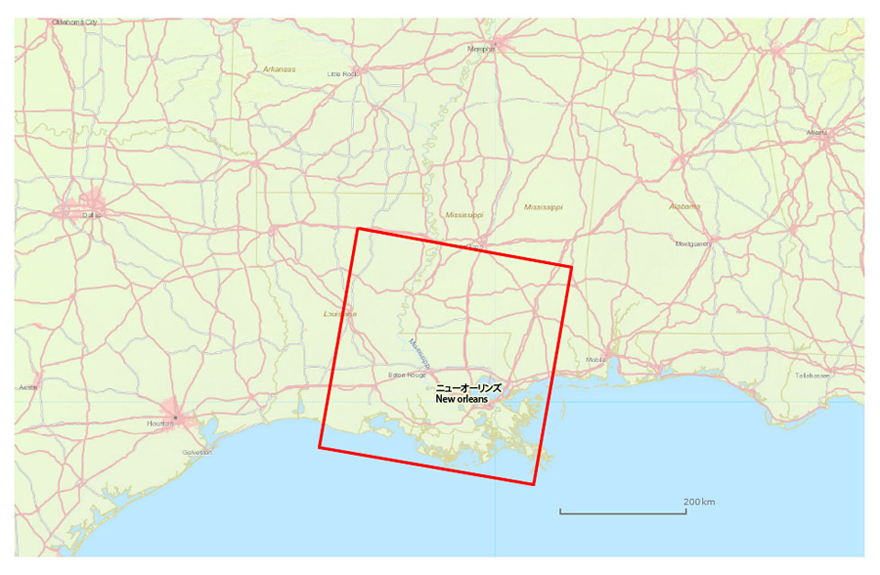
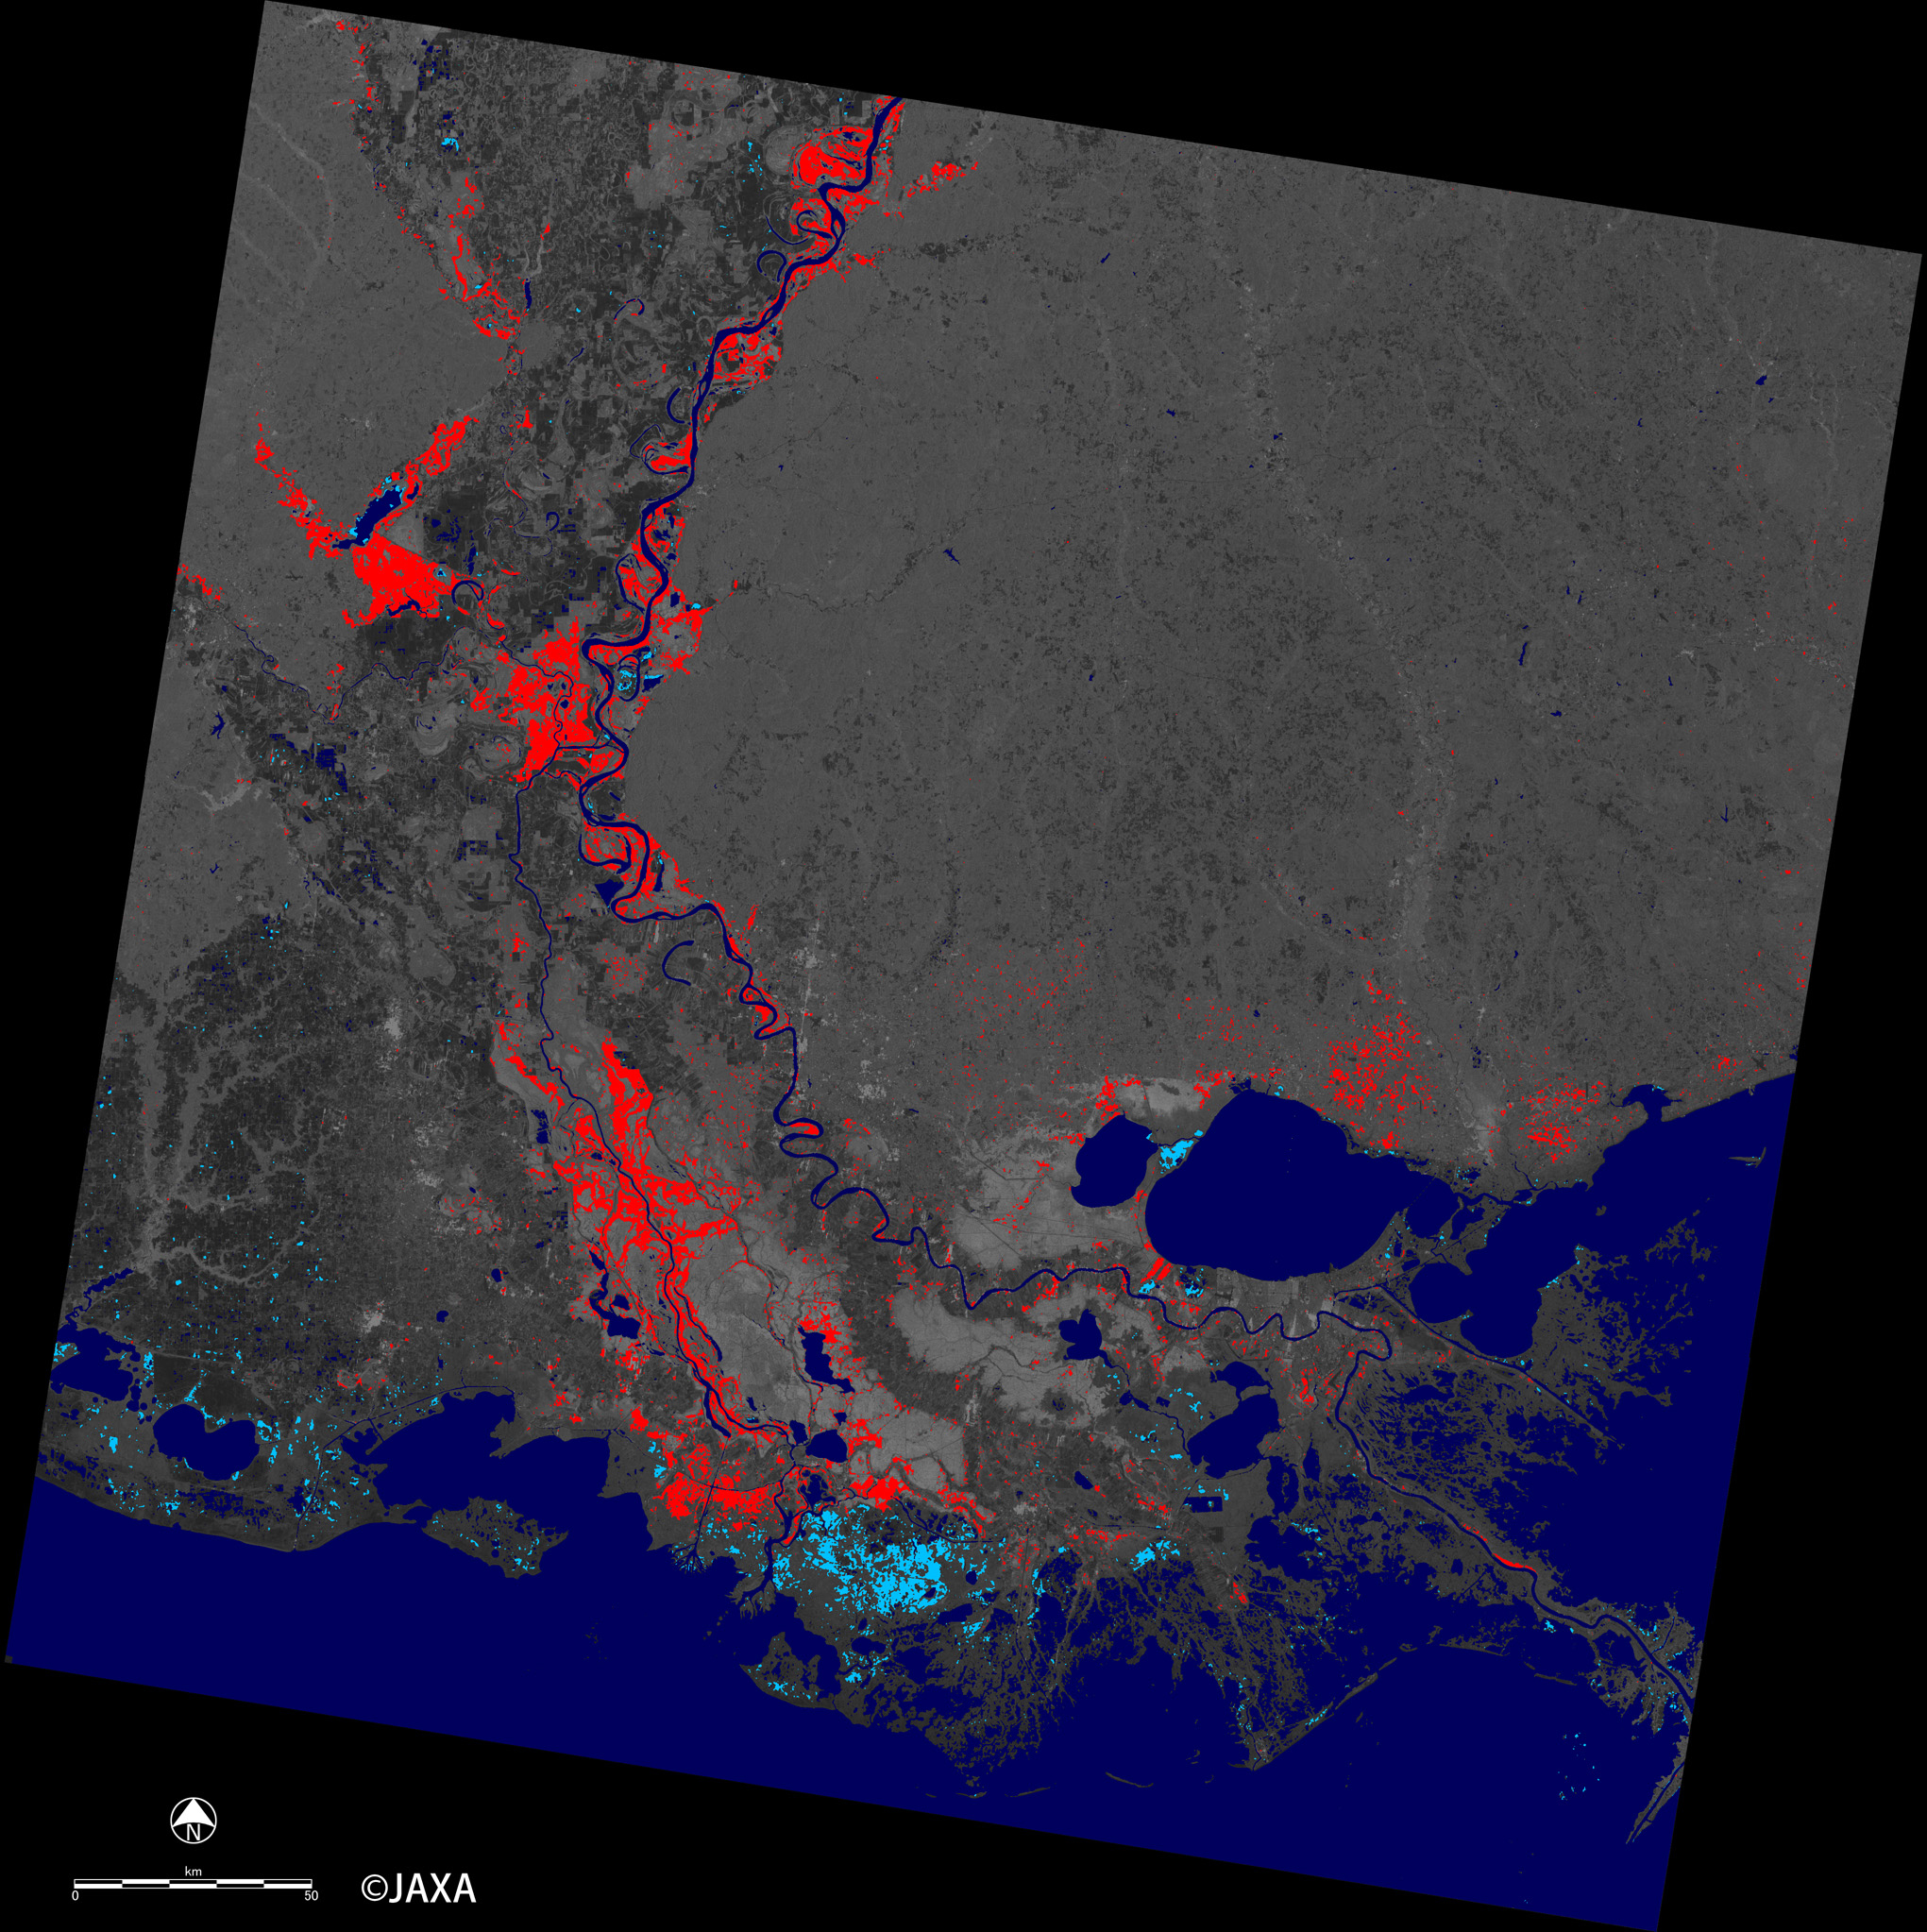
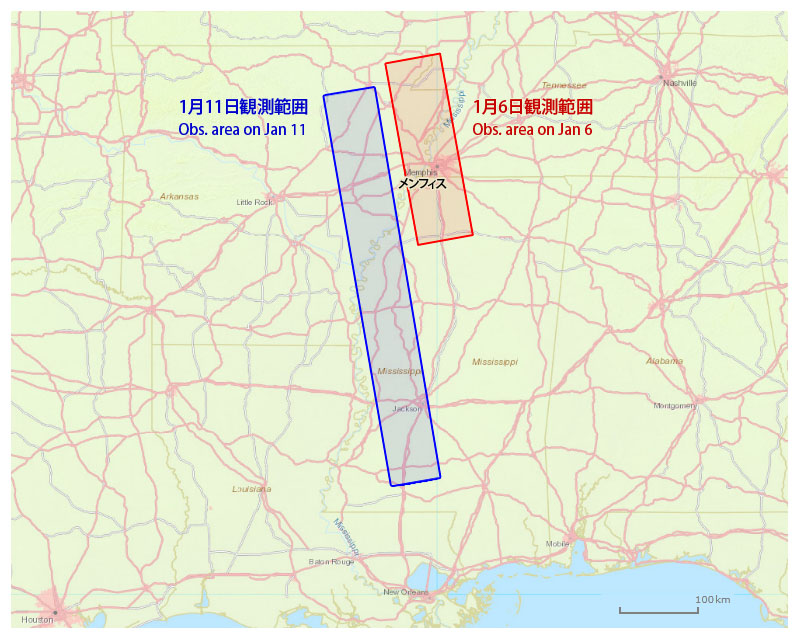
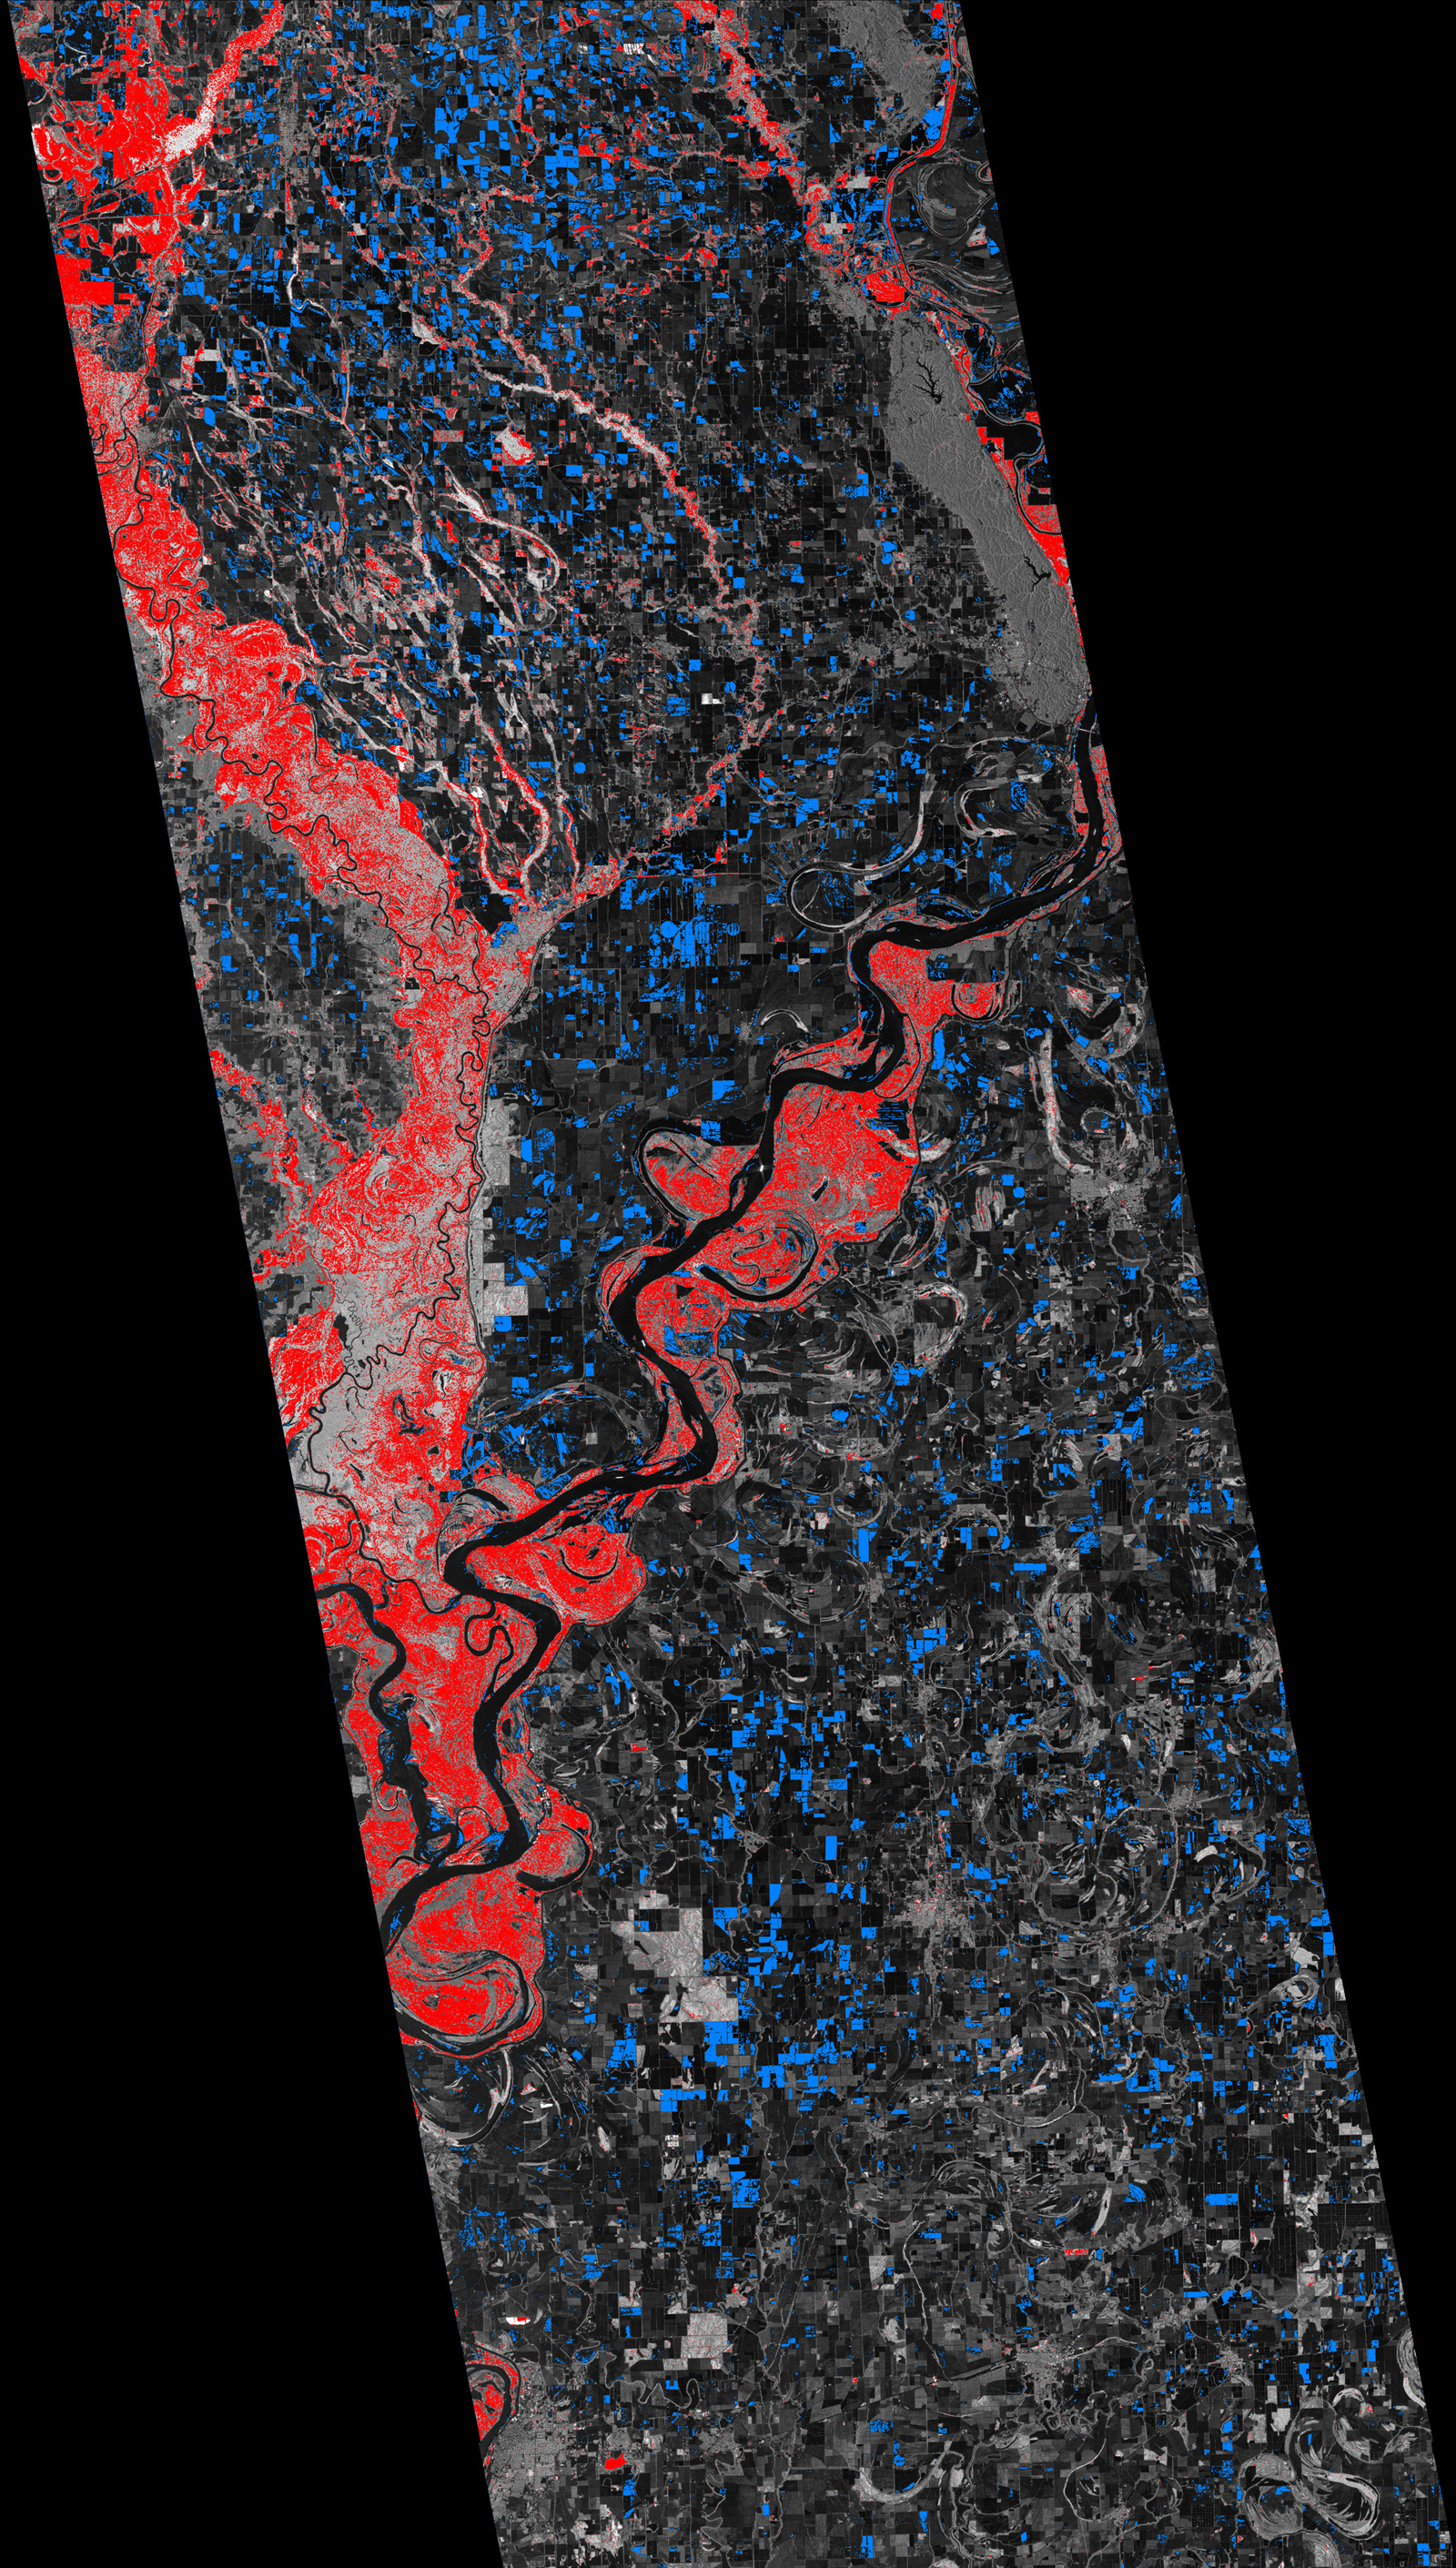
Corresponding on a request from the International Charter of Space and Major Disasters for flooding of the Mississippi River, JAXA observed the area shown in figure 4 by PALSAR-2 on Jan. 11, 2016. Figure 5 is the flood map obtained by the same process as figure 3.

Fig.4
(Click to view enlarged image)
Fig.4: Observation area of the PALSAR-2 on Jan. 6 (Red box) and Jan. 11 (Blue box), 2016.
Fig.5
Fig.5: Estimated inundation map on Jan. 11, 2016
(Click to view enlarged image)

Update on Jan. 21, 2016

JAXA observed the area shown in figure 6 by ScanSAR mode (swath width: 350km) of PALSAR-2 on Jan. 16, 2016. Figure 7 is the flood map obtained by the same process as figure 3.

Fig.6
Fig.6: Observation area of the PALSAR-2 on Jan. 16, 2016 (Red box).
Fig.7
Fig.7: Estimated inundation map on Jan. 16, 2016
(Click to view enlarged image)
JAXA EORC