Image Library
ALOS-2 PALSAR-2 Observation Results on the earthquakes in central Italy in 2016
Updated: September 1, 2016, 8:00 (UTC)
Updated: November 4, 2016, 8:00 (UTC)
Updated: November 11, 2016, 9:00 (UTC)
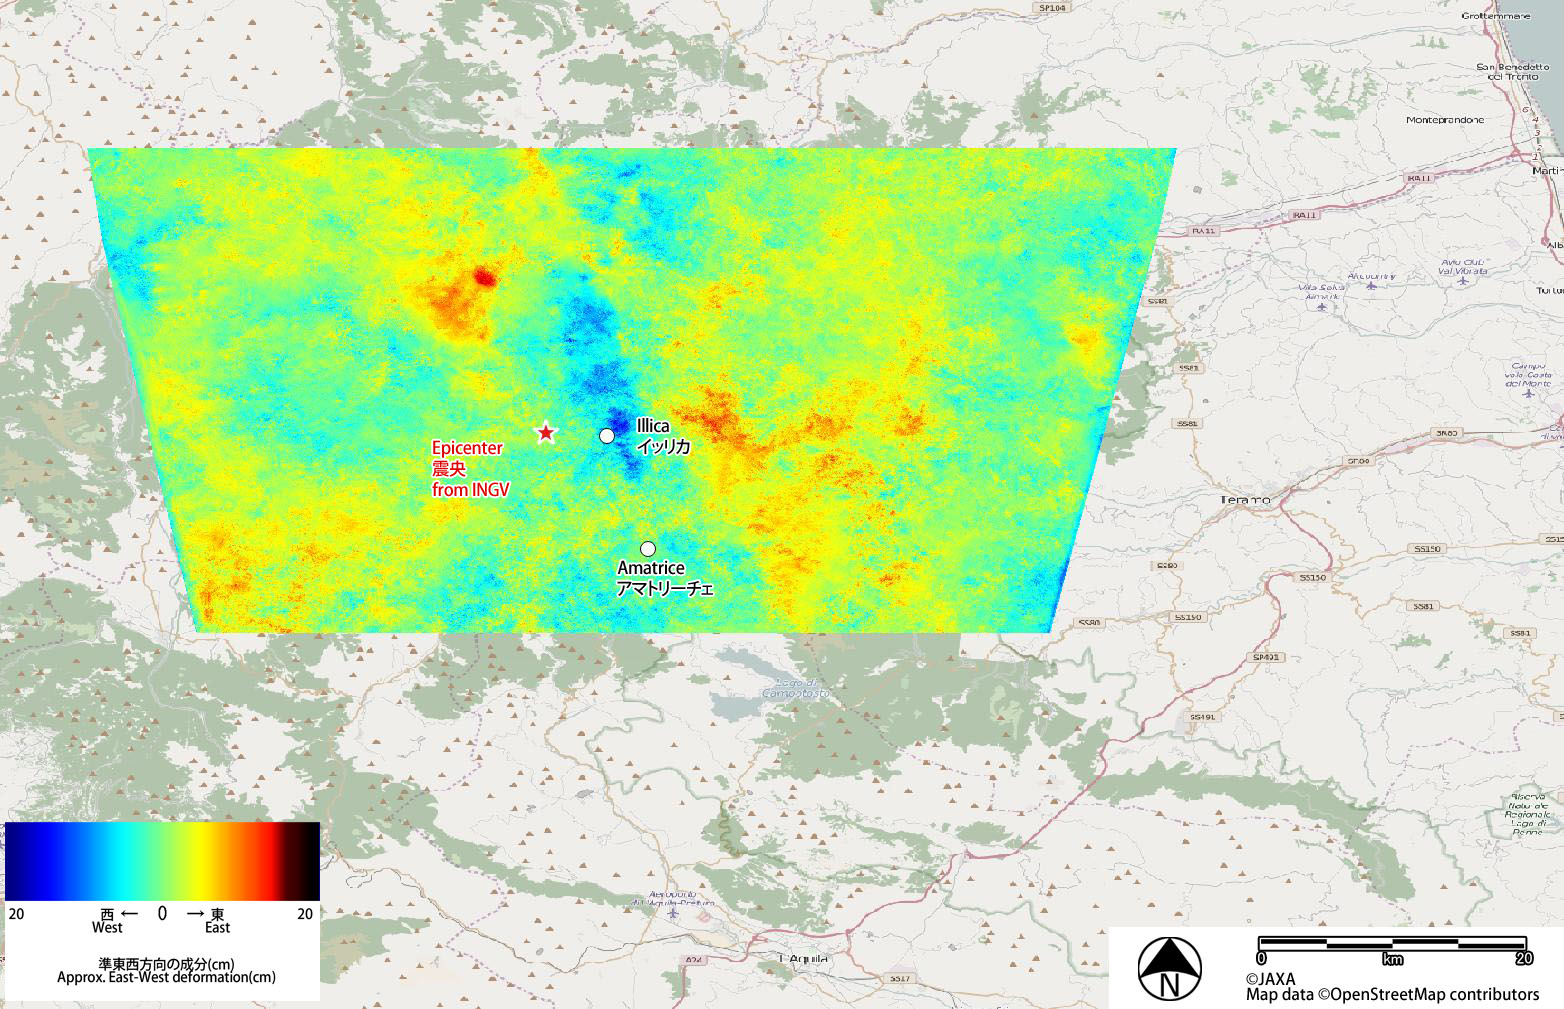
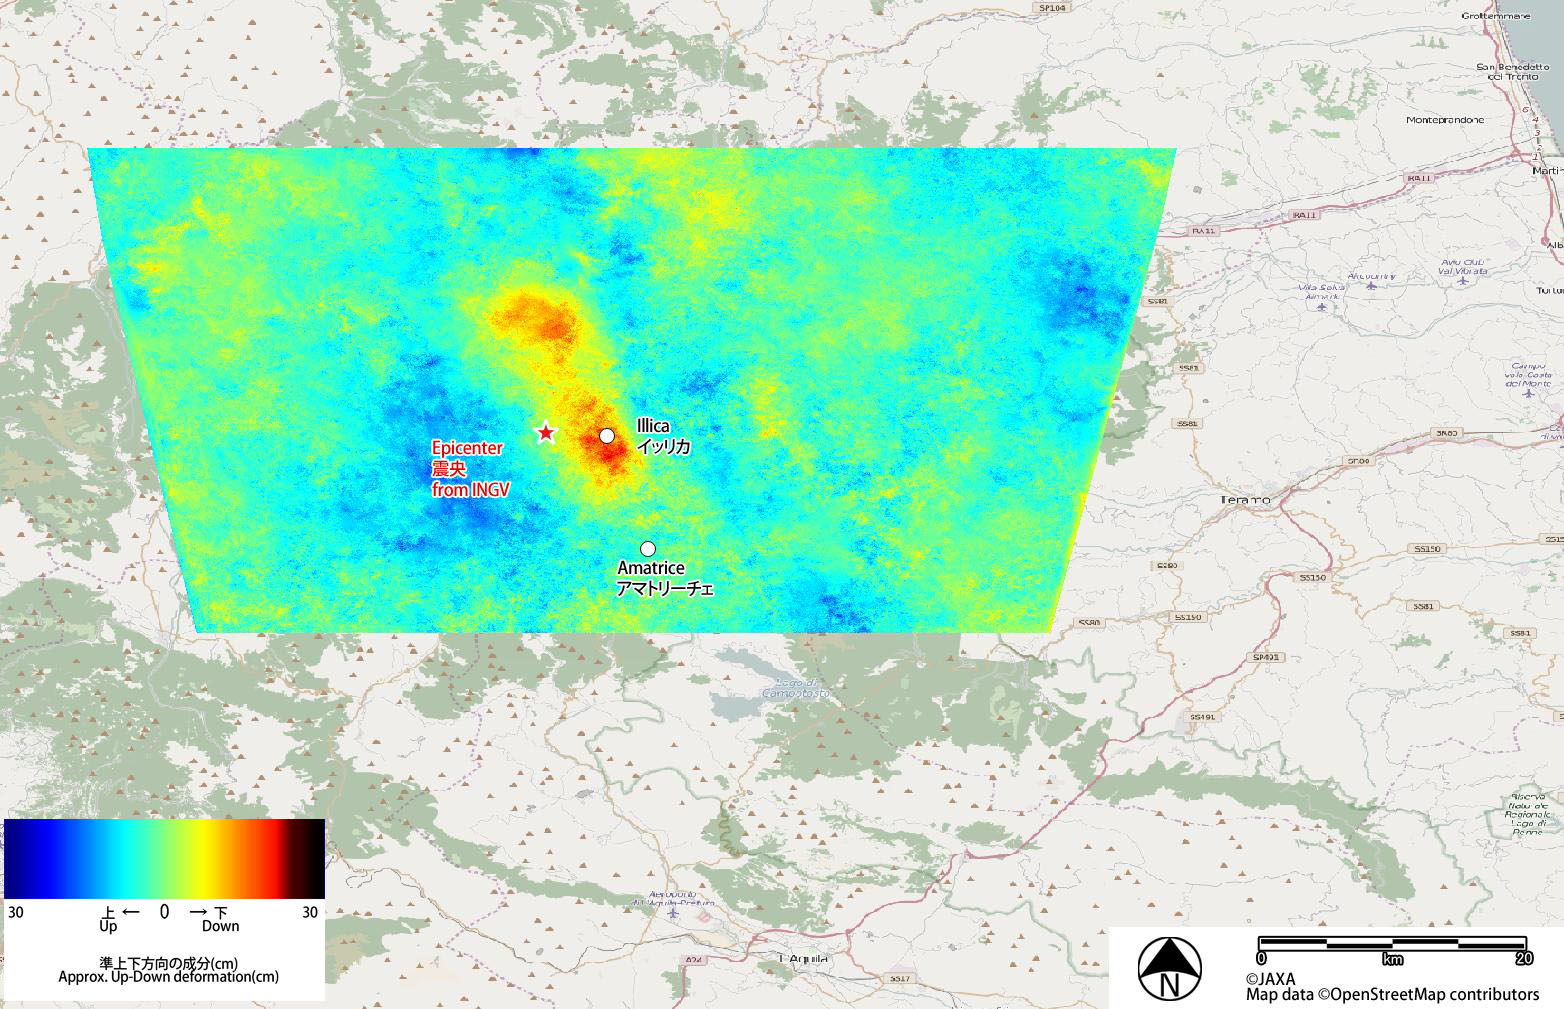
On August 24, 2016 at 23:00 (UTC), an emergency observation with the Phased Array-type L-band Synthetic Aperture Radar-2 (PALSAR-2) aboard the Advanced Land Observing Satellite-2 (ALOS-2, "DAICHI-2") was performed in response to the magnitude-6.2 earthquake in central Italy on August 24, 2016 at 1:36 (UTC). The second observation was performed on August 31, 2016 at 11:15 (UTC).
Another magnitude 6.1 and 6.6 earthquakes struck the same region on October 26 and 30, respectively. In response to these earthquakes, ALOS-2 performed observations on October 28, November 2 and 9.
Japan Aerospace Exploration Agency (JAXA) has provided the acquired data to corresponding authorities.
| Observation date(UTC) | Path No. | Observation mode | Polarization | Direction | Beam No. |
|---|---|---|---|---|---|
| 2016/08/24 | 197 | Stripmap 10 m | HH+HV | Right | F2-7 |
| 2016/08/31 | 92 | Stripmap 10 m | HH+HV | Right | F2-6 |
| 2016/10/28 | 198 | Stripmap 10 m | HH+HV | Right | F2-5 |
| 2016/11/2 | 197 | Stripmap 10 m | HH+HV | Right | F2-7 |
| 2016/11/9 | 92 | Stripmap 10 m | HH+HV | Right | F2-6 |
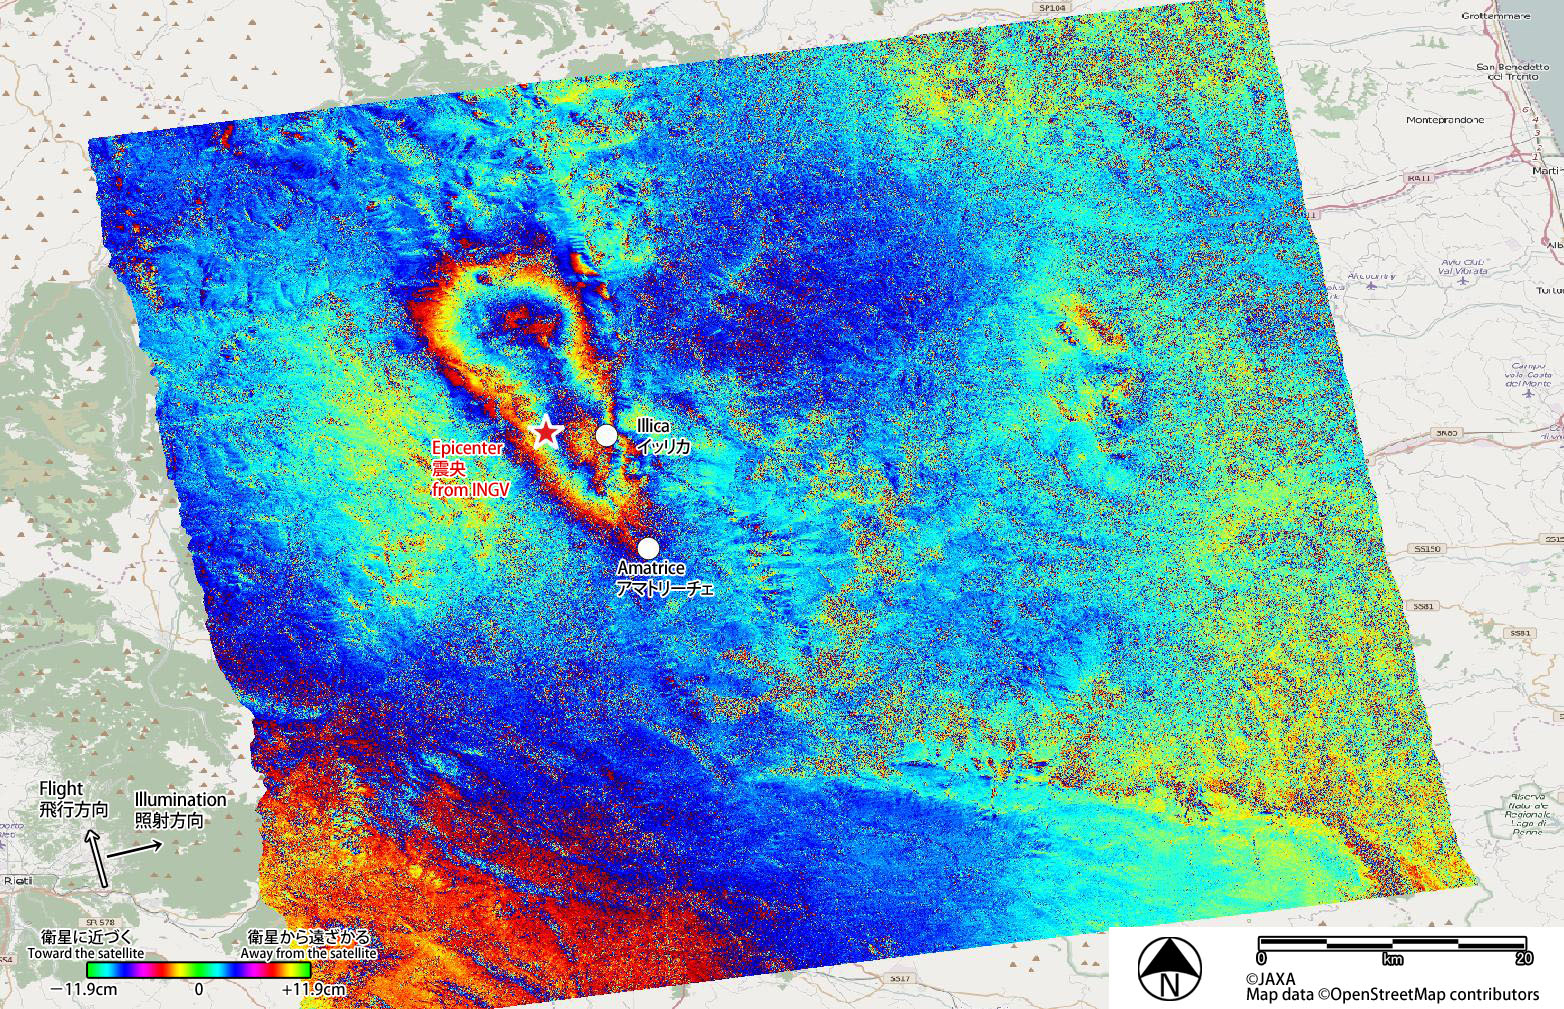
Fig. 2 shows a differential interferometry (DInSAR) result derived from the PALSAR-2 data acquired before (September 9, 2015; UTC) and after (August 24, 2016; UTC) the earthquake. Approximately 20 cm deformation away from the satellite (eastward and / or downward movement) is detected in the east region of the epicenter. The deformation area extends approx. 20 km from north to south and 10 km from west to east. The city of Amatrice places its south end.
Update on Sep. 1, 2016. Observation on Aug. 31, 2016.
Fig. 5 shows a differential interferometry (DInSAR) result derived from the PALSAR-2 data acquired before (May 25, 2016; UTC) and after (August 31, 2016; UTC) the earthquake. Approximately 25 cm deformation away from the satellite (westward and / or downward movement) is detected in the east region of the epicenter.
Update on Nov. 4, 2016. Observation on Oct. 28 and Nov. 2, 2016
Fig. 8 shows a DInSAR result derived from the PALSAR-2 data acquired before (February 5, 2016; UTC) and after (October 28, 2016; UTC) the earthquakes on August 24 and October 26.
Approximately 20cm deformation away from the satellite (eastward and / or downward movement) is detected for two earthquakes separately.
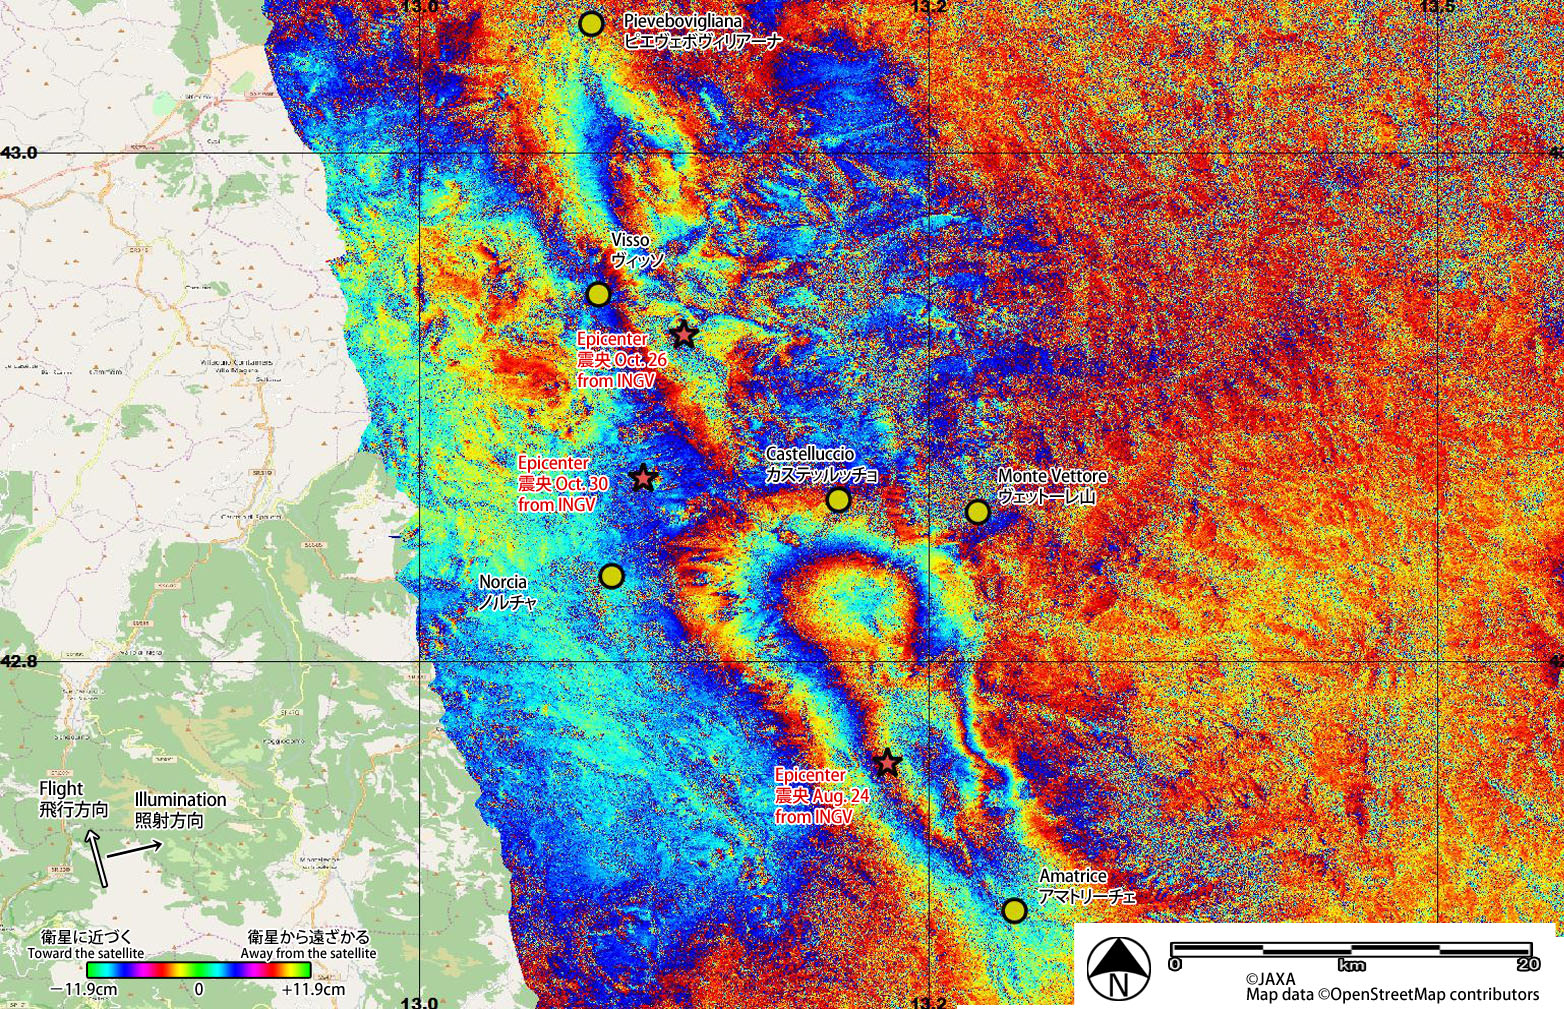
Fig.8: DInSAR result using the ALOS-2 PALSAR-2 data acquired before (February 5, 2016; UTC) and after (October 28, 2016; UTC) the earthquakes on August 24 and October 26. (Click to view enlarged image)
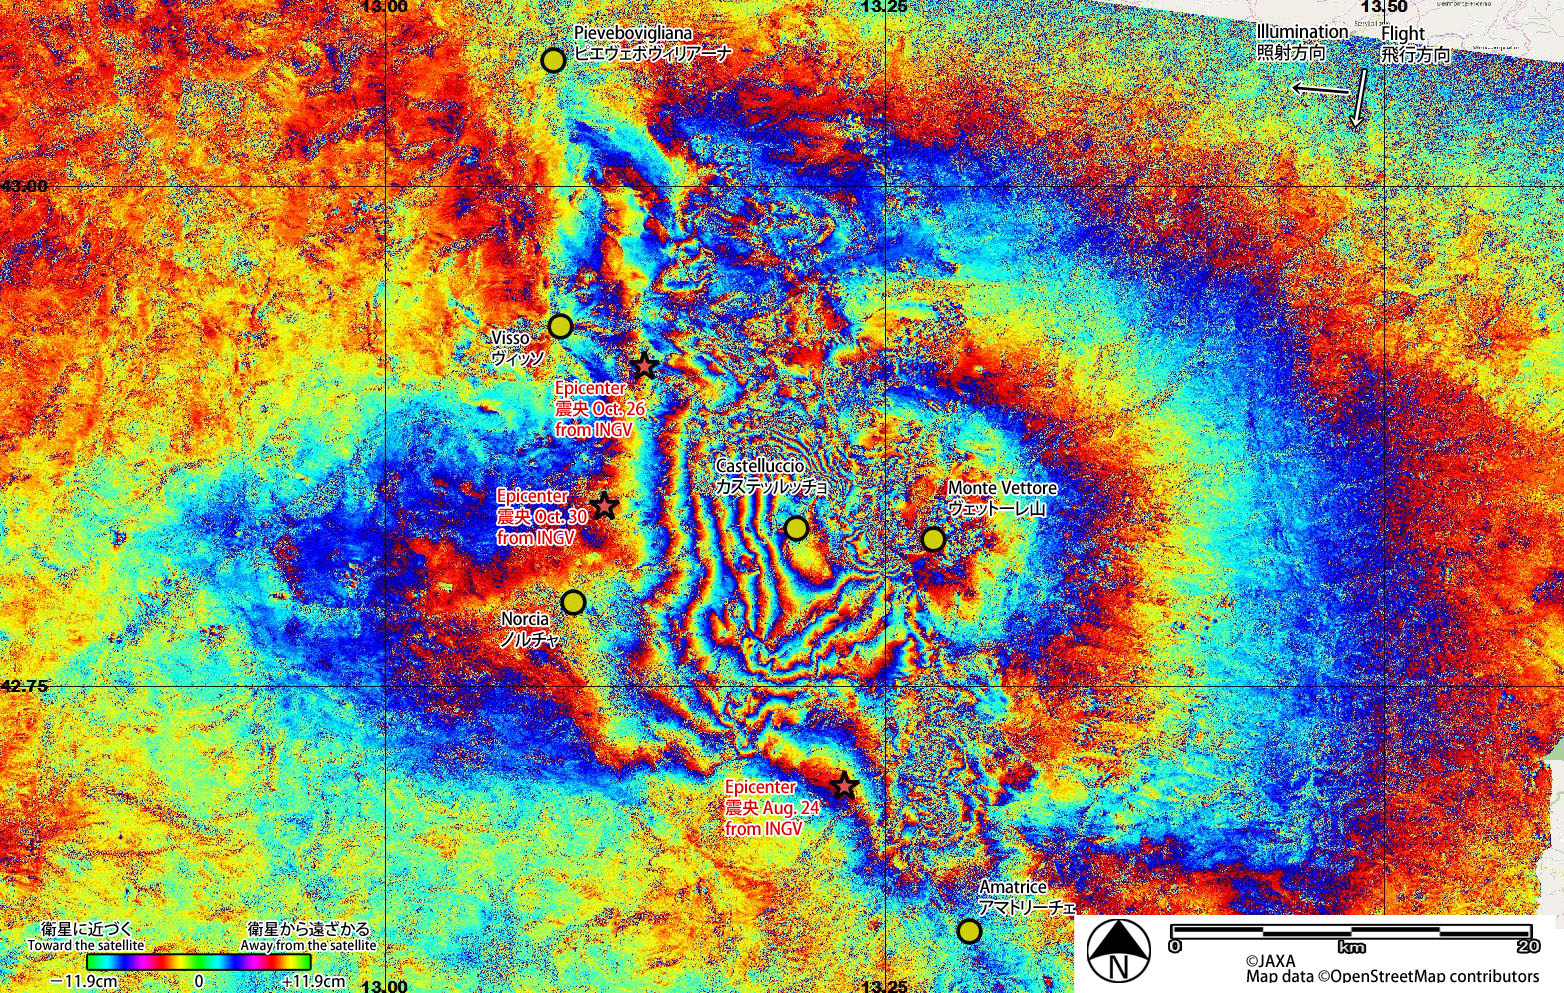
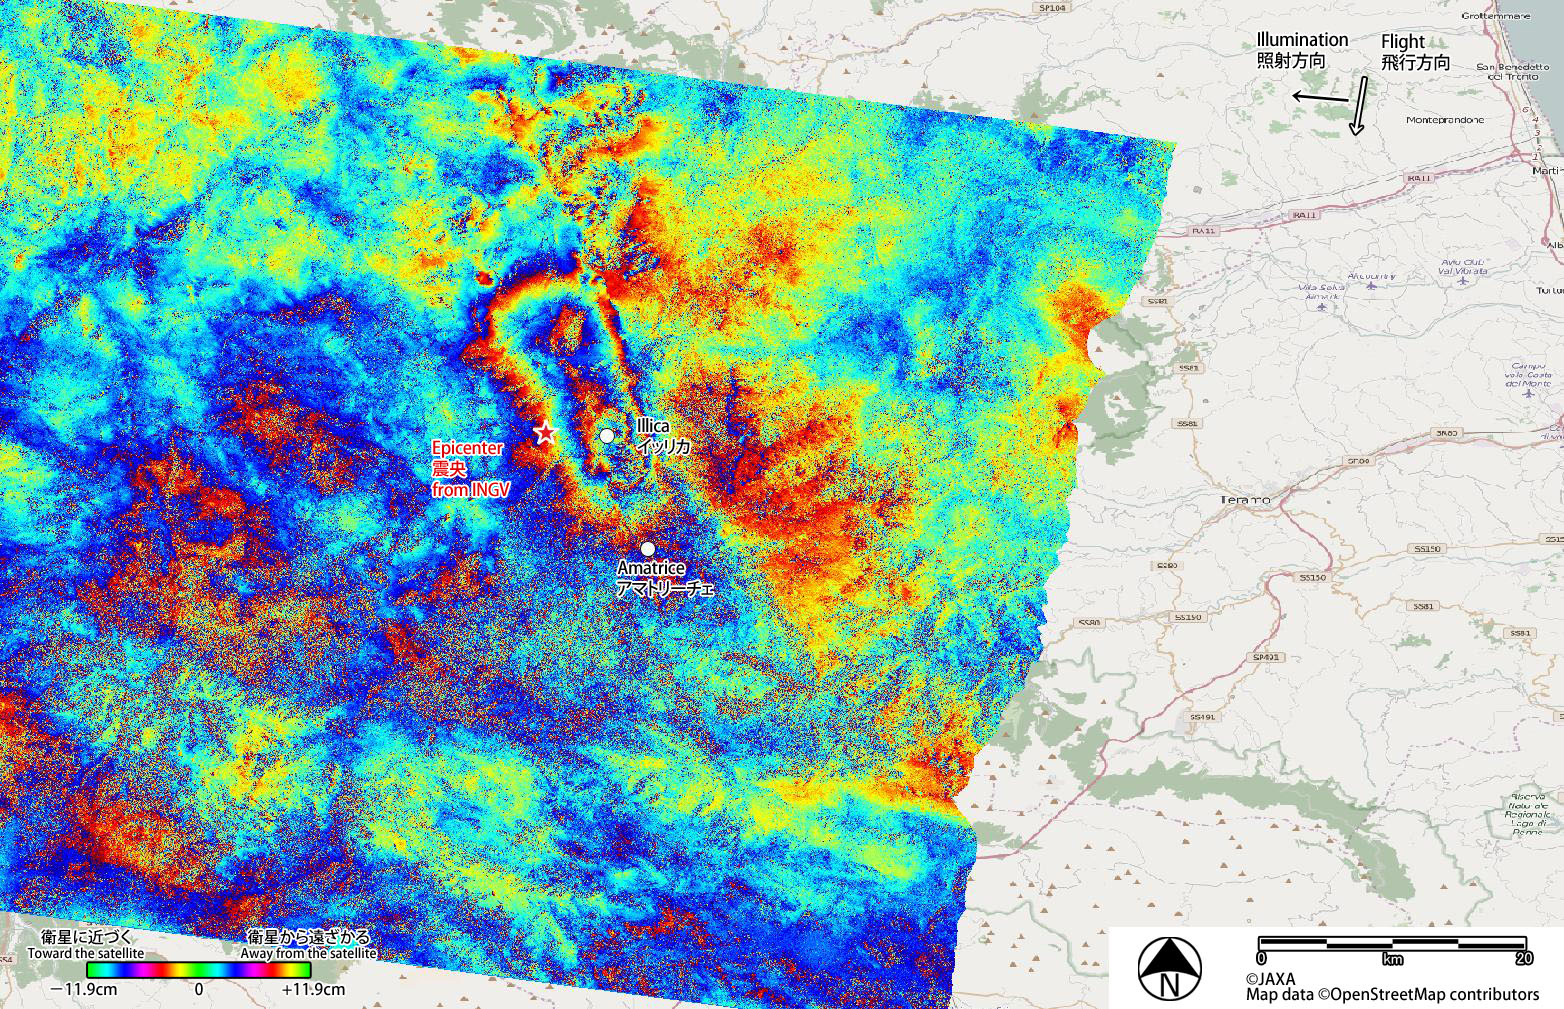
Fig. 9 shows a differential interferometry (DInSAR) result derived from the PALSAR-2 data acquired before (August 24, 2016; UTC) and after (November 2, 2016; UTC) the earthquakes on October 26 and 30. Approximately 60 cm deformation away from the satellite (eastward and / or downward movement) is detected at the city of Castelluccio while 30 cm deformation close to the satellite (westward and / or upward movement) at the city of Norcia.
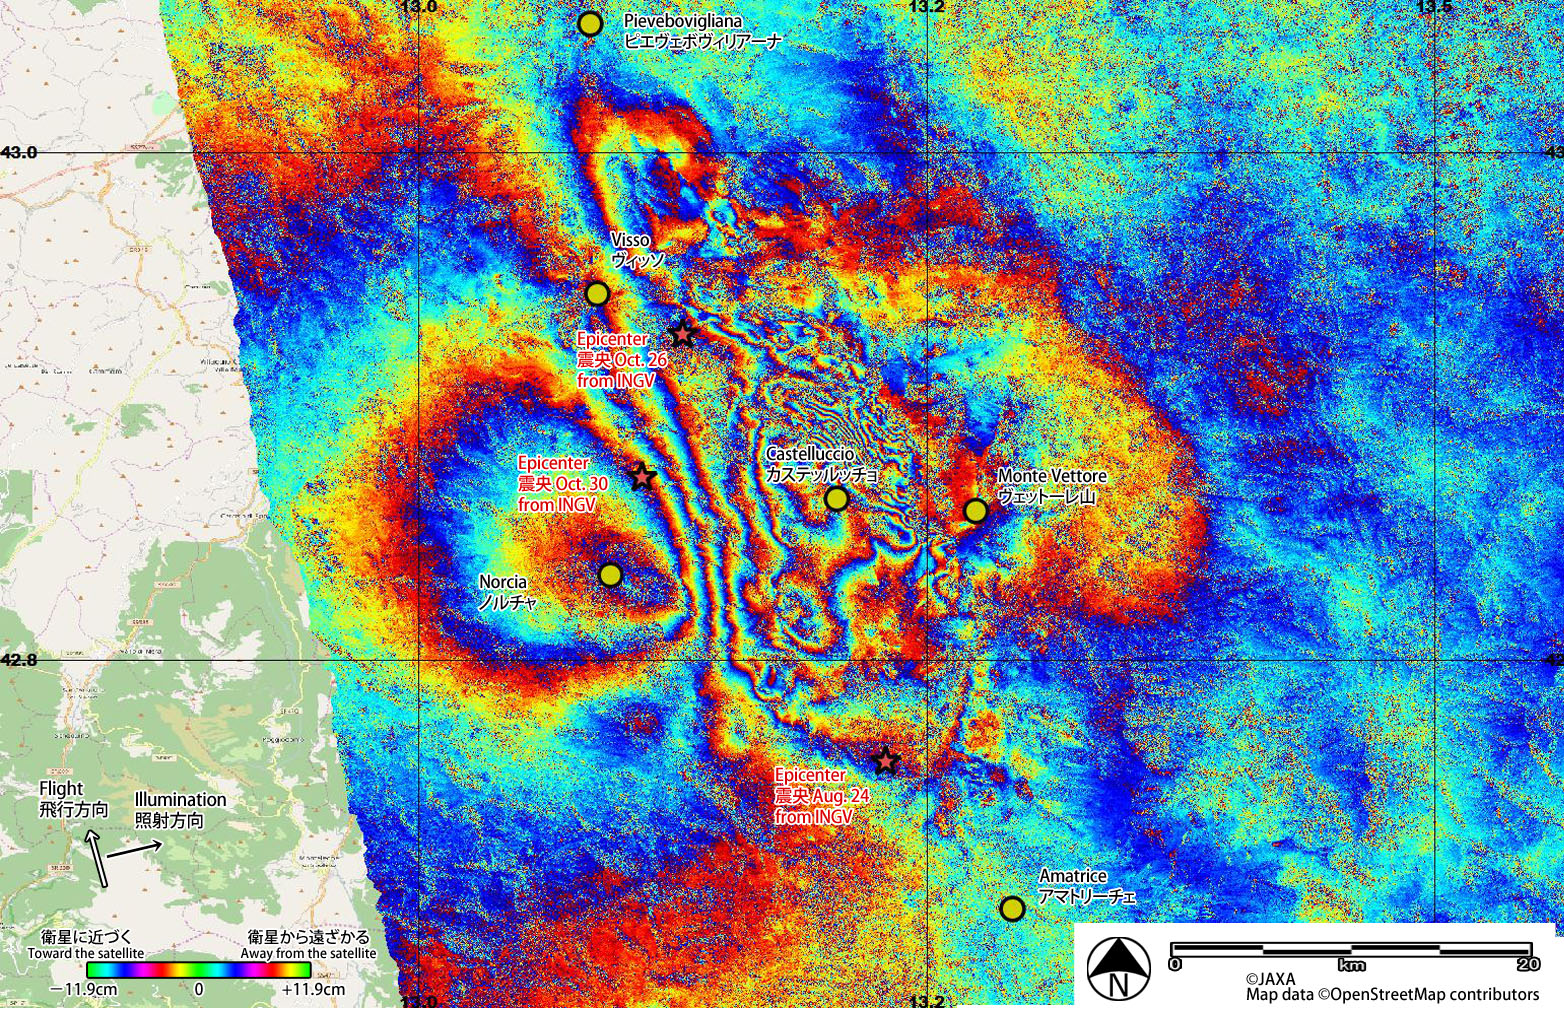
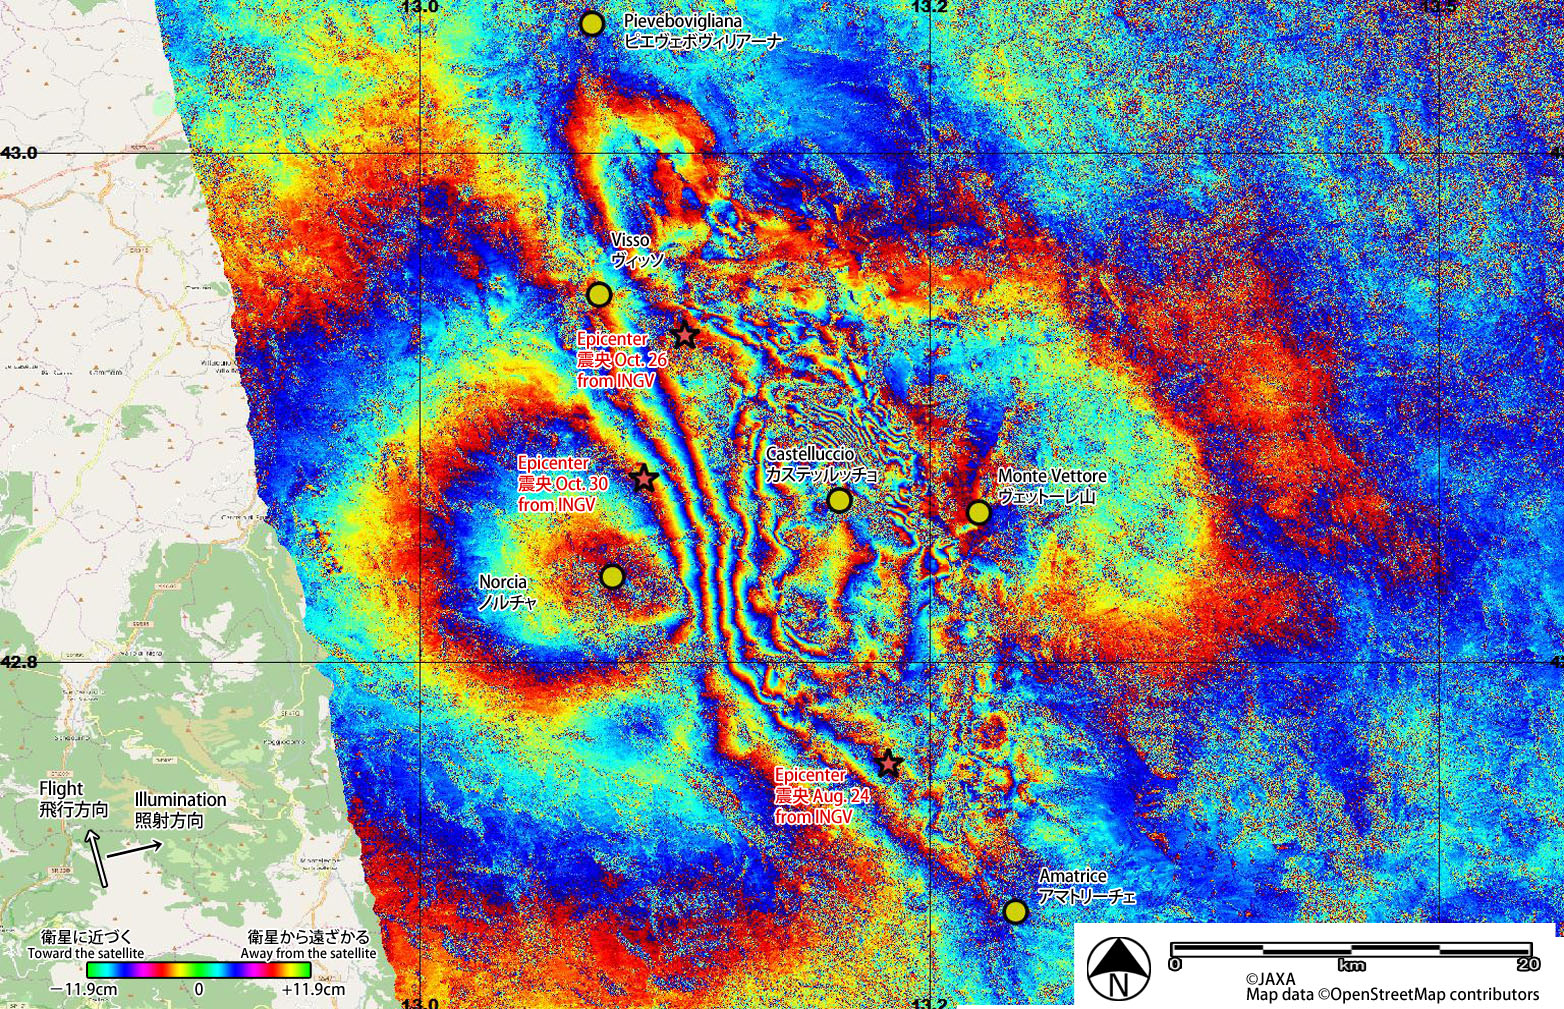
Fig. 10 shows a differential interferometry (DInSAR) result derived from the PALSAR-2 data acquired before (September 9, 2015; UTC) and after (November 2, 2016; UTC) the three earthquakes. The deformation area extends approx. 50 km from north to south and more than 40 km from west to east. The city of Amatrice places its south end and the city of Pievebovigliana places its north end.
Update on Nov. 11, 2016. Observation on Nov. 9, 2016
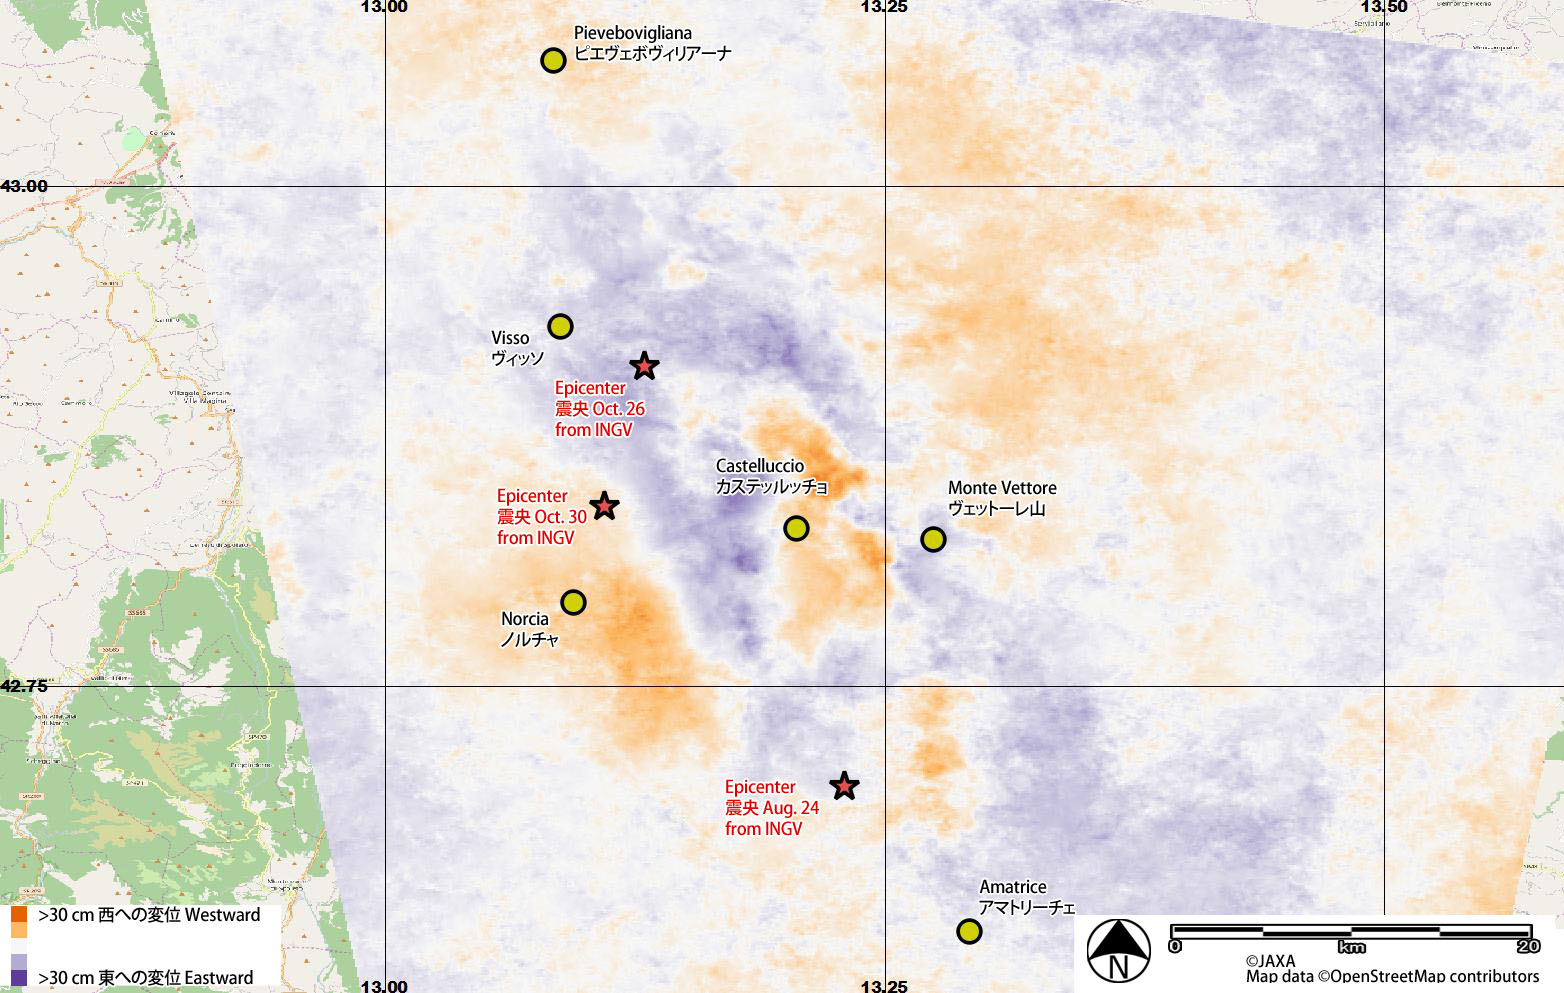
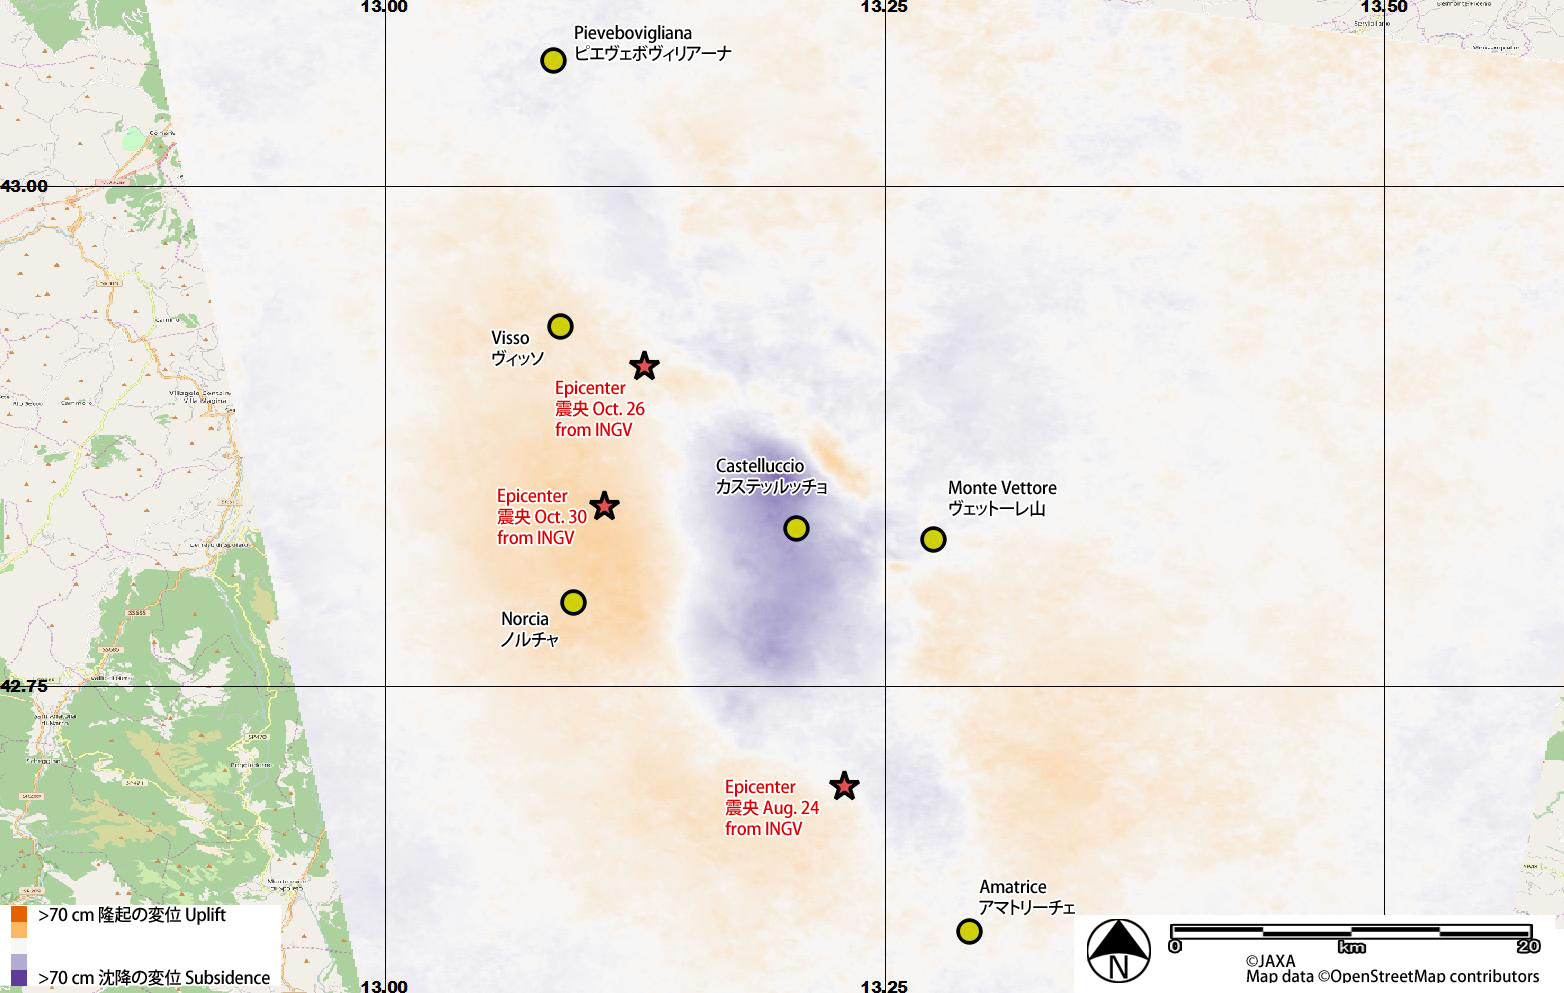
Fig. 11 shows a DInSAR result derived from the PALSAR-2 data acquired before (August 31, 2016; UTC) and after (November 9, 2016; UTC) the earthquakes on October 26 and 30. Approximately 80 cm deformation away from the satellite (westward and / or downward movement) is detected at the city of Castelluccio while 25 cm deformation close to the satellite (eastward and / or upward movement) is detected at Monte Vettore.
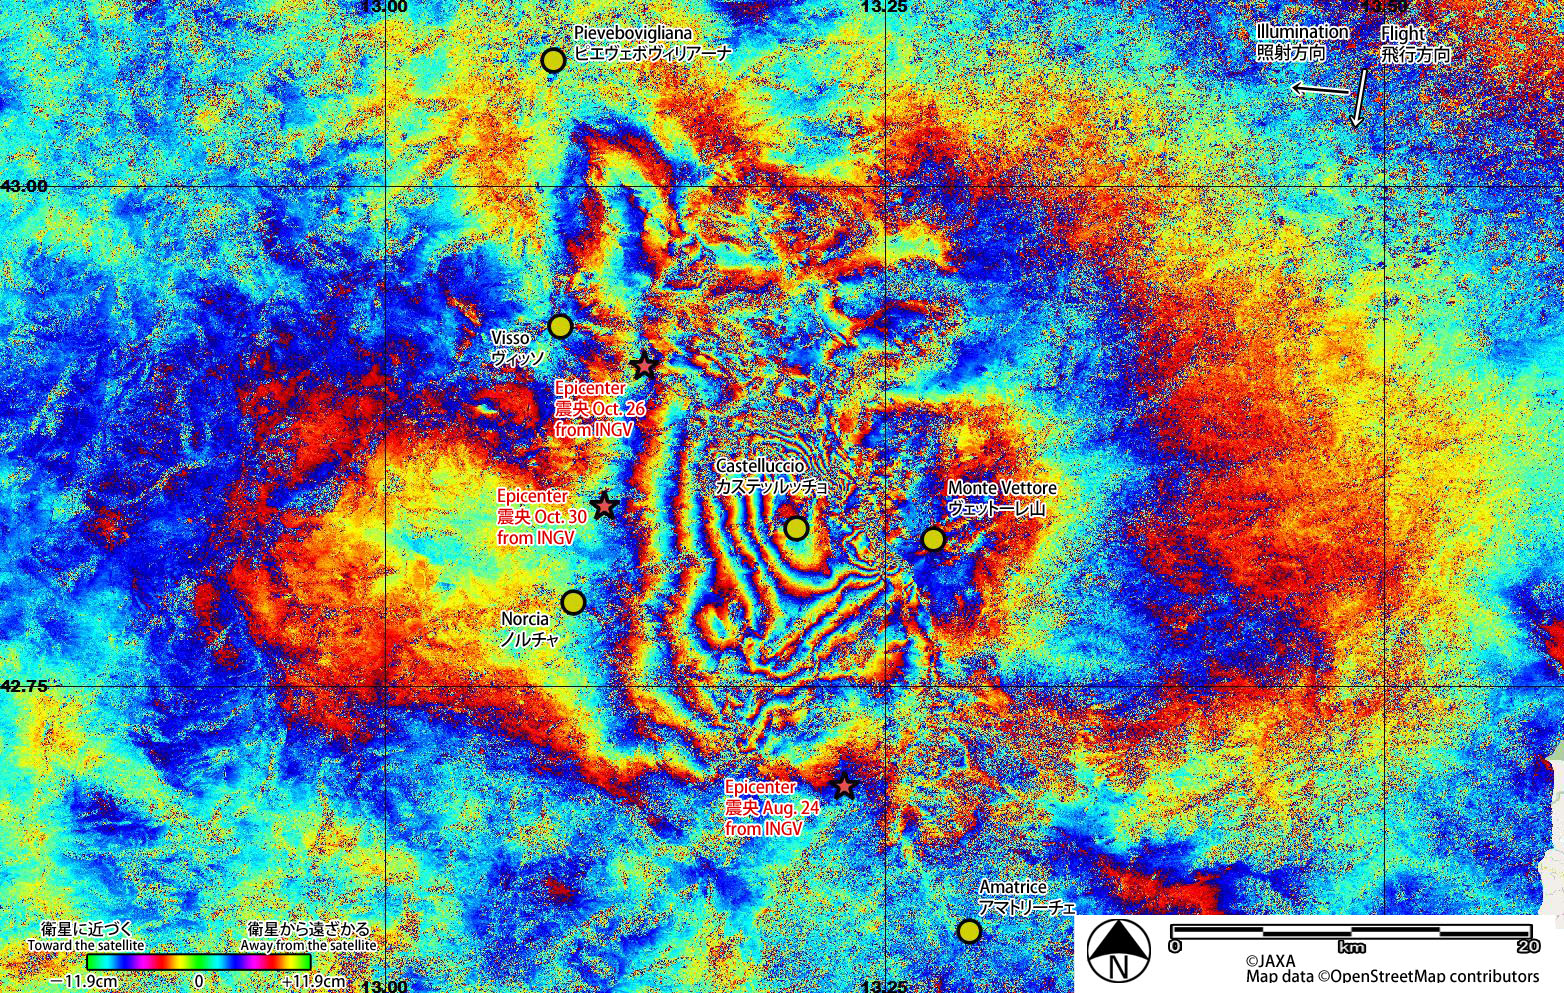
Fig. 12 shows a DInSAR result derived from the PALSAR-2 data acquired before (May 25, 2015; UTC) and after (November 9, 2016; UTC) the three earthquakes.