Image Library
ALOS-2/PALSAR-2 Observation Result for Eruption of Mt. Kilauea and Earthquake in Hawaii
Updated:May 15, 2018, 9:00 (UTC)
Updated:May 21, 2018, 8:00 (UTC)
Overviews
- On May 3 and 4, 2018, Mt. Kilauea in Big Island, Hawaii, started the eruption.
- On May 4, a major earthquake of Mw 6.9 (USGS) occurred close to Mt. Kilauea.
- JAXA performed an emergency observation by ALOS-2 (“DAICHI-2”) on May 8, 2017 (UTC), and ALOS-2 captured part of surface displacement.
- The interferogram using the two images on May 12, 2018 and Jan. 20, 2018 revealed the wider crustal deformation, and the changes in lava lakes’ level.
- The interferogram using the two images on May 17, 2018 and Jan. 25, 2018 showed the change in Halemaumau crater due to the explosive eruption on May 17.
- The observation data were provided to local institutions. ALOS-2 will be able to be contributed to monitor volcanic activity regardless of clouds, volcanic plumes, and sun light.

Fig. 1: Topography on Big Island and the observation area by ALOS-2.The red rectangle shows the area by Stripmap mode(data ① in Table 1), and the blue one shows that by ScanSAR mode(data ② in Table 1). The black one shows the area shown in Fig. 5.
| Observation time (UTC) | Orbit number | Observation mode | Polarization | Observation direction | Beam number | |
| ① | May 8, 2018 | 89 | Stripmap 10m | HH+HV | Right | F2-6 |
| ② | May 12, 2018 | 185 | ScanSAR | HH+HV | Right | W2 |
| ③ | May 17, 2018 | 186 | ScanSAR | HH+HV | Right | W2 |
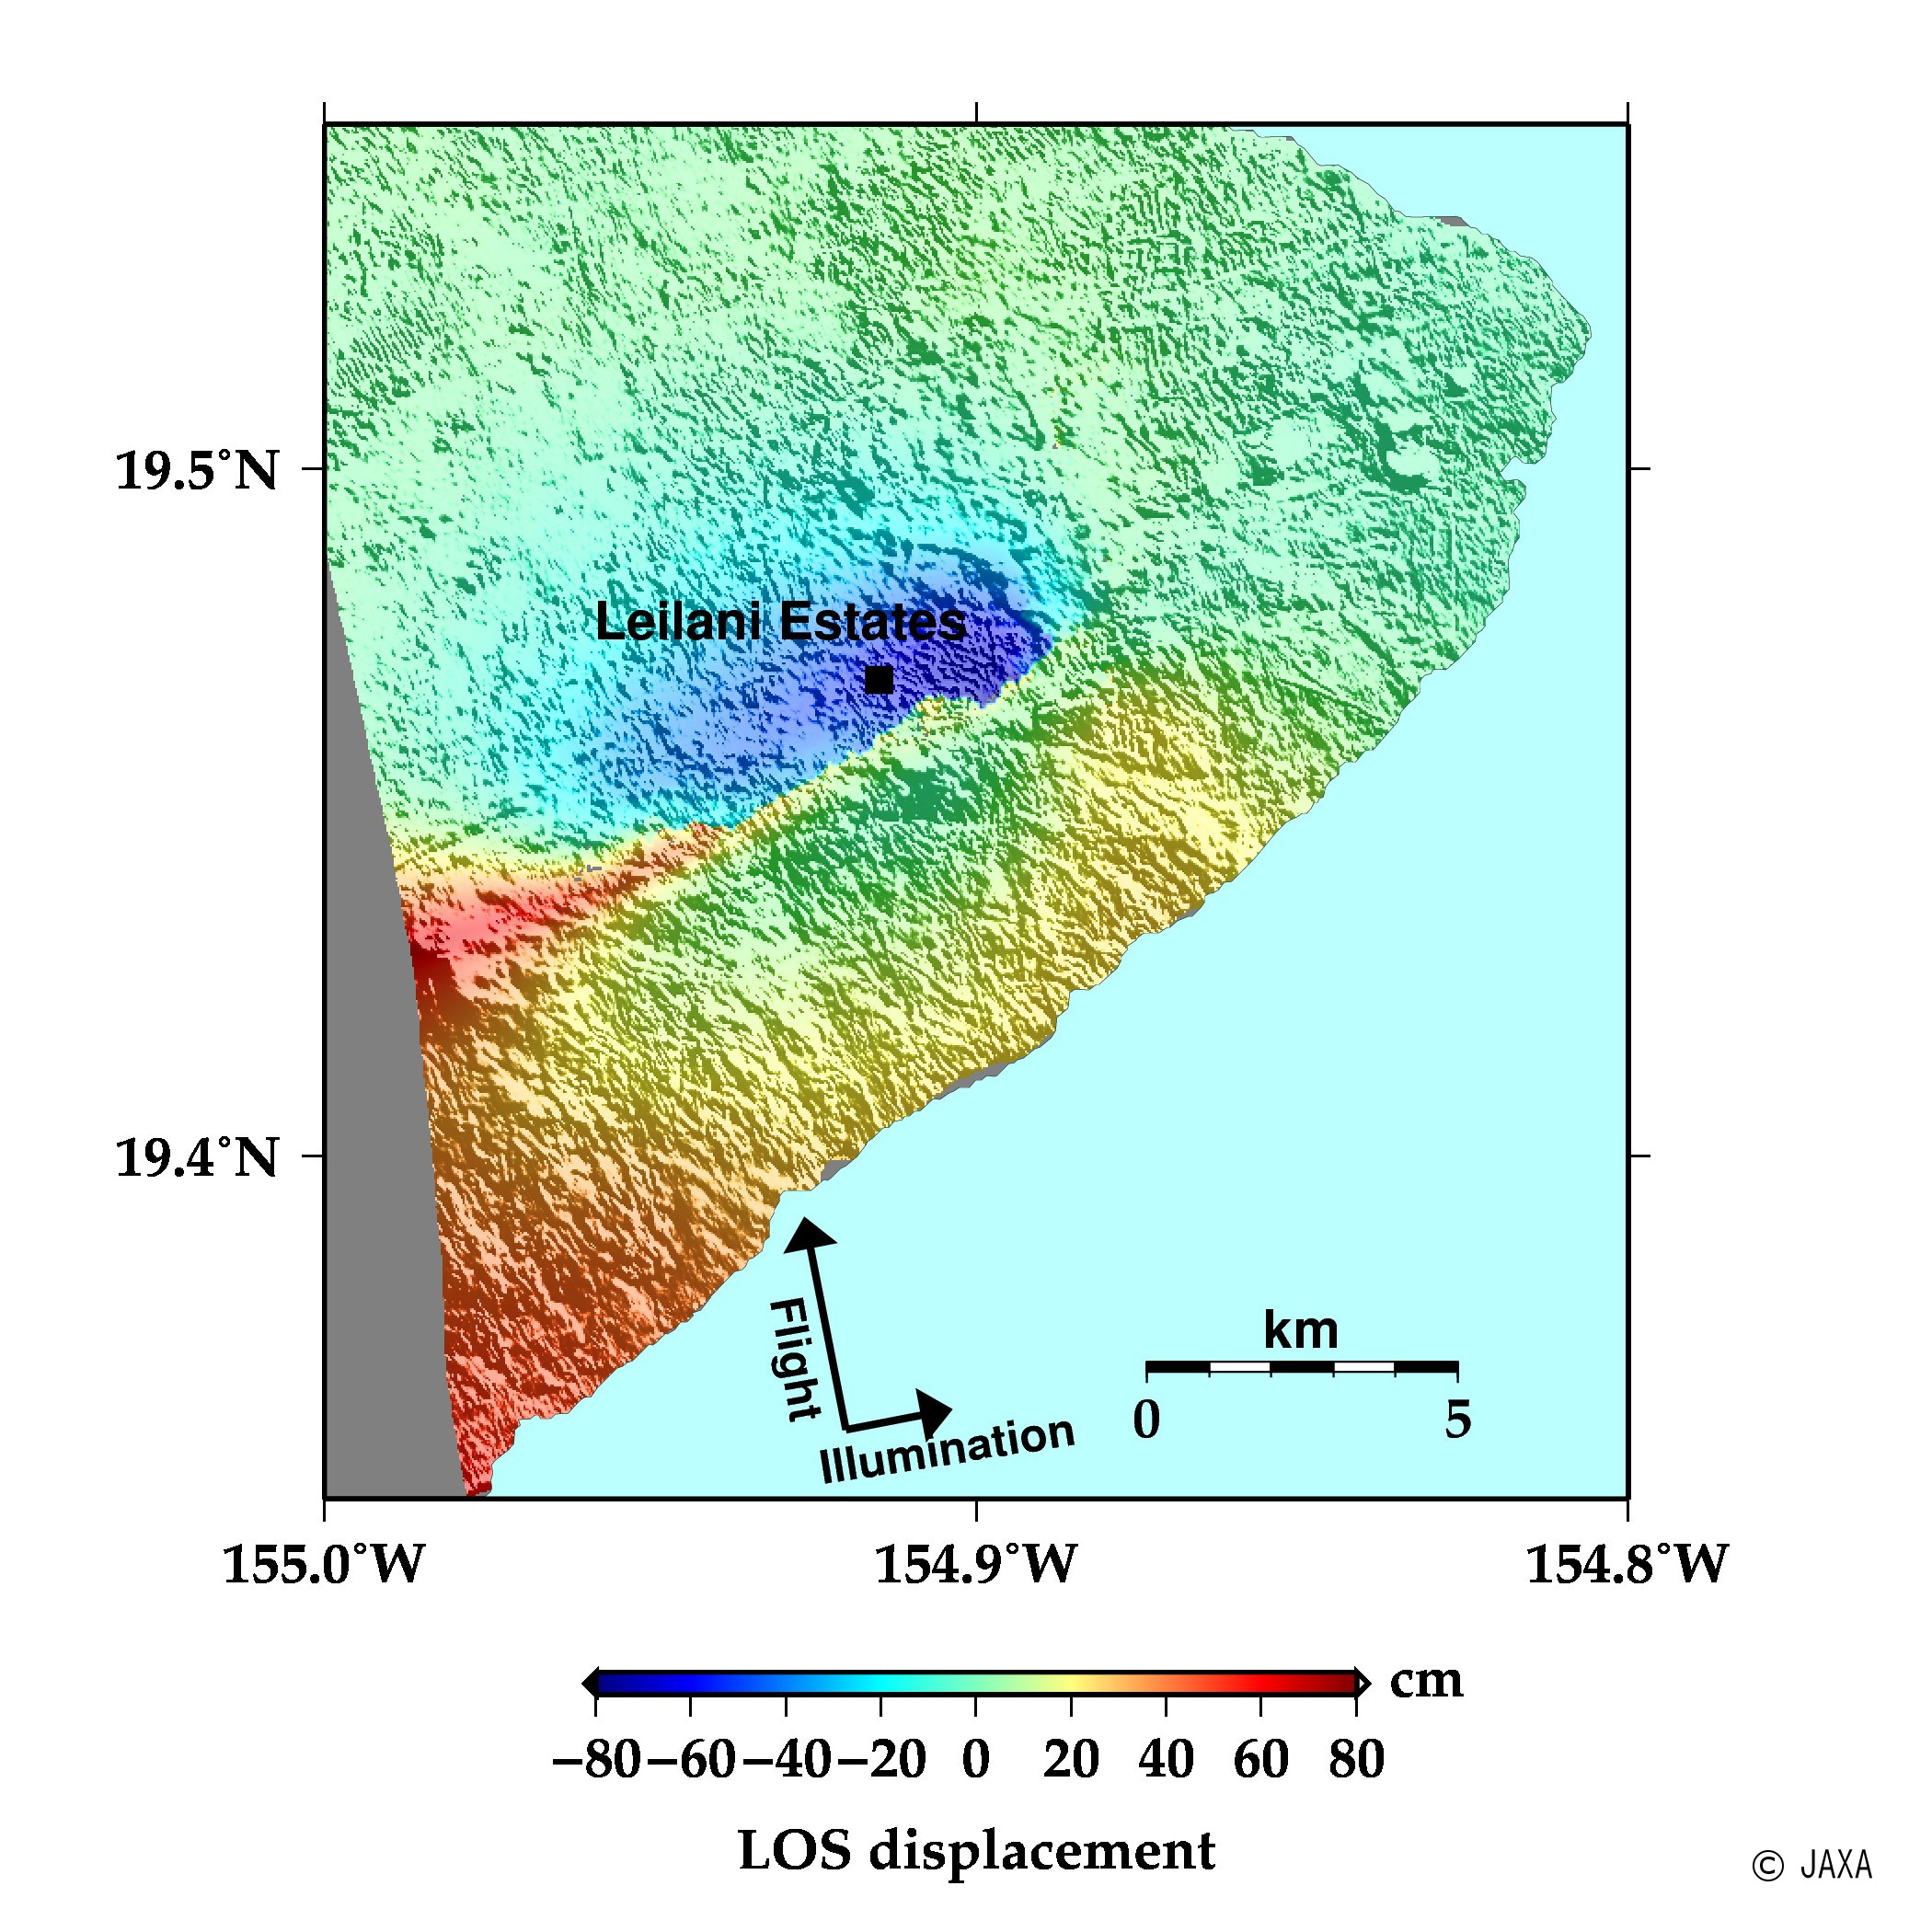
Fig. 2: An interferometric image of the ALOS-2 PALSAR-2 data acquired before (February 27, 2018) and after (May 8, 2018) the eruption and earthquake.
(Click to view enlarged image)
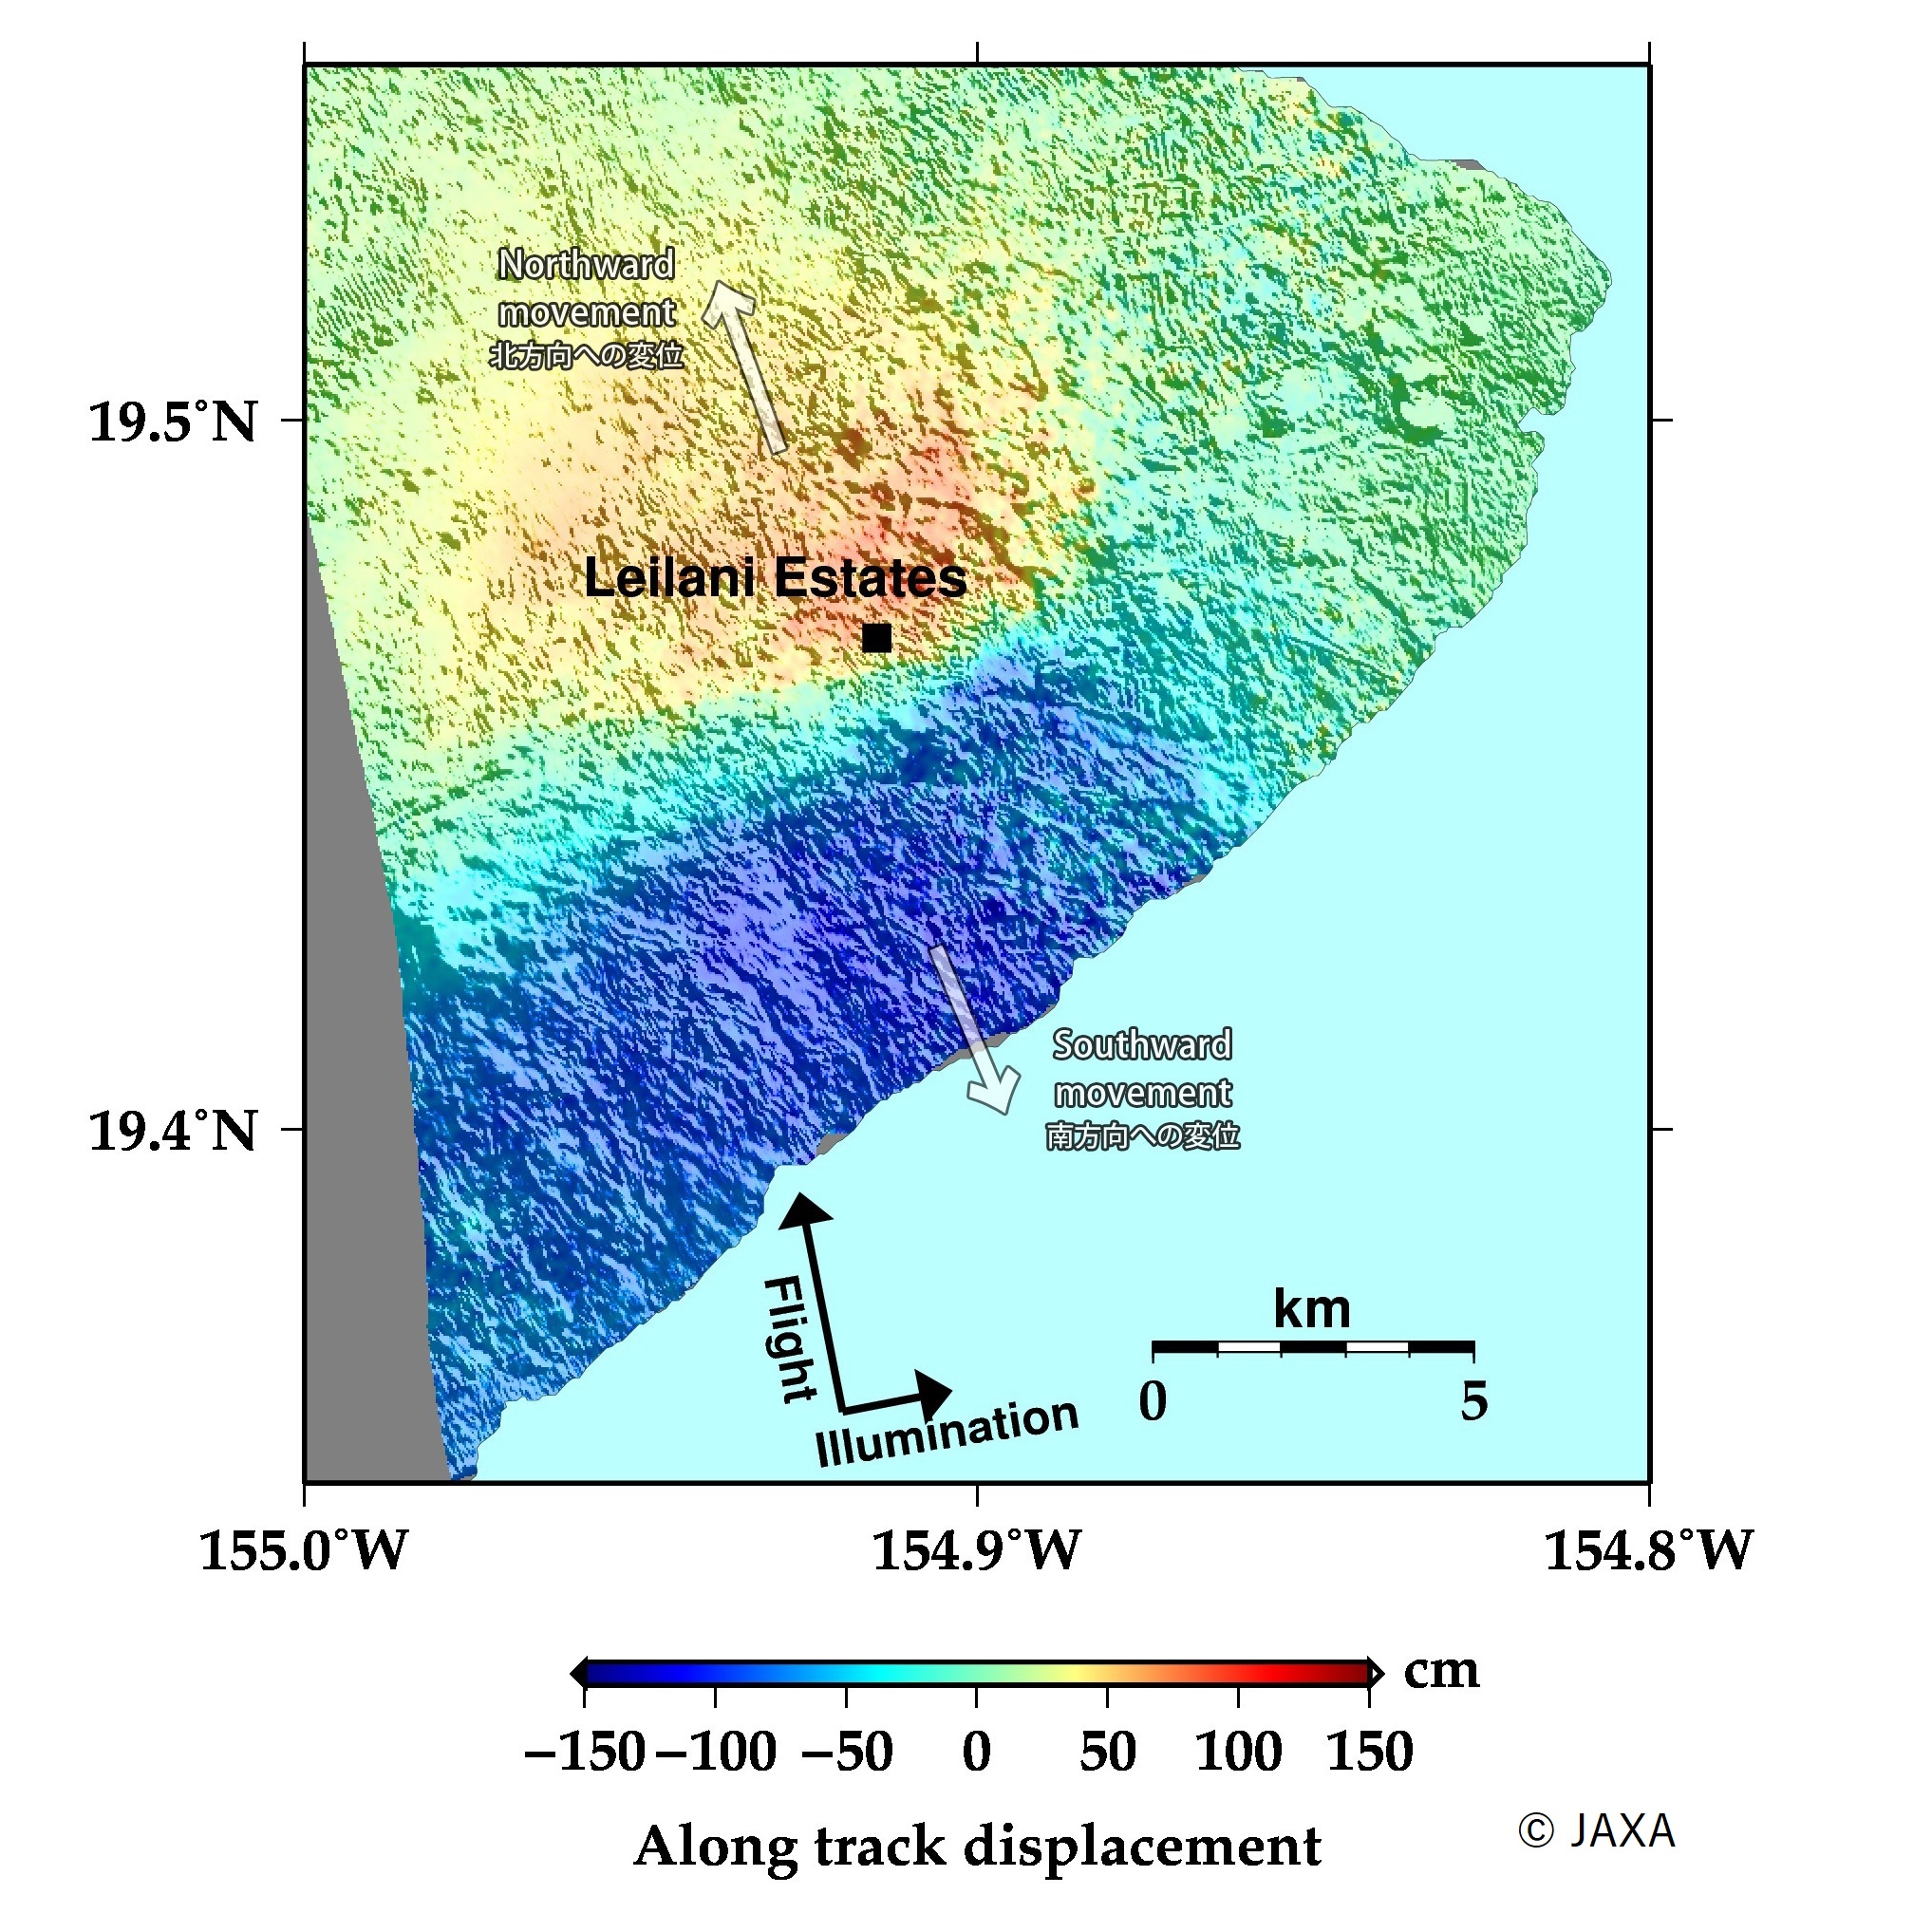
Fig. 3: A Multiple Aperture Interferometry image of the ALOS-2 PALSAR-2 data acquired before (February 27, 2018) and after (May 8, 2018) the eruption and earthquake.
(Click to view enlarged image)
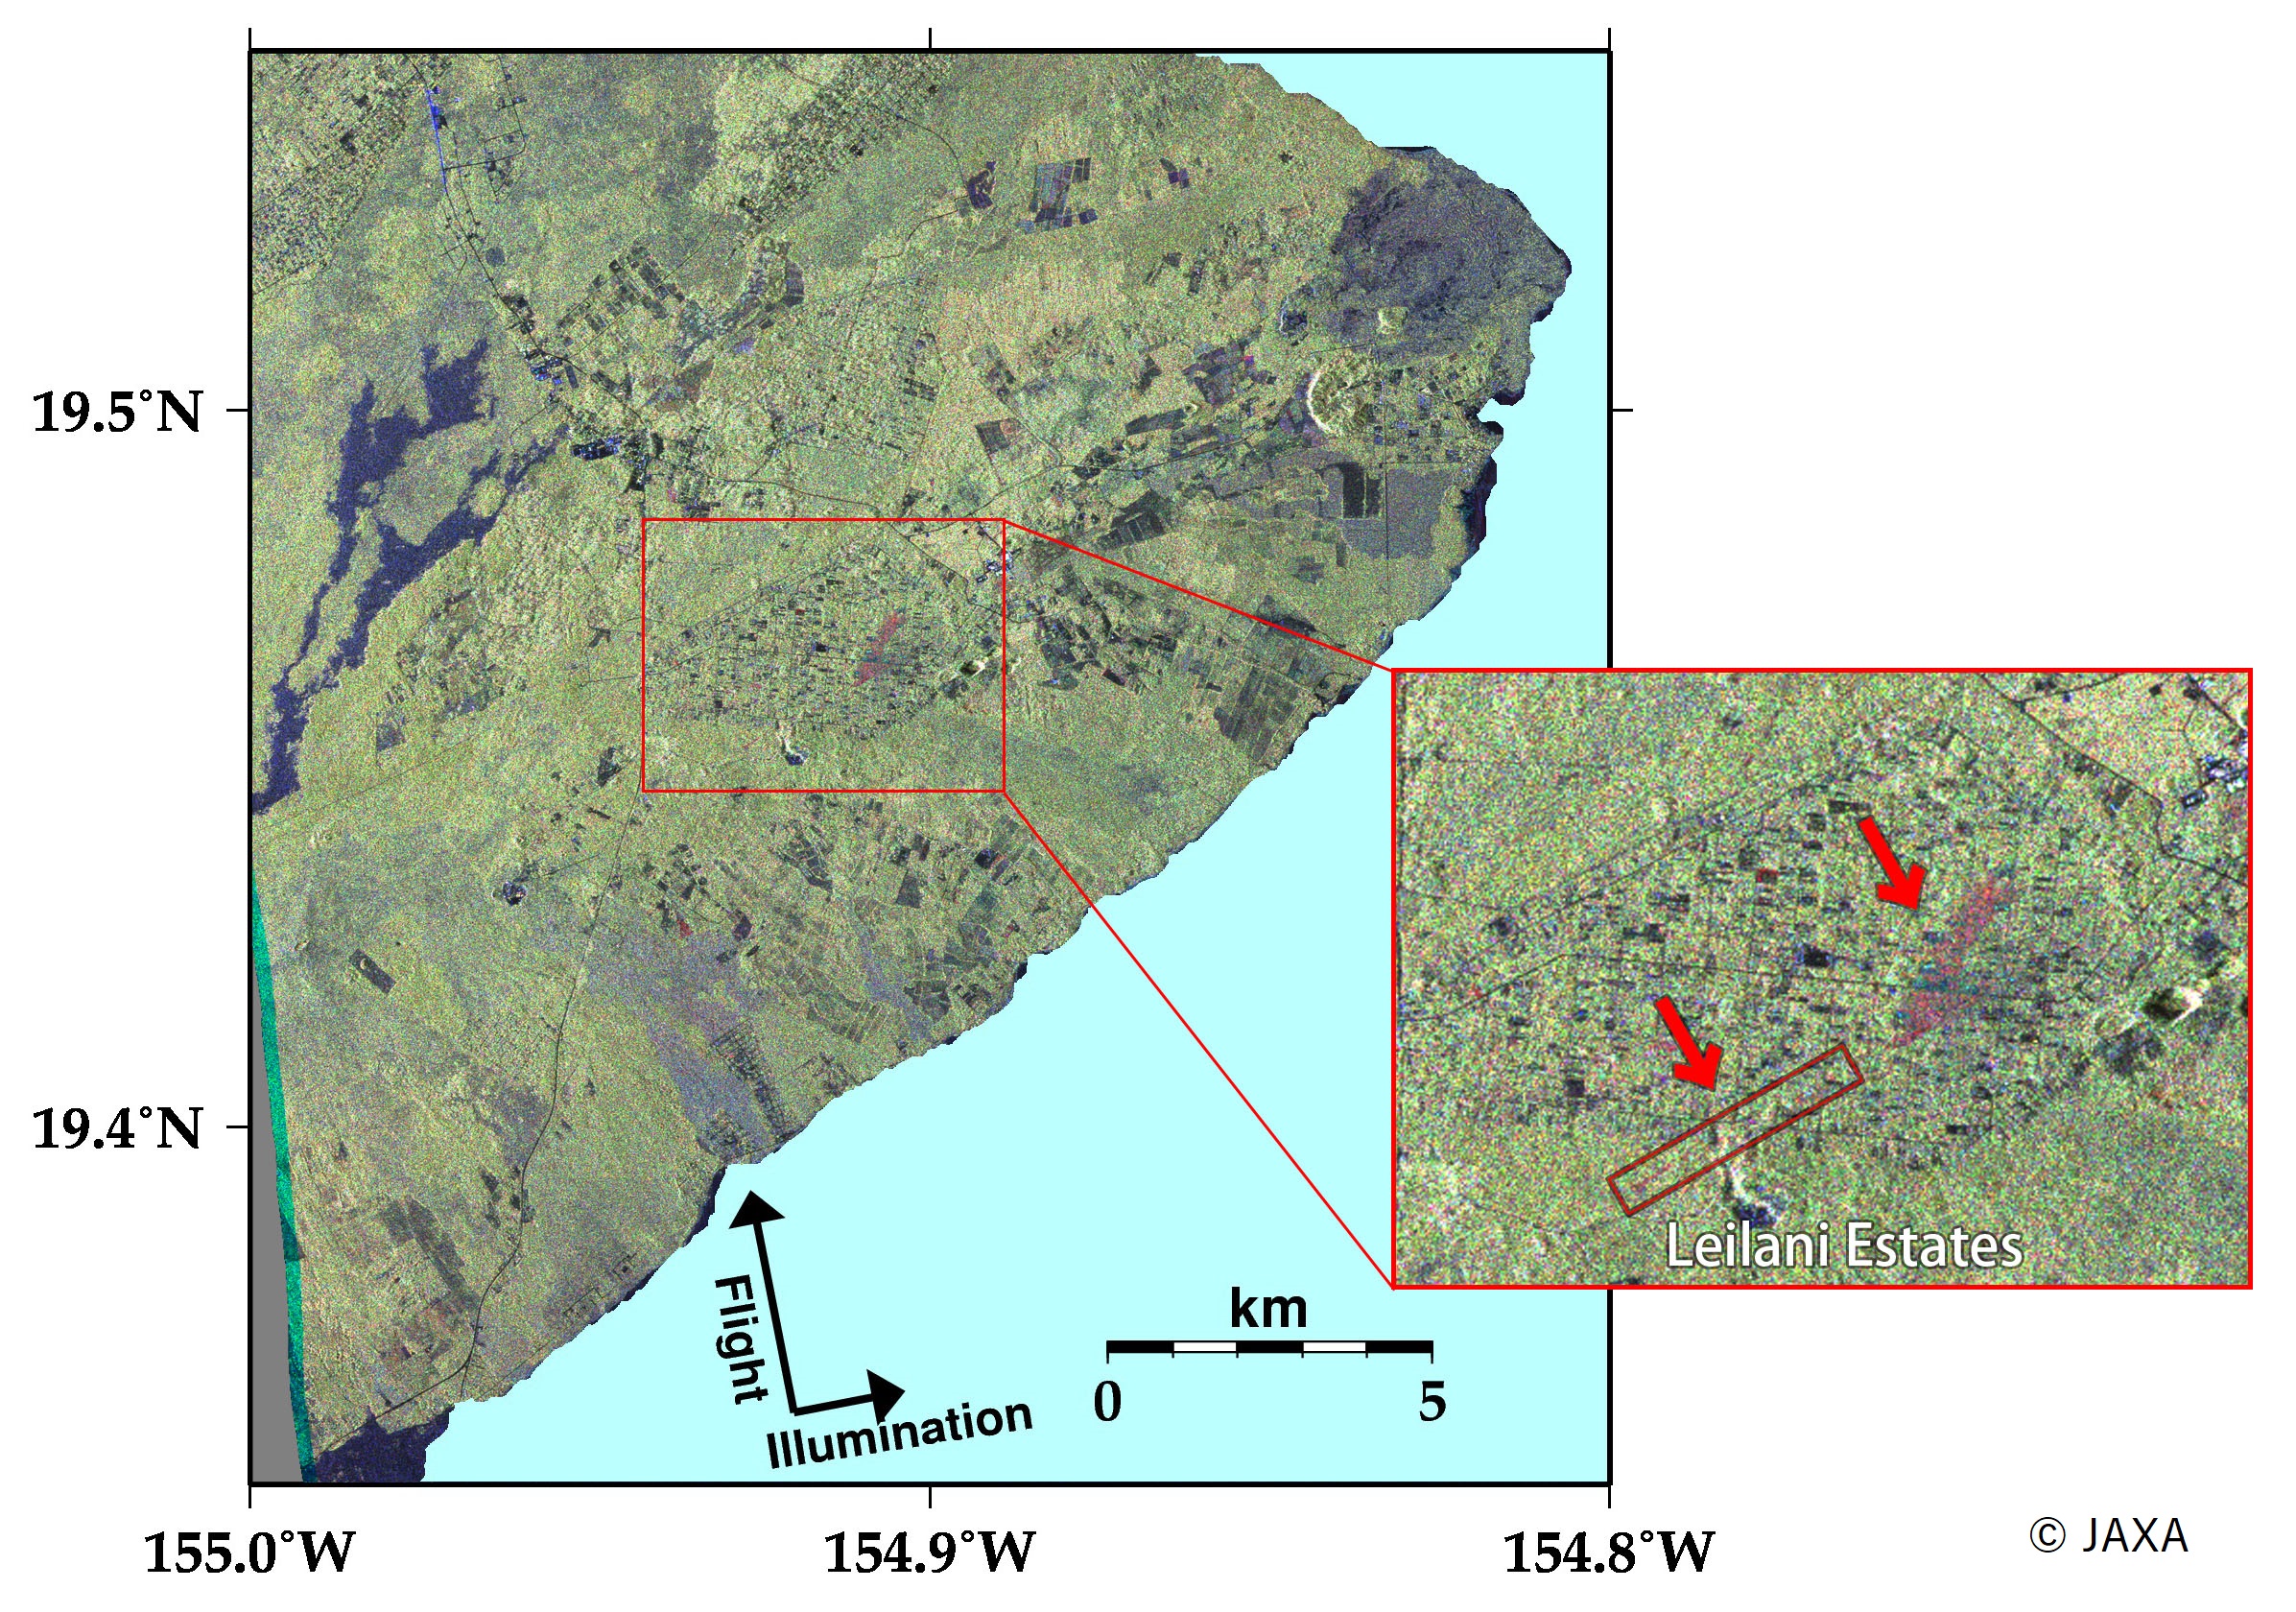
Fig. 4: Polarimetric color-composite image of the ALOS-2 PALSAR-2 data acquired before (February 27, 2018) and after (May 8, 2018) the eruption and earthquake.
(Click to view enlarged image)
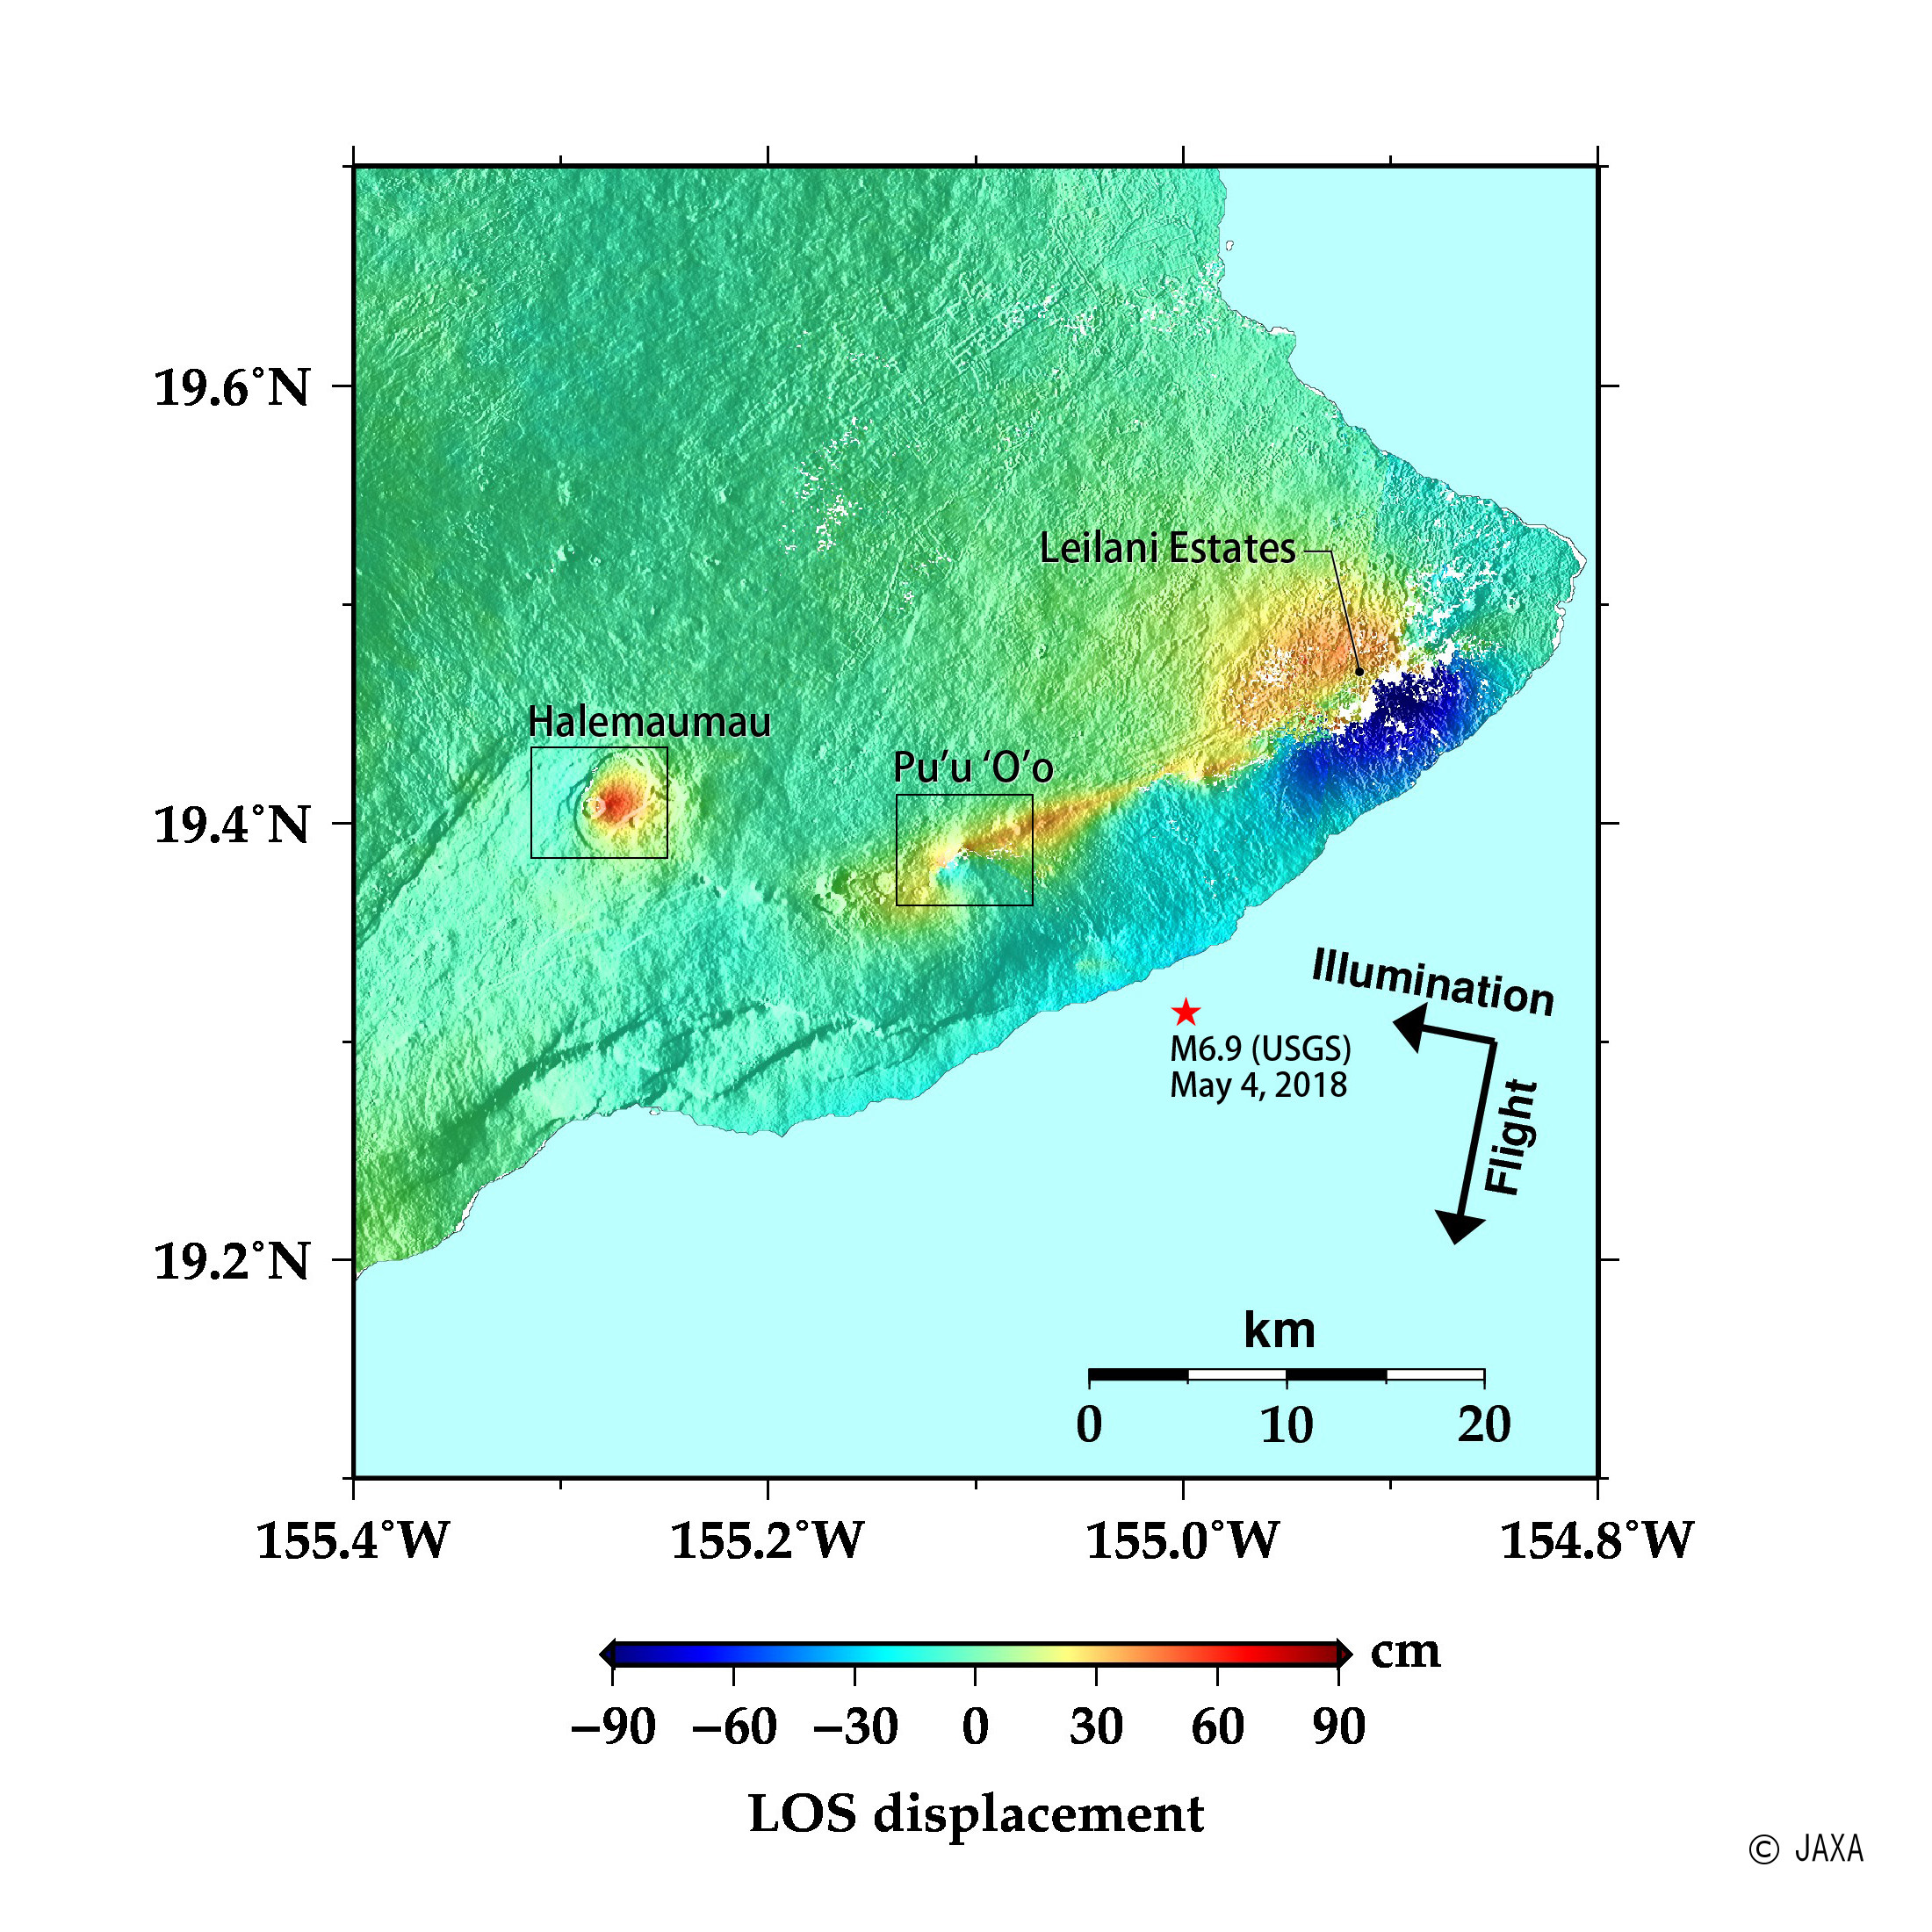
Fig. 5: An interferometric image of the ALOS-2 PALSAR-2 data acquired before (January 20, 2018) and after (May 12, 2018) the eruption and earthquake.
(Click to view enlarged image)
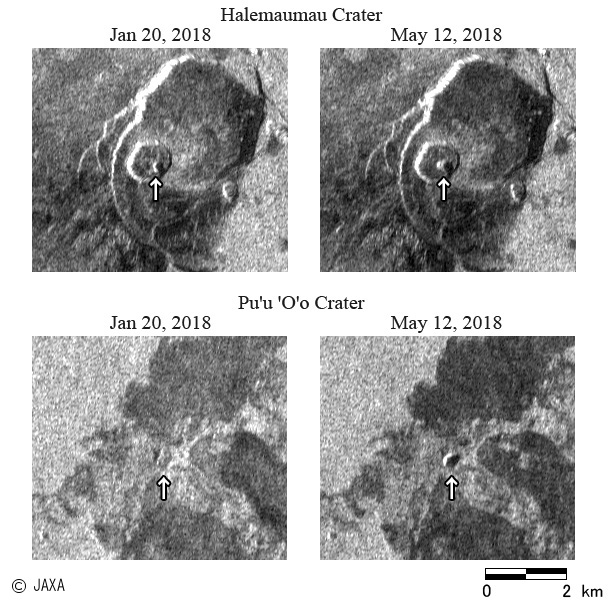
Fig. 6: Comparison of the two HH amplitude images acquired before (January 20, 2018) and after (May 12, 2018) the eruption and earthquake.
(Click to view enlarged image)
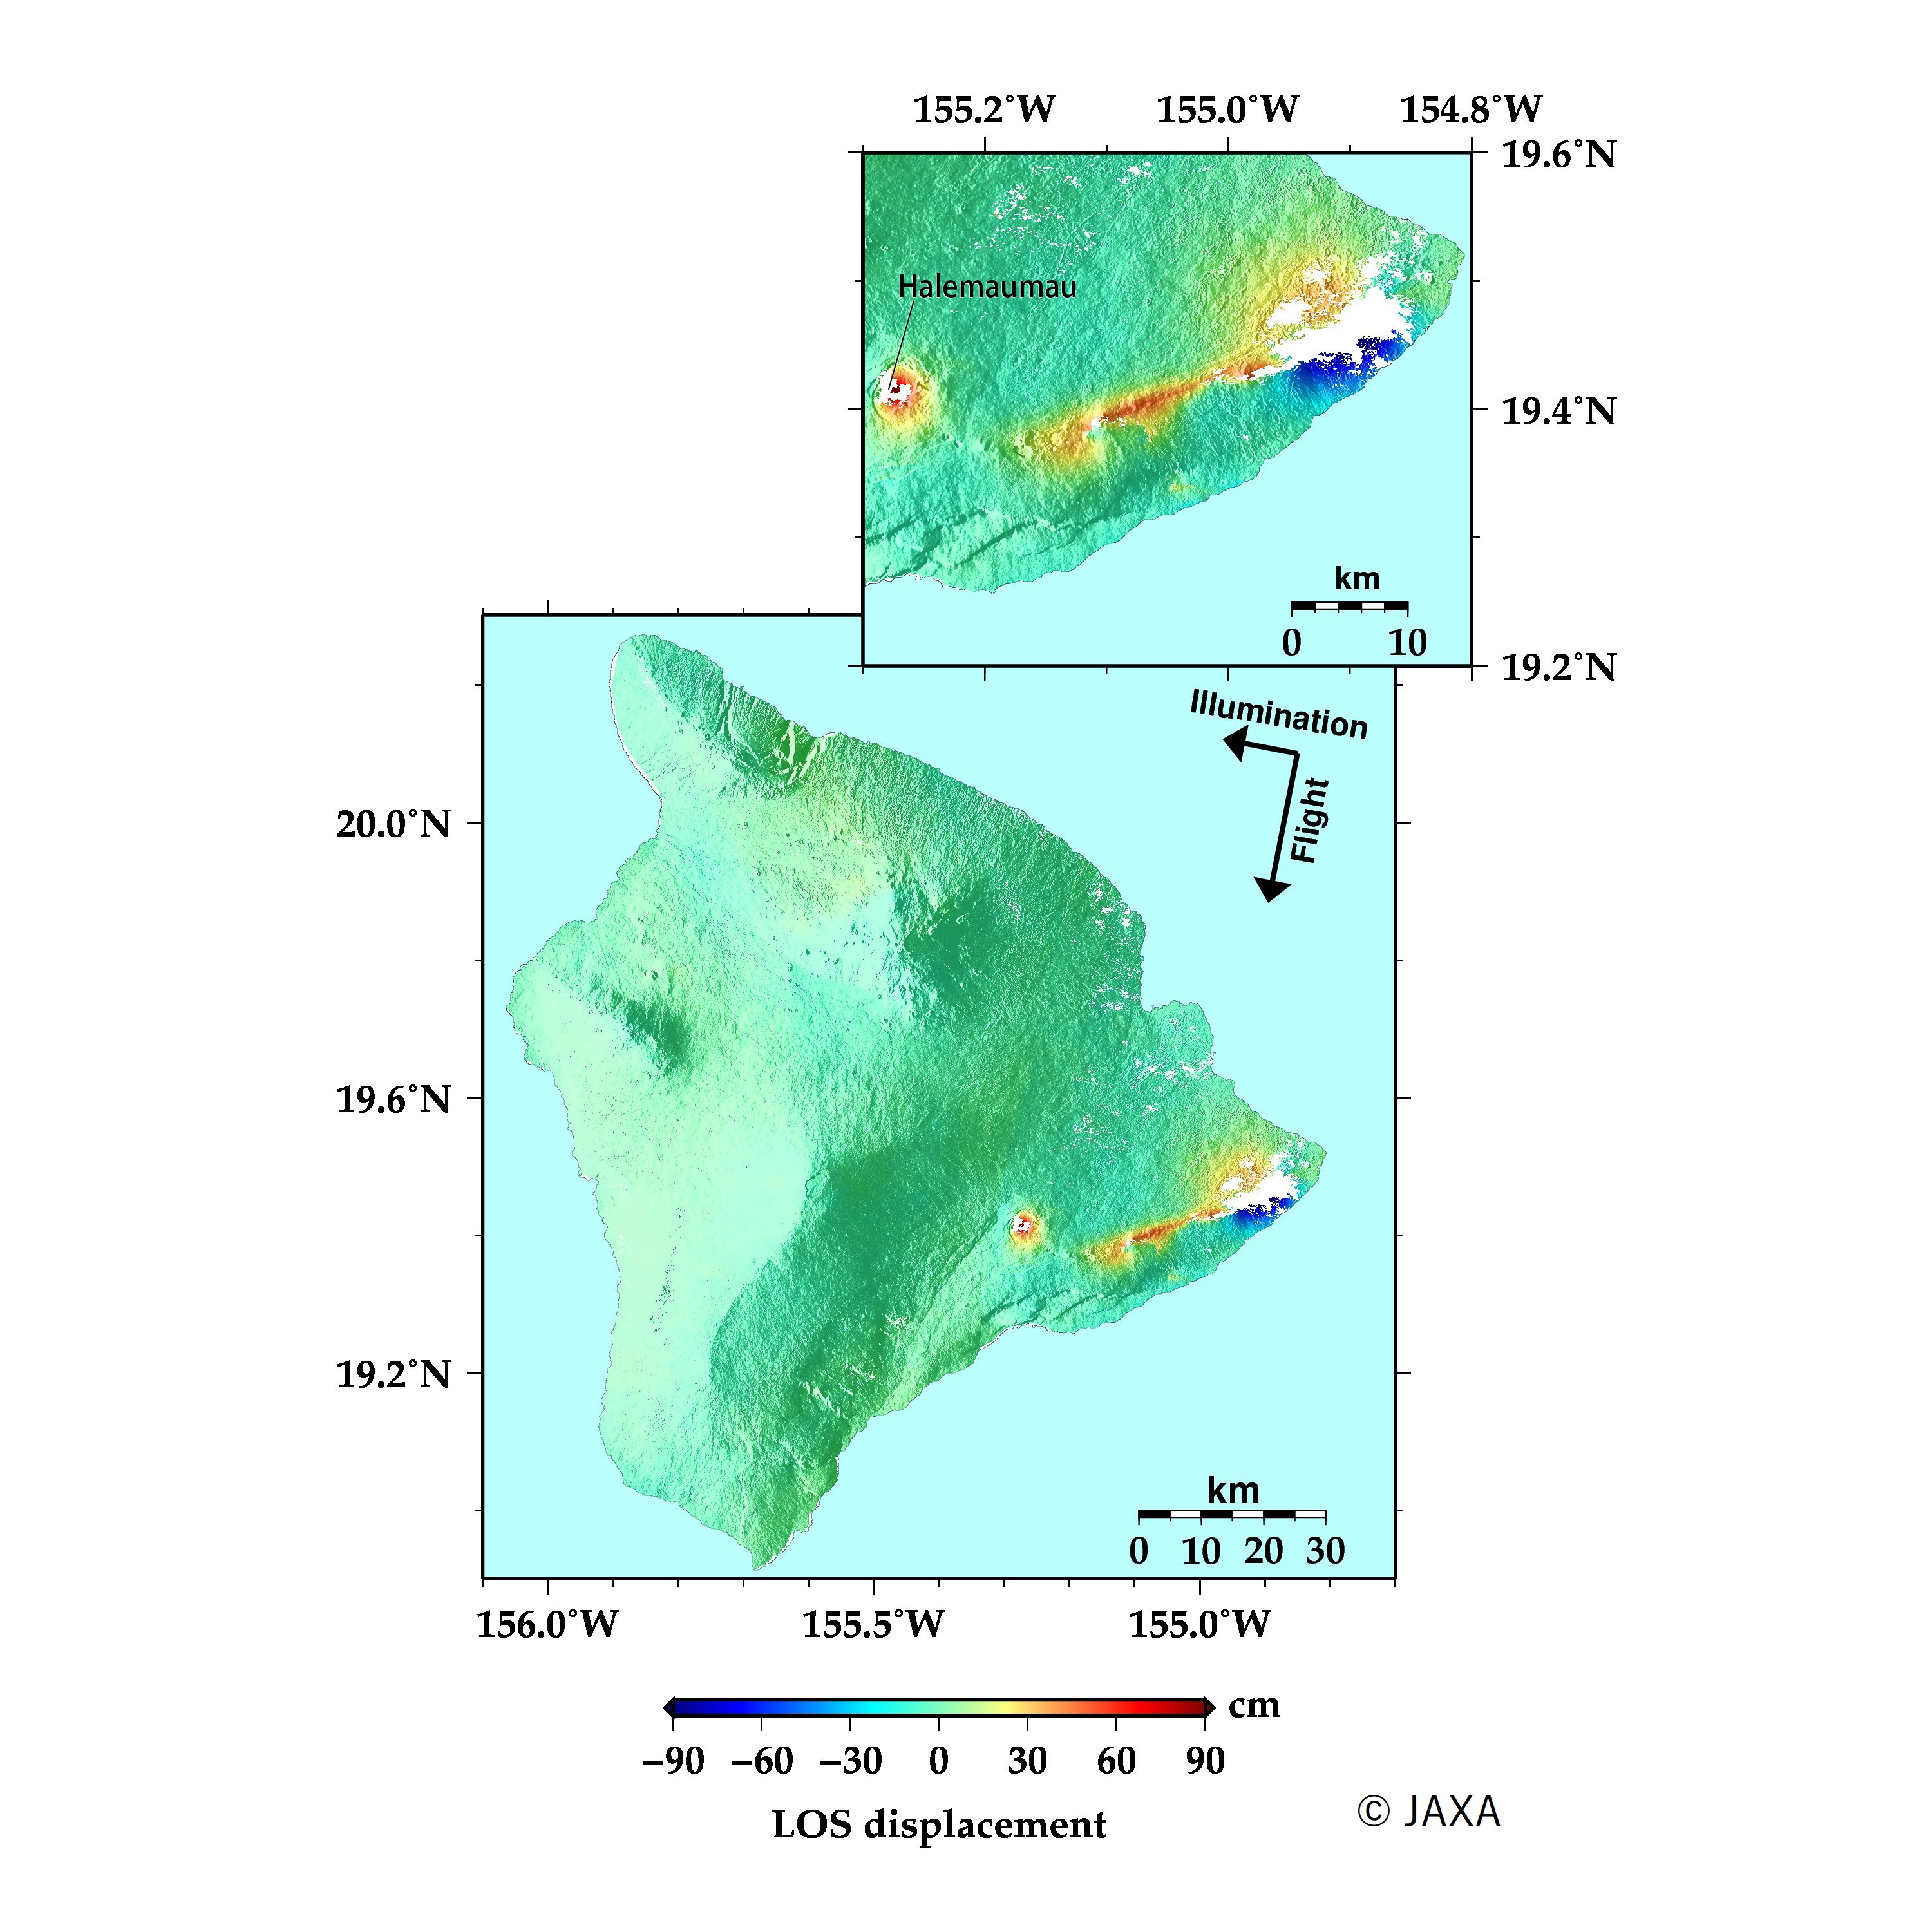
Figure 7 shows the interferogram using the ALOS-2 PALSAR-2 data acquired on January 25, 2018 and May 17, 2018. The result seems similar to that in Fig.5, but there is up to 110 cm displacement away from satellite in Halemaumau crater.
(Click to view enlarged image)
Fig. 8: Comparison of the two HH amplitude images acquired on May 12, and 17, 2018.
(Click to view enlarged image)