Image Library
ALOS-2/PALSAR-2 Observation Result for Eruption of Mt. Sierra Negra in Galapagos
Overviews
Posted: Jul. 13, 2018, 4:00 (UTC)
- Mt. Sierra Negra in Isabela Island, Galapagos, has been erupting since June 26, 2018.
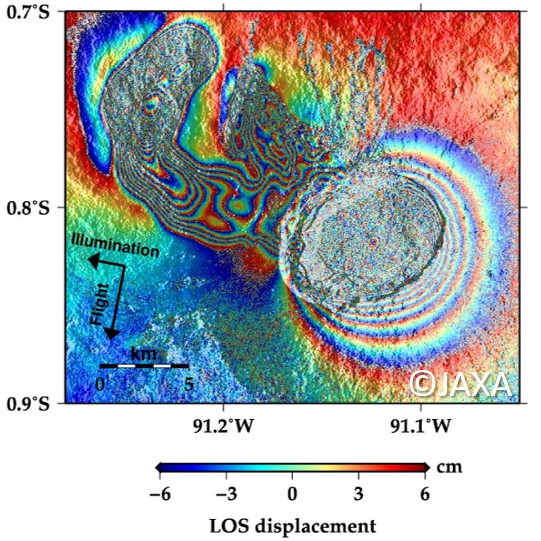
- JAXA has been observing the volcano by ALOS-2 (“DAICHI-2”) and captured the surface lowering in the crater and complex displacement in northwest side from the crater.
- ALOS-2 contributes to monitor volcanic activity regardless of clouds, volcanic plumes, and sun light.
Mt. Sierra Negra in Isabela Island, Galapagos has been erupting since June 26, 2018. JAXA has been observing the volcano using the Phased Array type L-band Synthetic Aperture Radar-2 (PALSAR-2) onboard the Advanced Land Observing Satellite-2 (ALOS-2, "DAICHI-2"). Table 1 summarizes the observation data by ALOS-2. Figure 1 shows the topography and the observation areas.
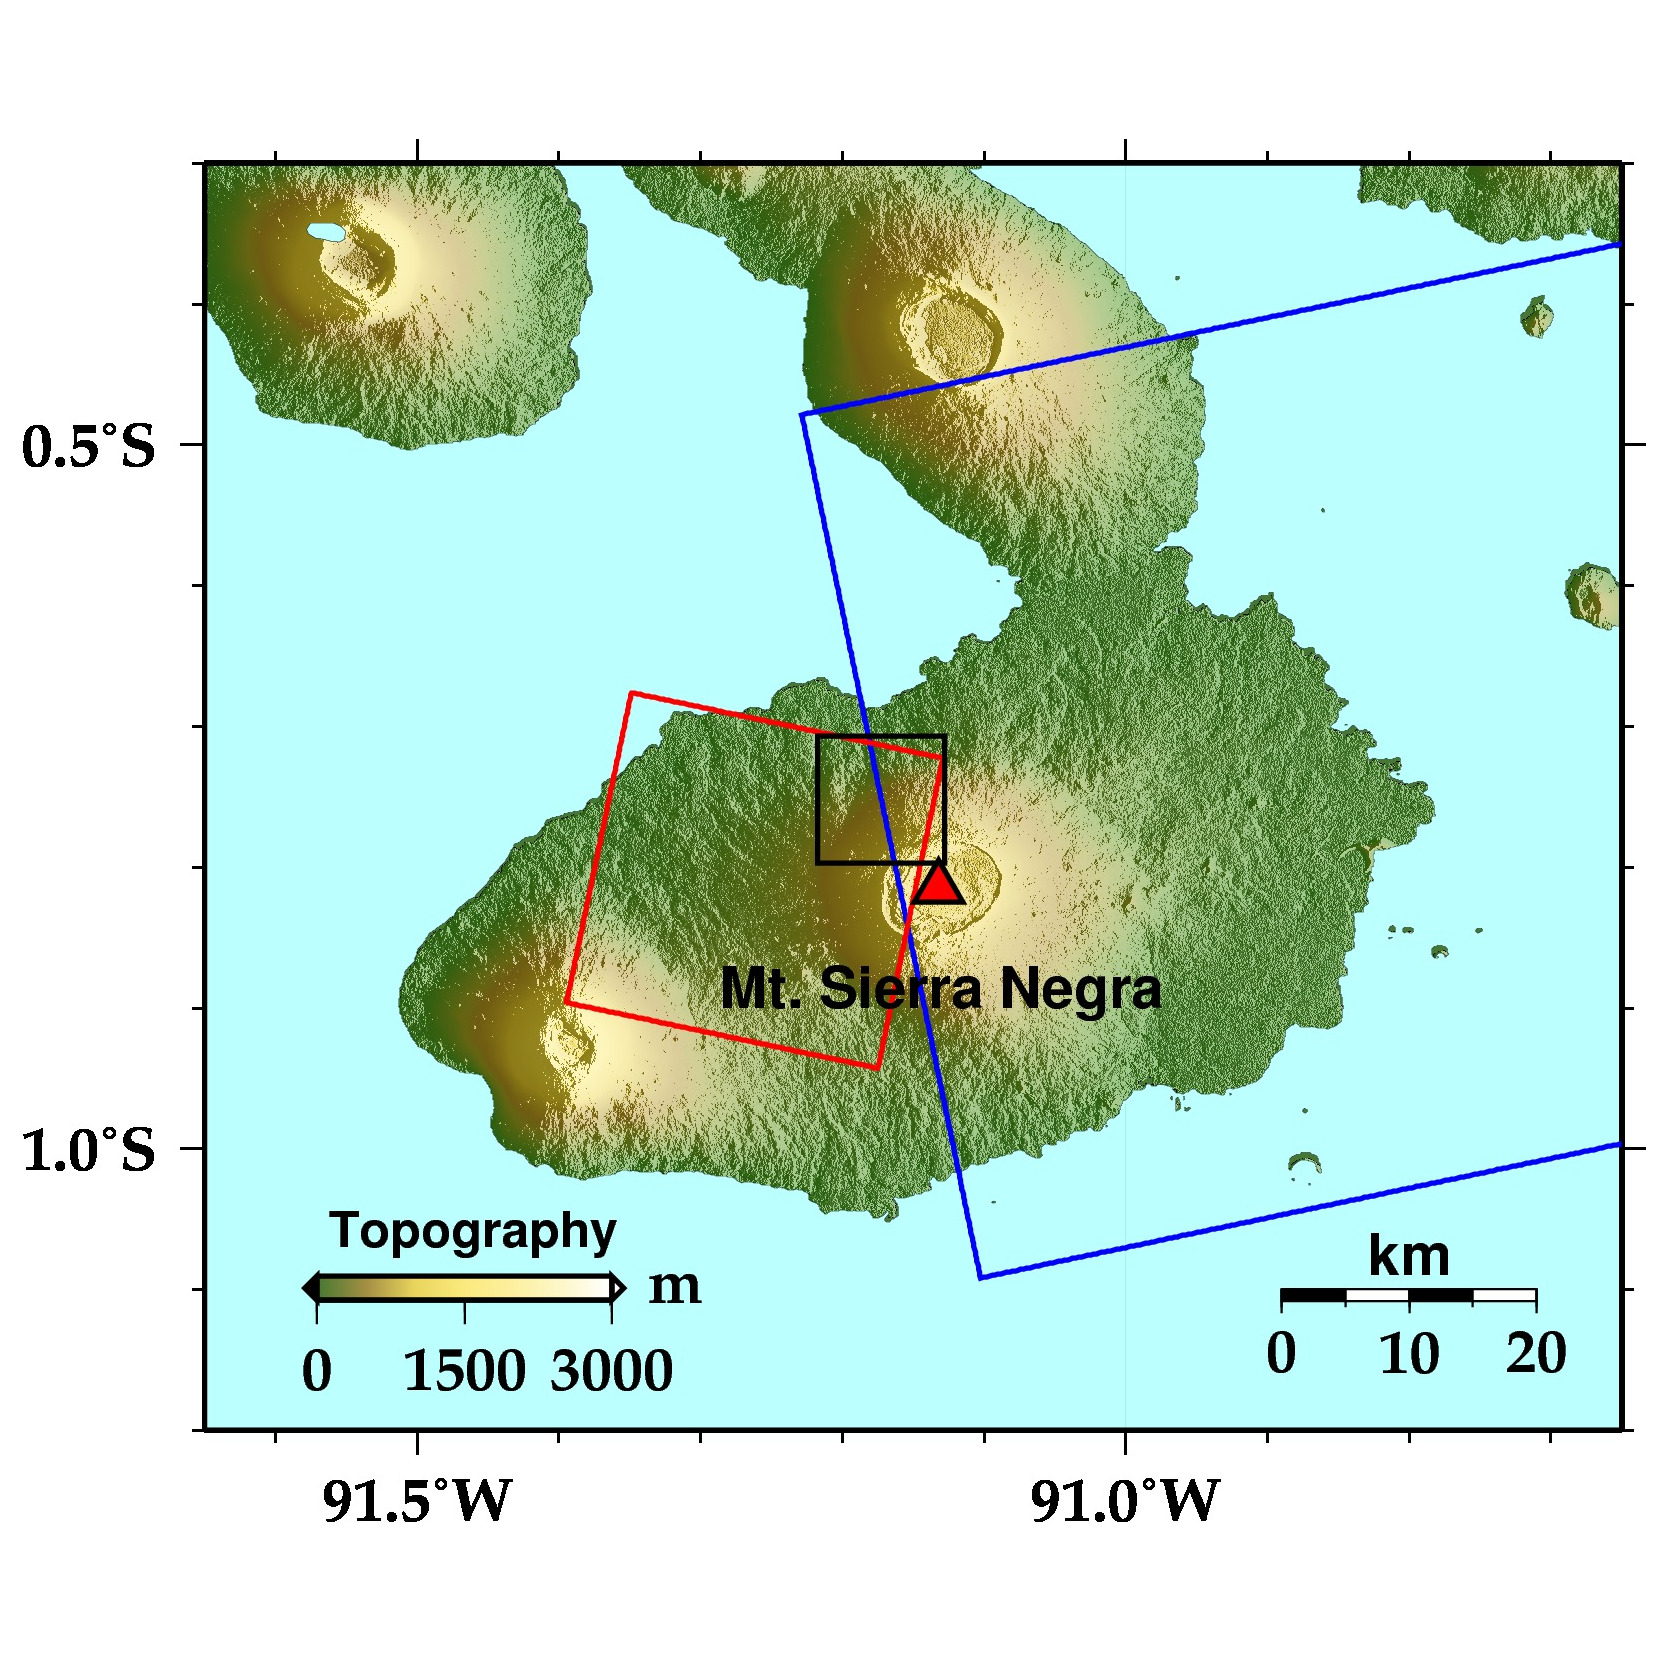
Fig. 1: Topography around Mt. Sierra Negra and the observation areas by ALOS-2. The blue rectangle shows the area by Stripmap modeand the red one does that by Spotlight mode. The black one shows the area shown in Fig. 7.
| Observation time (UTC) | Path number |
Orbit | Observation mode |
Polarization | Observation direction |
Beam number |
|
| ① | June 29, 2018 | 147 | Descending | ScanSAR | HH+HV | Right | W2 |
| ② | July 1, 2018 | 41 | Ascending | Stripmap 10m | HH+HV | Right | F2-7 |
| ③ | July 3, 2018 | 145 | Descending | Spotlight | HH | Right | - |
Figure 2 shows an interferogram using the ALOS-2 PALSAR-2 ScanSAR mode data acquired on June 29 and May 18, 2018. In this figure, subsidence inside the crater and complicate displacement in northwest side from the crater can be seen.
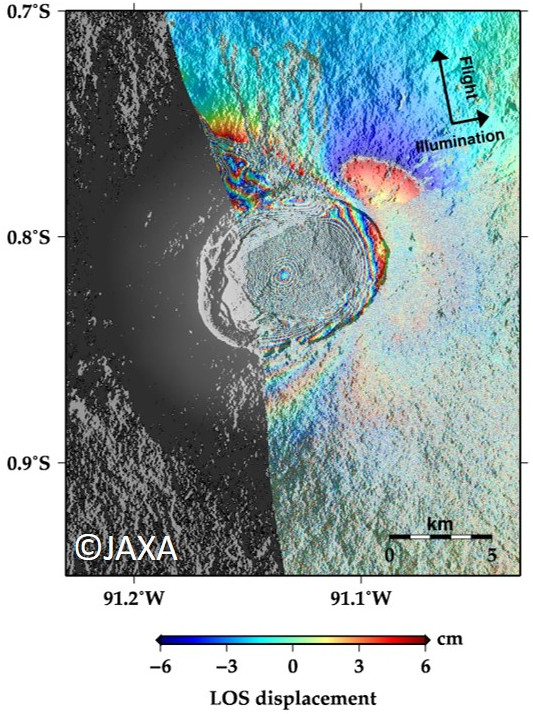
Figure 3 shows an interferogram using the ALOS-2 PALSAR-2 Stripmap (10 meters resolution) mode data acquired on July 1 and January 14, 2018. Similar displacement as figure 2 can be seen in this figure.
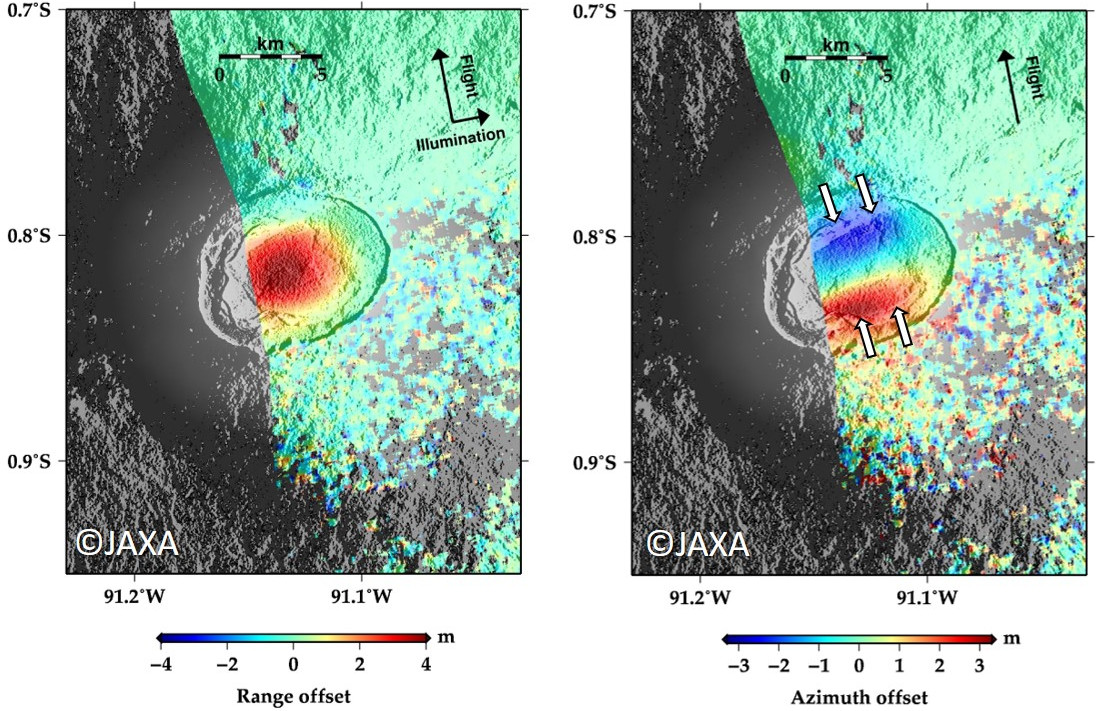
Figure 4 shows offset-tracking results using the same ALOS-2 PALSAR-2 Stripmap data acquired on July 1 and January 14, 2018. The offset-tracking technique is a robust method to detect localized large displacement along both range and azimuth direction. Subsidence about 4 m in the crater can be seen in range direction. Horizontal displacement about 3 m converging on the center of the crater can be seen in azimuth direction (arrows in the right panel).
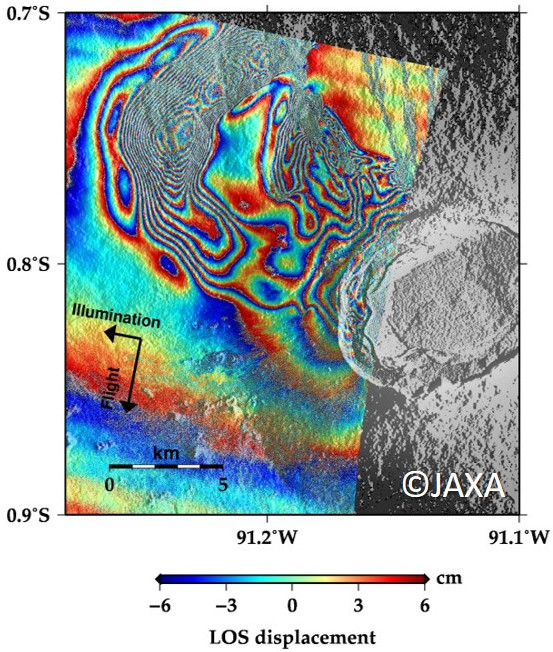
Figure 5 shows an interferogram using the ALOS-2 PALSAR-2 Spotlight mode data acquired on July 3 and June 5, 2018. Complex displacement around northwest side from the crater can be seen in this figure.
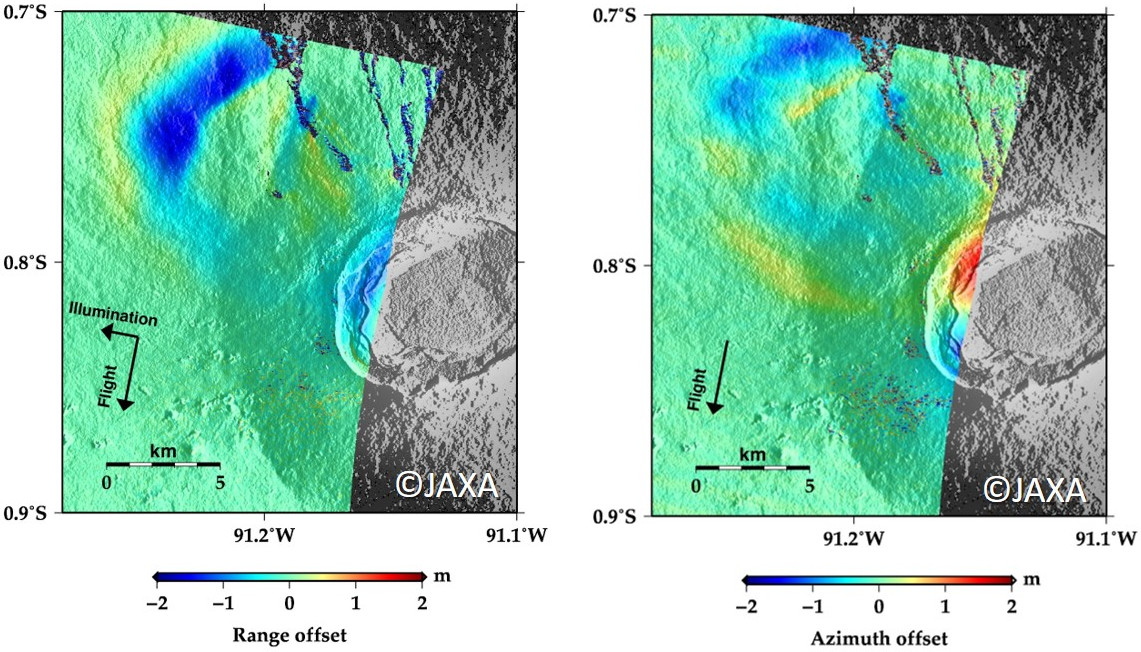
Figure 6 shows offset-tracking results using the same ALOS-2 PALSAR-2 Spotlight data used in Fig. 5. This figure also shows the displacement around northwest side from the crater, and in western rim in the crater.
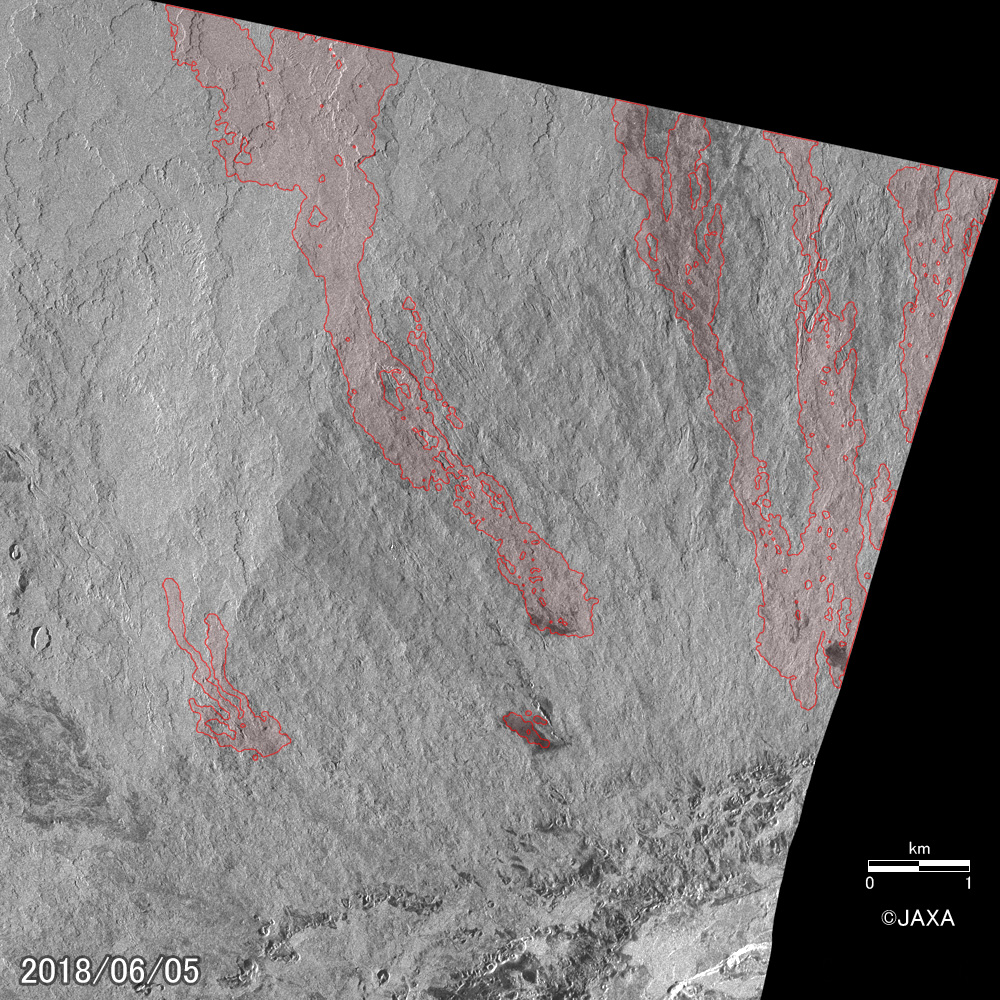
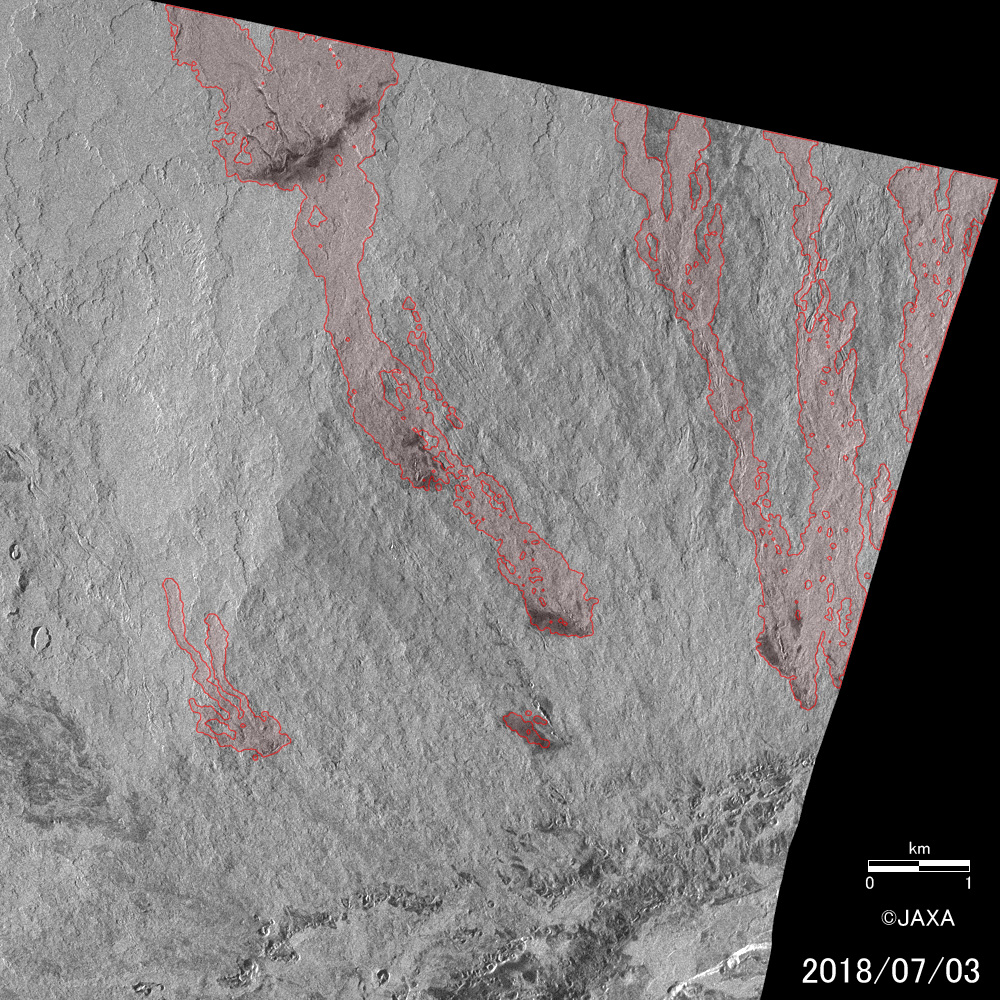
Figure 7 shows an interactive comparison of the same ALOS-2 PALSAR-2 Spotlight data used in Fig. 5 and 6. The areas changed between two areas are highlighted in red, and these areas are considered to be lava flows in northwest side from the crater.
Drag a slider over the image or click an arbitrary position in the images to compare the images.
Fig. 7: Interactive comparison of PALSAR-2 images on June 5 and July 3, 2018.
JAXA EORC
