Image Library
ALOS-2/PALSAR-2 Observation Results of Mt. Calbuco Volcano eruption in Chile (2)
Mt. Calbuco volcano in Chile explosively erupted during April 22 to 23, 2015 (local time). The Japan Aerospace Exploration Agency (JAXA) performed the second emergency observation with Phased Array Type L-band Synthetic Aperture Radar 2 (PALSAR-2) aboard Advanced Land Observing Satellite 2 (ALOS-2, "DAICHI-2") on April 29, 2015, 1:35 (local time; GMT-4). The observation geometry was same as the data acquired before the eruption (March 4, 2015), which enables us to extract the surface deformation by using interferometry technique.
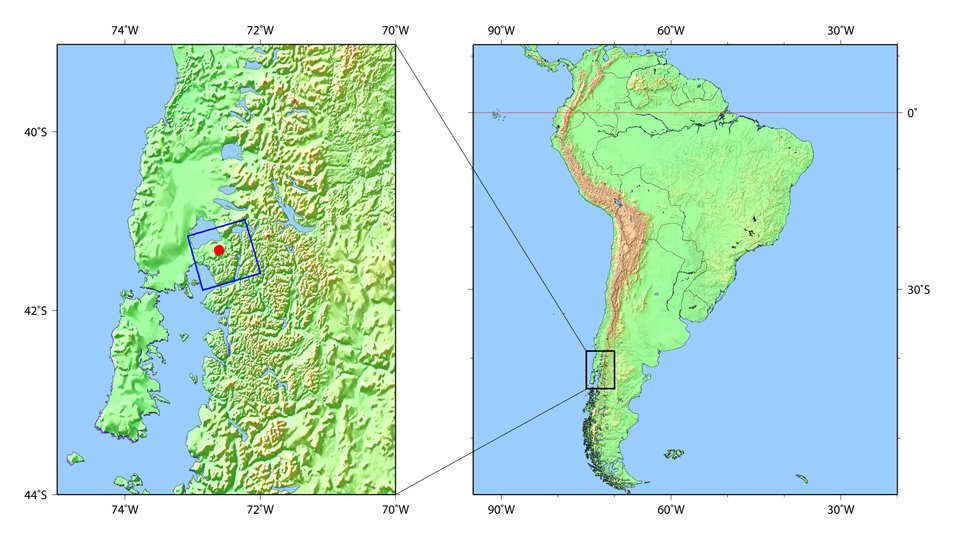
Fig.1: Observation area of the PALSAR-2 on April 29, 2015 (blue box).
Red point is the location of Mt. Calbuco.
Figure 1 and Figure 2 illustrates the observation area and the overall image. The observation mode was the high-resolution 10 m mode (dual polarization). The color composite in the image represents HH polarization in red, HV polarization in green, and HH/HV in blue. Different color in the image indicates different backscattering signals from the ground. Generally, black or dark blue show water or bare land, green shows volume scattering such as vegetation cover, and bright green or purple show urban areas.

Fig.2: The PALSAR-2 image over Mt. Calbuco volcano region taken on April 29. 2015.
Color composite of red: HH, blue: HV, green: HH/HV.
(Click to view enlarged image)
The left and right images of the Figure 3 are the enlarged images of the Mt. Calbuco after (April 29, 2015; the red box area in the Figure 2) and before the eruption (March 4, 2015). The images clearly showed that the shape of the mountain top changed and large craters appeared. The color of the image after the eruption looks generally darker than before around the mountain top (light blue circles). It means that the ground surface condition changed due to deposition of the volcanic product. The arrows in the Figure 3 indicate streaky traces probably due to volcanic ash or lahar (mud flow).

Fig.3: Enlarged images around Mt. Calbuco (the red box in the Figure 2).
(Left) April 29, 2015, (Right) March 4, 2015.
Both images were acquired with the high resolution 10 m mode (beam F2-5, off-nadir angle 28.2 degree)
(Click to view enlarged image)
Figure 4 is an interactive comparison of the before-and-after eruption images shown in Figure 3. To compare the images, drag a slider over the image to arbitrary position..It may not properly work on unsupported browsers.
Required browser: IE9 or later, Safari5.1 or later, Chrome, Firefox or Opera.
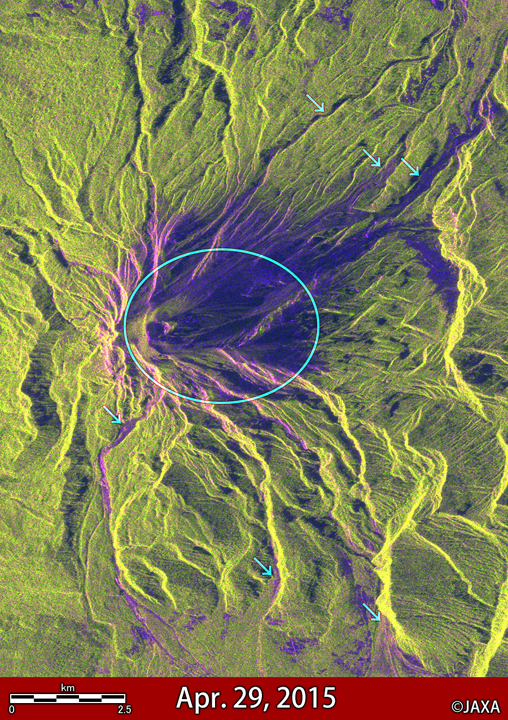
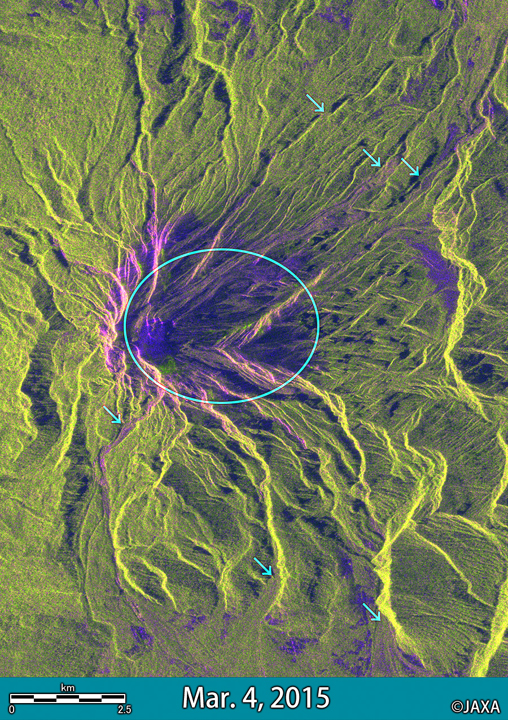
Fig.4: Interactive comparison of Mt. Calbuco observed before and after eruption
Figure 5 shows a differential interferometry (DInSAR) result derived from the observation data acquired before (Match 4) and after (April 29) the eruption. Approximately 10cm deformation away from the satellite is detected in the west region of the volcano (shown by arrow (1) in Figure. 5). This result indicates the possibility of deflation of underground magma source. Decorrelation (inability to detect deformations by the loss of similarity of the two data) is significant in the north-east of the volcano, probably due to ash accumulation and terrain changes associated with the eruption.

Fig.5: Differential interferogram over Mt. Calbuco.
(Click to view enlarged image)
See also
JAXA EORC