Image Library
Disaster area in Yogyakarta, Indonesia observed by PALSAR and AVNIR-2
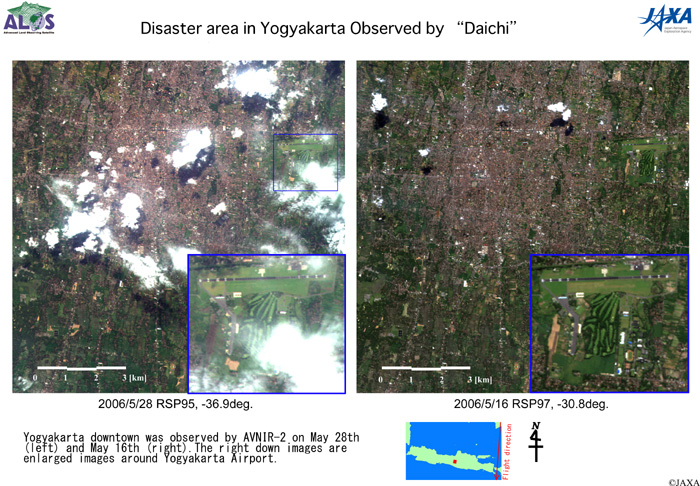
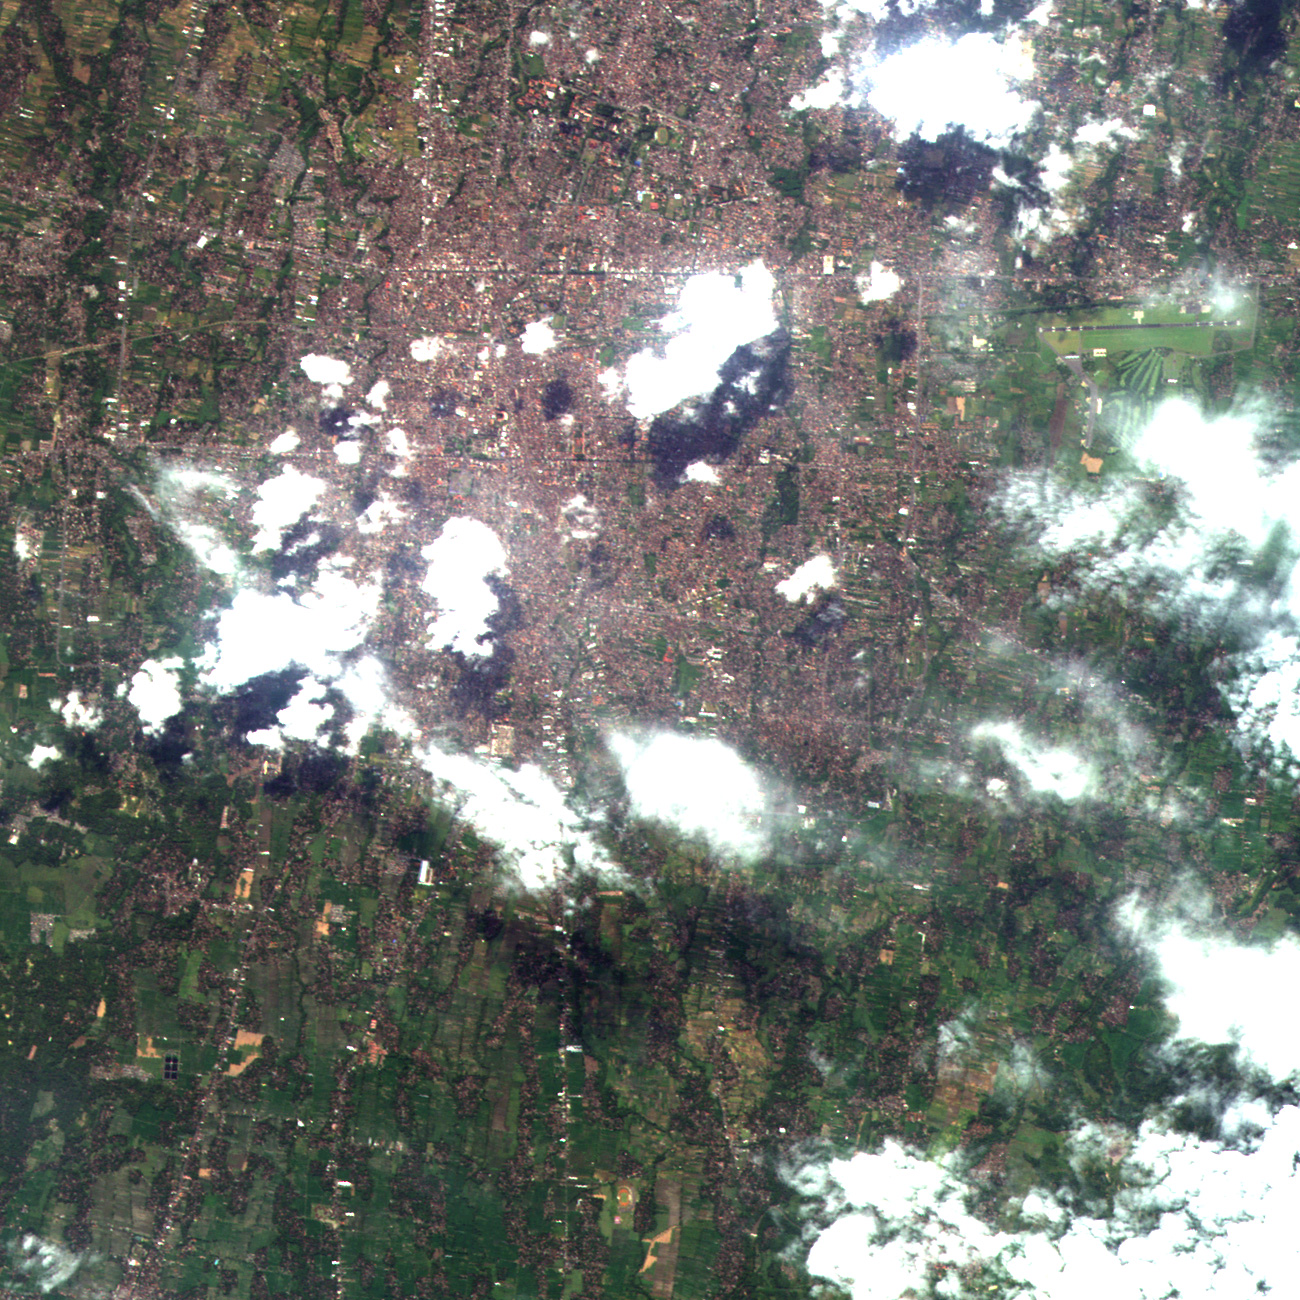
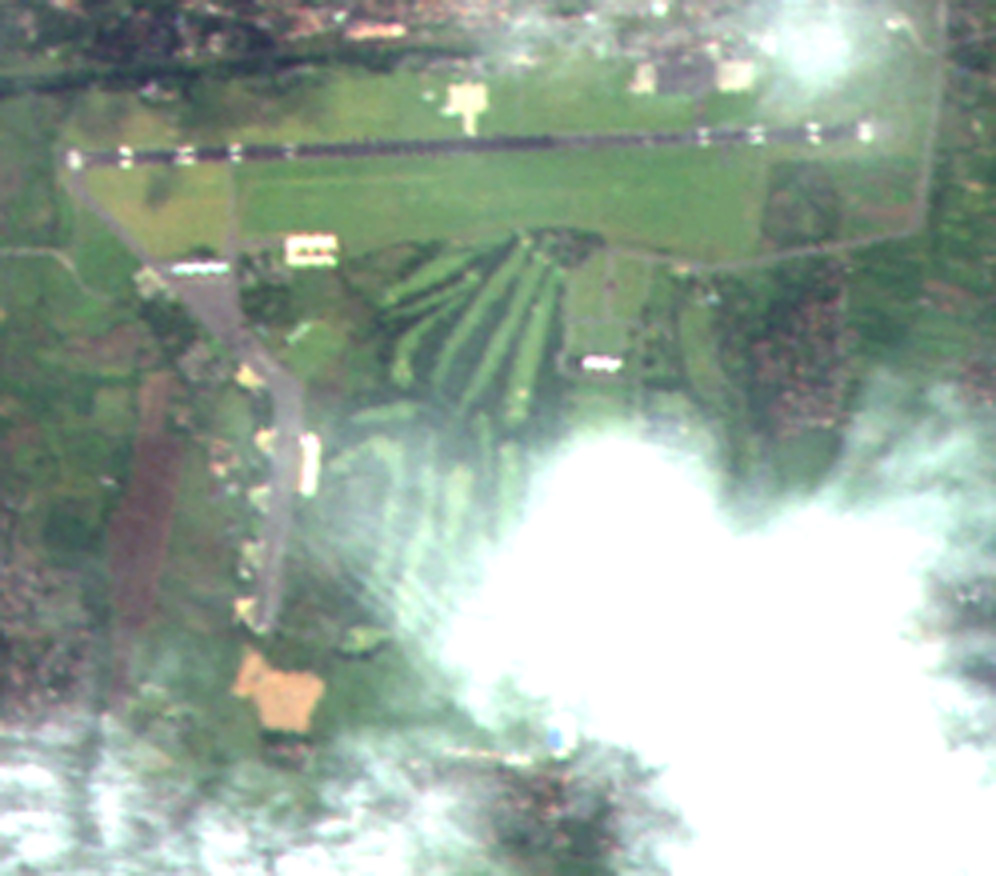
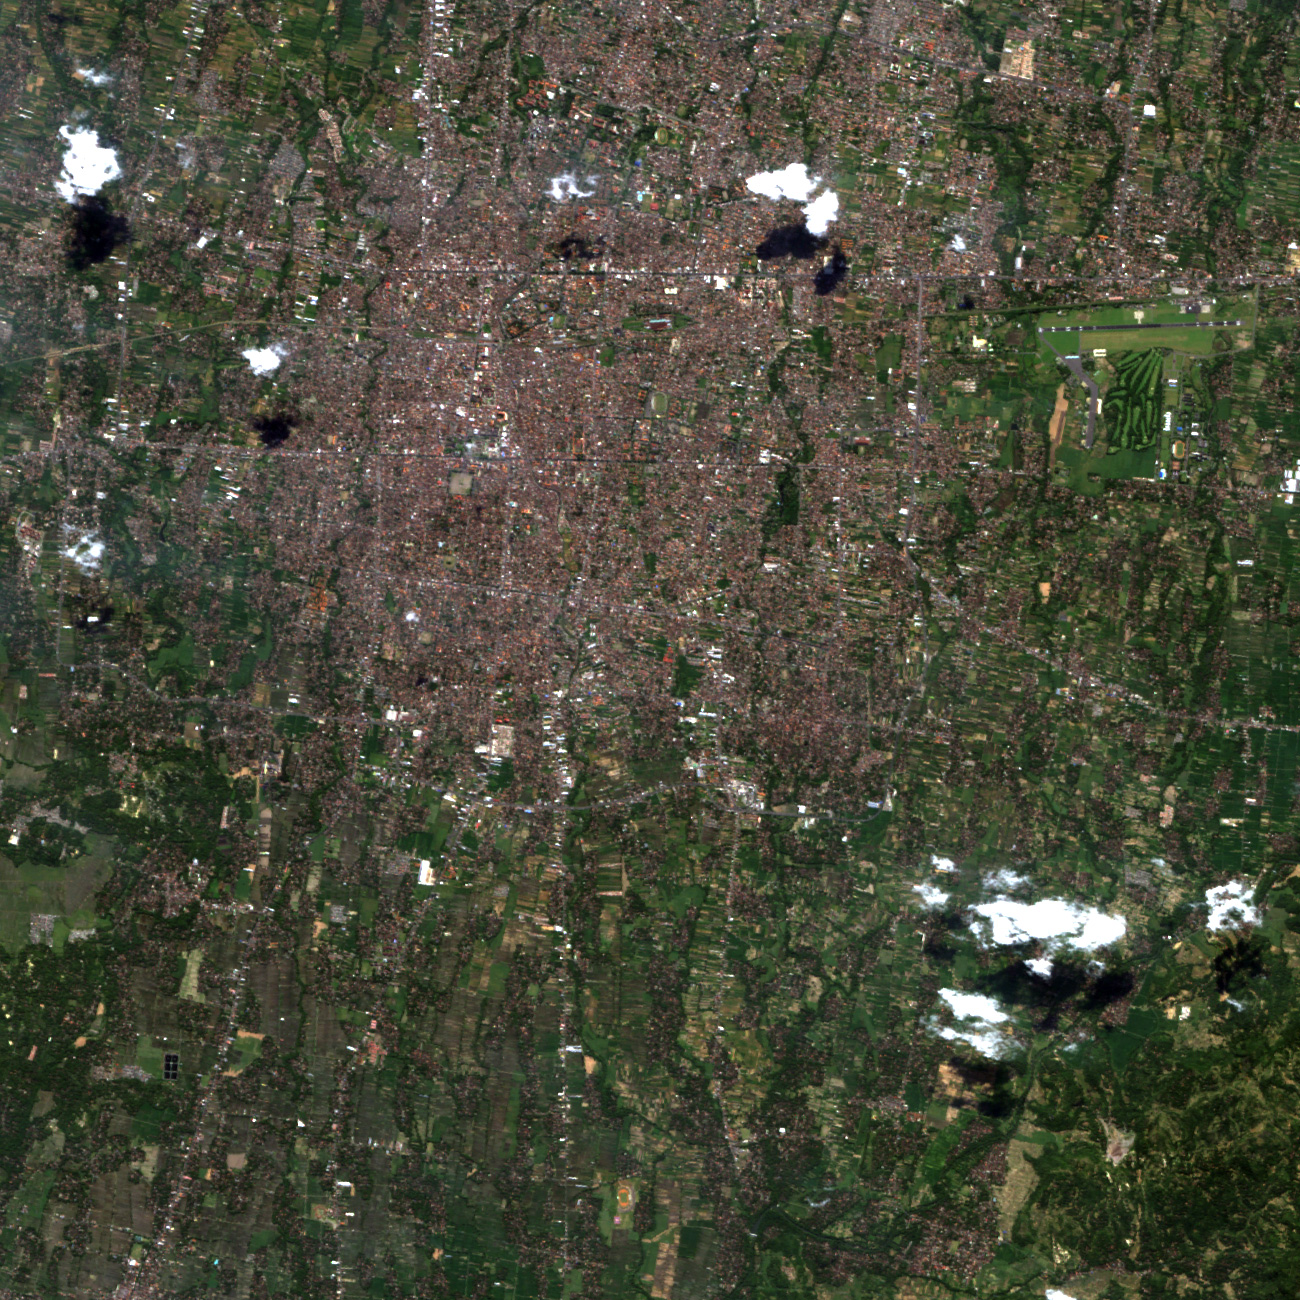
Figure 1 is a comparison of images around Yogyakarta taken by the Phased Array type L-band Synthetic Aperture Radar (PALSAR). The image on the bottom right was acquired at 11:40 a.m. on May 28 (Japan Standard Time, JST) and the upper right one was observed before the earthquake (May 16, this year, JST.)
Comparing the distribution of reflection strength (texture) of PALSAR radar waves before and after the earthquake (May 16, and 28 respectively), we confirmed that the reflection strength became weaker (or darker in the image) after the earthquake not only in the nearby area of the epicenter but all over the city area. (You can see a clearer difference especially in the area encircled in red.) In general, the strength distribution of radar reflection wave is bigger in city areas and smaller in forests.
The reduction of texture means that the earthquake was big enough to destroy artificial structures such as buildings.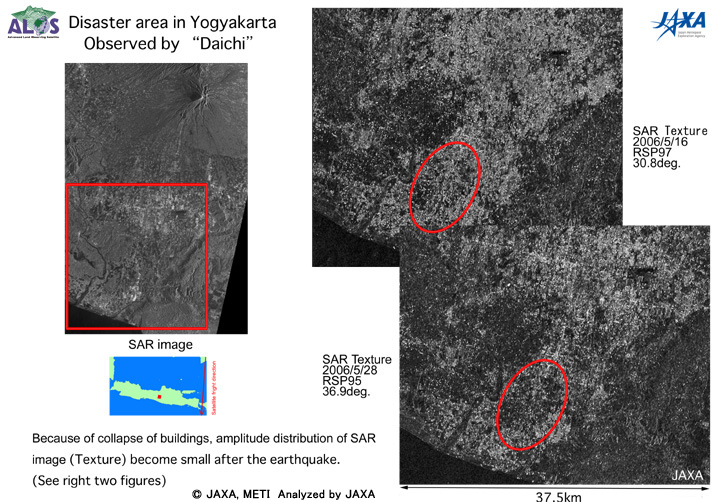
-
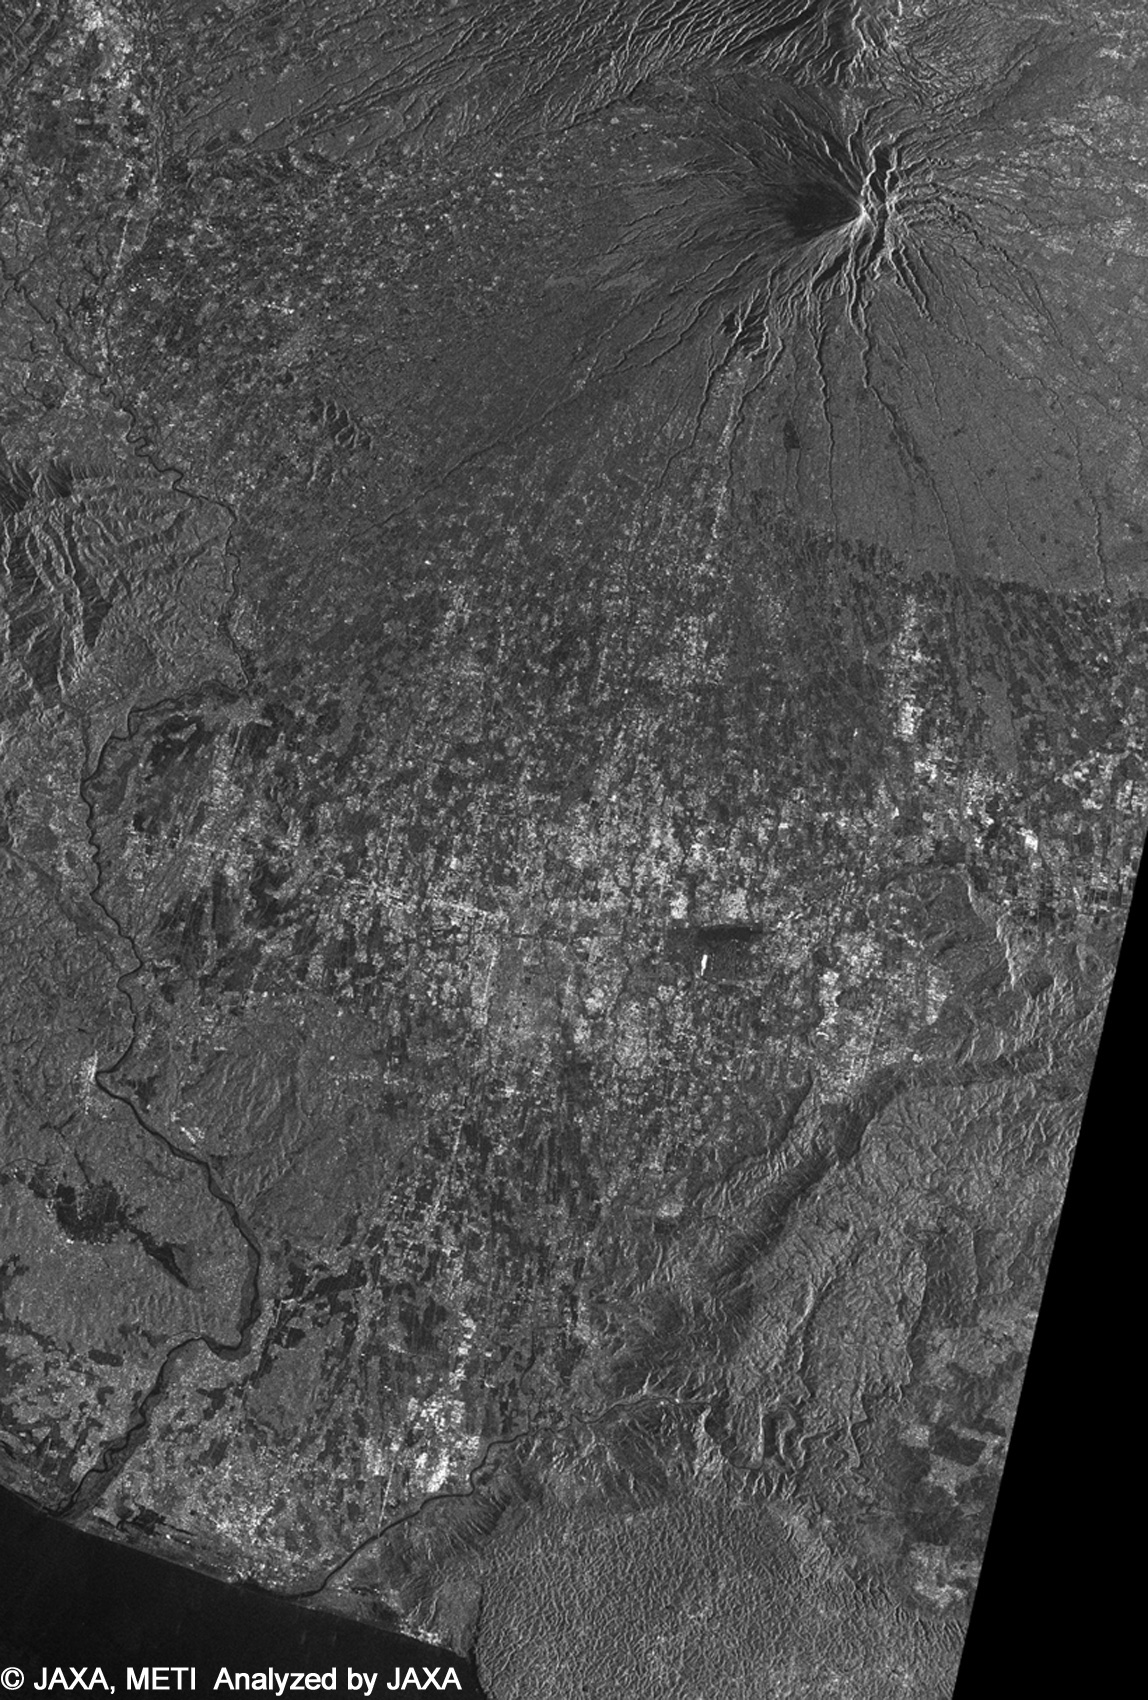 Fig 1:SAR image(Click to view enlarged image)
 -
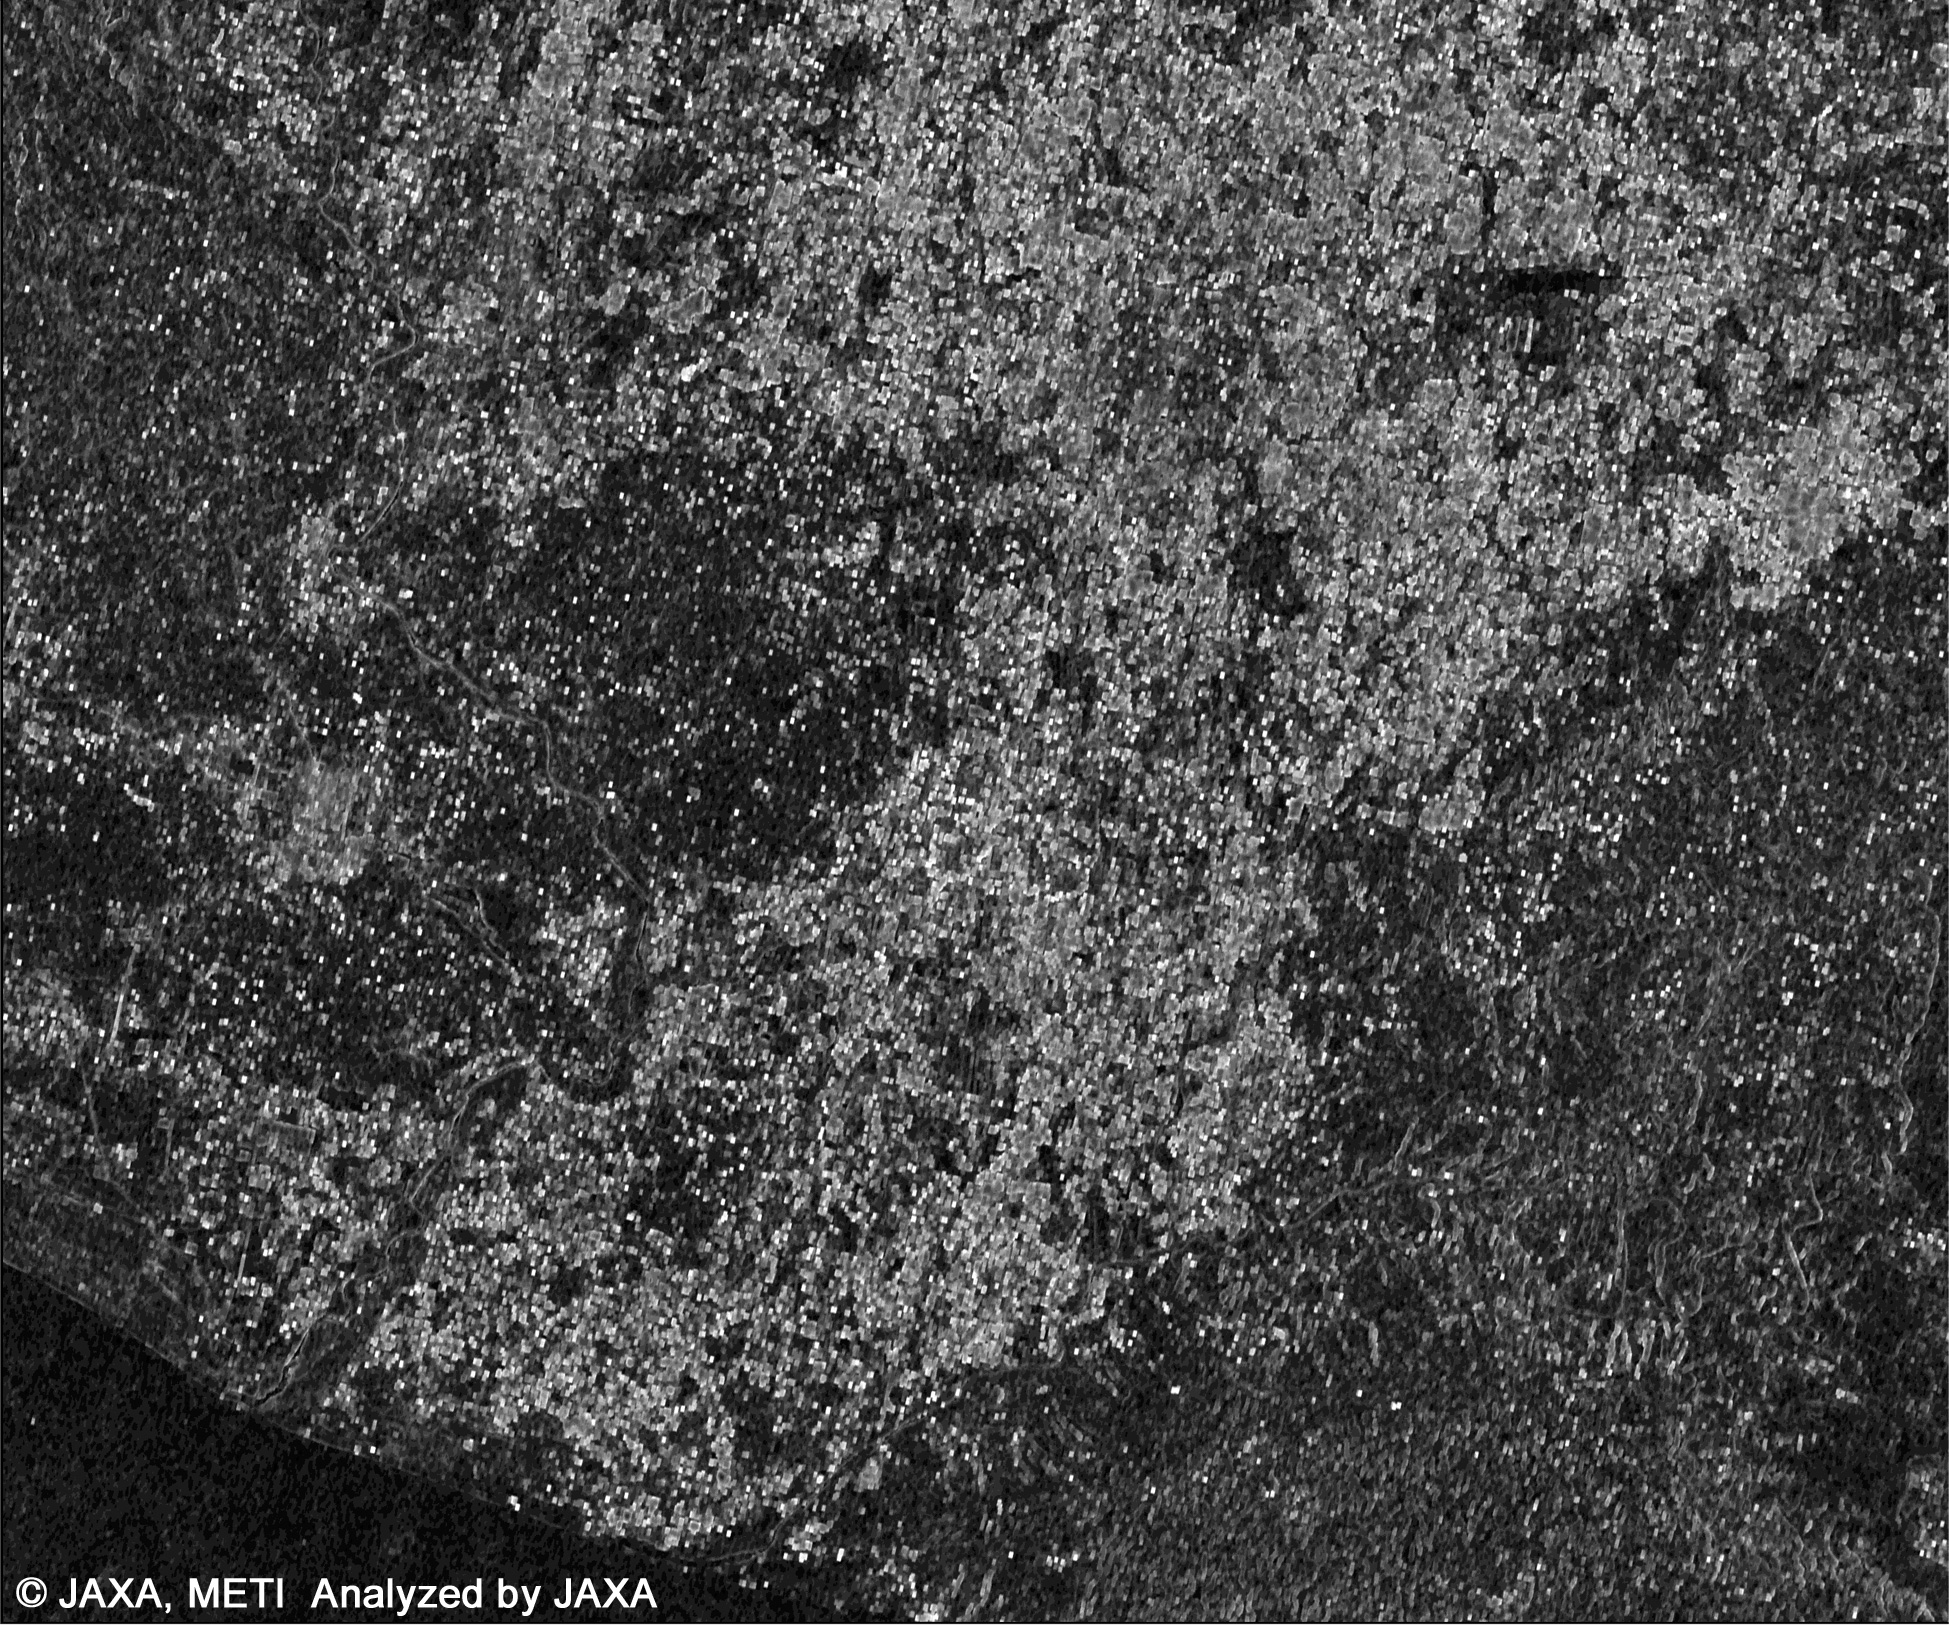 Fig 1:SAR texture 2006/5/16 RSP97 30.8deg.(Click to view enlarged image)
 -
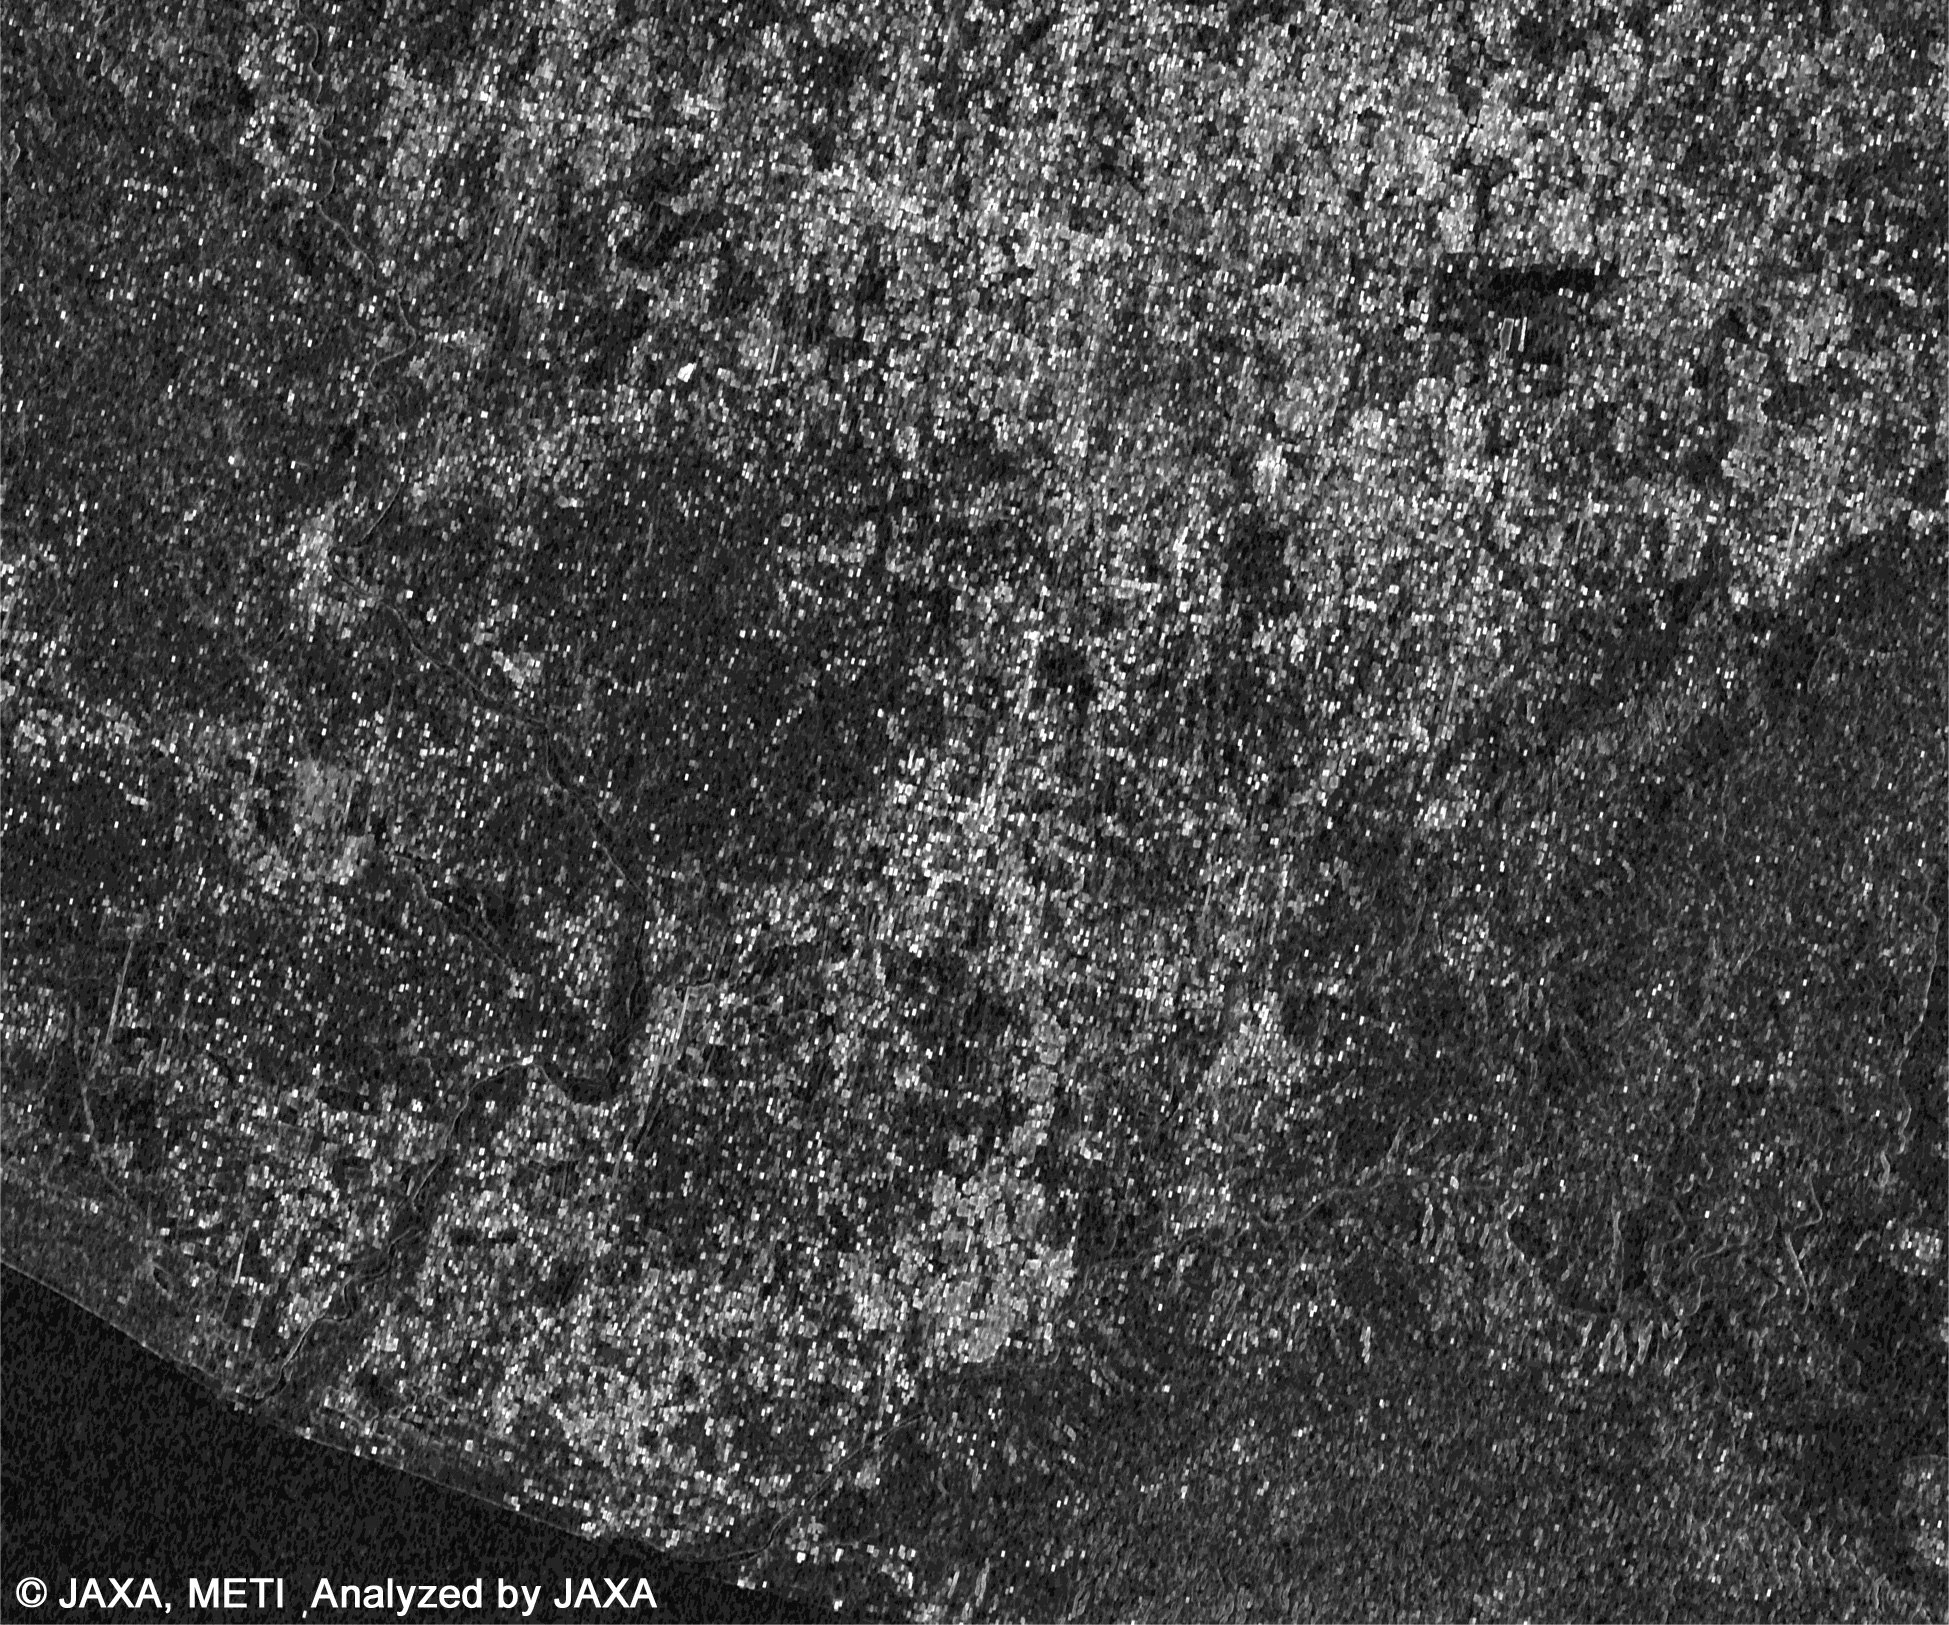 Fig 1:SAR texture 2006/5/28 RSP95 36.9deg.(Click to view enlarged image)