On 24th and 27th of Sep 2011, the Japan Aerospace Exploration Agency (hereinafter, JAXA) conducted observations of severe rain fall damage in the Kingdom of Thailand by using an airborne synthetic aperture radar (Pi-SAR-L: L-band polarimetric and interferometric synthetic aperture radar).
Thailand is currently experiencing the rainy season, and flooding has intermittently occurred since the middle of July. In addition to over 280 deaths due to the flooding, the Thai economy has experienced extensive agricultural and industrial damage.
The areas studied during these observations were the affected areas along the Chao Phraya River in the central Thai province of Chai Nat. Figure 1 shows the range of the observed area.
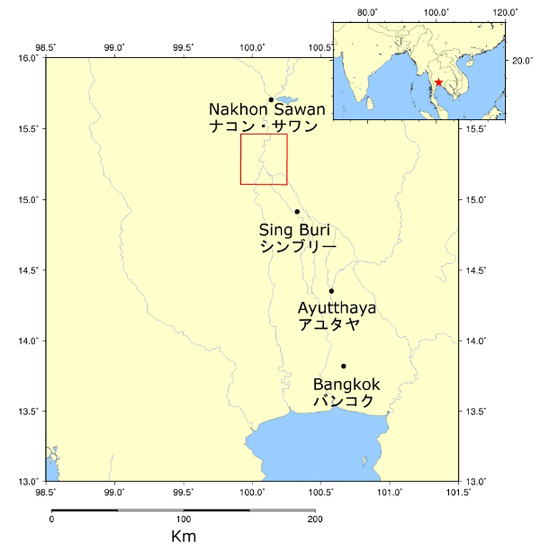
Fig.1: Location of Observation Area
The red square shows the Pi-SAR-L observation area.
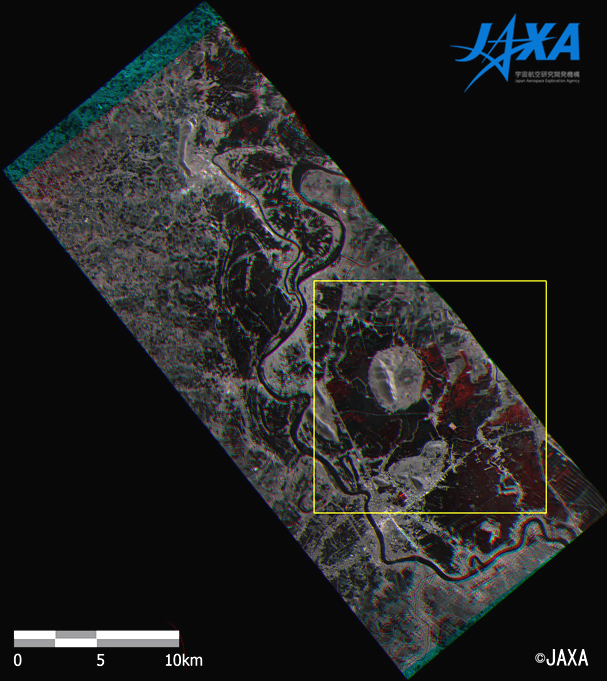
Fig.2: Change-detection image of water-damaged areas taken by Pi-SAR-L at Sep 24th and Sep 27th.
Figure 2 is a change-detection image obtained by Pi-SAR-L, showing the Chai Nat province and its vicinity. The image has been color composited with observations made from Sep 24th and Sep 27th. Red color is assigned for Sep 24th observation data and green/blue color are assigned for Sep 27th observation data. The regions appearing red were the ones that were flooded from Sep 24th to Sep 27th. Figures 3 and 4 below show enlarged images of the region enclosed in the yellow square.
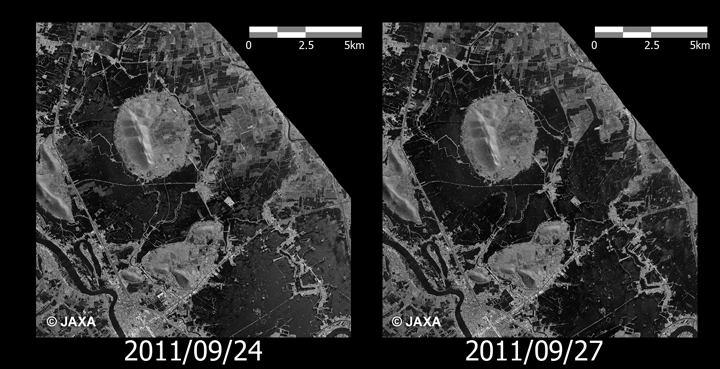
Fig.3: Enlarged images of the Wat Sing district, Chai Nat province,, enclosed by the yellow square in Figure 2
(Left: on Sep 24th, 2011 / Right: on Sep 27th, 2011)
(Click to View Enlarged Image)
Figure 3 shows the two images of the eastern side of Wat Sing district, Chai Nat province enclosed by the yellow square in Figure 2, and these images were obtained on Sep 24th and Sep 27th. The dark colored portions show flooded areas, and the images show that the sizes of these areas increased (the darkly colored portions increased) from Sep 24th through Sep 27th.
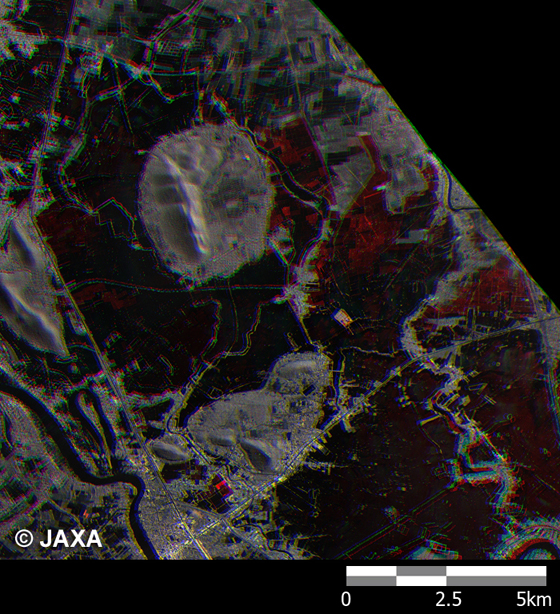
Fig.4: Composite image of Wat Sing district, Chai Nat province showing the enlarged yellow square enclosed area
(Click to View Enlarged Image)
Figure 4 shows the area enclosed by the yellow square in Figure 2, and as done in Figure 1, the image has been color composited with observations on Sep 24th appearing red and observations on Sep 27th appearing green/blue. It can be seen that from Sep 24th through 27th, the size of the flooded area (shown as red in Figure 4) increased. Furthermore, the flooded areas can be identified more clearly using this image than by using Figure 3 because these regions appear red.
This year, by using earth observation data from satellites and aircraft, such as ALOS L-band synthetic-aperture-radar (PALSAR), JAXA engaged in collaborative research with Thailand's GISTDA (Geo-Informatics and Space Technology Development Agency) that focused on three topics: flooding, coastal erosion monitoring, and rice yield estimation. The observations and analyses of severe rain fall damage presented herein were performed as part of the collaborative research.
JAXA plans to continue the joint research with GISTDA and utilize the findings from this project for future missions, including the Advanced Land Observing Satellite-2 (ALOS-2).
© JAXA EORC
Copyright©1997- JAXA EORC All rights reserved.