Dataset
IPY Dataset
What's NEW
| May 30, 2011 | The Arctic Pole of PALSAR 500m Browse Mosaic Product (CYCLE42) were added. |
| May 18, 2011 | The Antarctica of PALSAR 500m Browse Mosaic Product (CYCLE41) were added. |
| Mar. 7, 2011 | The Antarctica of PALSAR 500m Browse Mosaic Product (CYCLE40) were added. |
| Jan. 19, 2011 | The Antarctica and Arctic Pole of PALSAR 500m Browse Mosaic Product (CYCLE39) were added. |
| Dec. 10, 2010 | The Antarctica of PALSAR 500m Browse Mosaic Product (CYCLE38) were added. |
| Nov. 12, 2010 | The Antarctica of PALSAR 500m Browse Mosaic Product (CYCLE37) were added. |
| Nov. 5, 2010 | The Antarctica of PALSAR 500m Browse Mosaic Product (CYCLE36) were added. |
| Oct. 29, 2010 | The Antarctica and Arctic Pole of PALSAR 500m Browse Mosaic Product (CYCLE35) were added. |
| Oct. 22, 2010 | The Antarctica and Arctic Pole of PALSAR 500m Browse Mosaic Product (CYCLE34) were added. |
| Oct. 15, 2010 | The Antarctica of PALSAR 500m Browse Mosaic Product (CYCLE33) were added. |
| Mar. 16, 2010 | The Antarctica of PALSAR 500m Browse Mosaic Product (CYCLE32) were added. |
| Feb. 9, 2010 | The Antarctica and Arctic Pole of PALSAR 500m Browse Mosaic Product (CYCLE31) were added. |
| Dec. 14, 2009 | The Antarctica of PALSAR 500m Browse Mosaic Product (CYCLE30) were added. |
| Oct. 29, 2009 | The Antarctica of PALSAR 500m Browse Mosaic Product (CYCLE29) were added. |
| Oct. 20, 2009 | The Antarctica of PALSAR 500m Browse Mosaic Product (CYCLE26~28) were added. |
| Apr. 24, 2009 | The Antarctica (CYCLE22~24) and Arctic Pole (CYCLE23, 24) of PALSAR 500m Browse Mosaic Product were added. |
| Dec. 11, 2008 | The Antarctica of PALSAR 500m Browse Mosaic Product (CYCLE21) were added. |
| Sep. 17, 2008 | The Antarctica of PALSAR 500m Browse Mosaic Product(CYCLE20) were added. |
| Aug. 18, 2008 | The Antarctica of PALSAR 500m Browse Mosaic Product(CYCLE19) were added. |
| Jul. 14, 2008 | The Antarctica of PALSAR 500m Browse Mosaic Product(CYCLE18) were added. |
| Aug. 18, 2008 | IPY Dataset Homepage was opened. |
Monitoring the north and south polar regions using the ALOS/PALSAR (International Polar Year)
International Polar Year (IPY) , focusing on the north and south polar regions, is defined to investigate the impact of the ice sheet change on the ocean and climate changes on the habitats in the these regions as the collaborative works over sixty countries for two years from March 1 2007 to March 1 2009. To this goal, world space agencies, i.e., Japan Aerospace Exploration Agency, JAXA, National Aeronautics and Space Administration (NASA), European Space Agency (ESA), Canadian Space Agency (CSA), are observing these regions intensively using their own earth observation satellites. Especially, the JAXA observes the polar regions systematically two to three times a year frequency, using three sensors (PRIMS, AVNIR-2, PALSAR) onboard ALOS, and intends to detect the ice sheet decrease and its timely changes. Since PALSAR is able to observe these regions in dependently the day-night condition nor the weather condition, automatic processing using the high speed computer, browse images and the large scale mosaic with the resolution of 500m can be generated within several days after the data acquisition. By now, we have produced several datasets for these regions. We are now opening the web to the users. This allows the global mosaic for these two Polar Regions every 46 days, and the long-term comparison can detect the change of the ice sheet and the land cover.
While the Synthetic Aperture radar (SAR) is the all weather sensor and is very powerful for observing the earth, the unfocused data (raw data) has only the resolution of 20km x 5 km. Features that the SAR raw signal is modulated by the relative motion between the SAR and the earth surface, enables the compression of the raw data to the resolution of 10m or so. This high resolution processing takes several minutes for 70km x 70km size area and full processing of the all the data acquired by the PALSAR of 1000 scenes to 1500 scenes needs the extra powerful processing system. JAXA/EORC recently developed a new processing algorithm that has 10 times faster processing speed with less resolution of 70 m, and succeeded to quick processing of all the PALSAR data, which are daily received. This enables the imaging of all the PALSAR data and allows the detection of the global earth change. It is very helpful to capture the temporal change of the wide regions in the north and south Polar Regions. This type of low resolution but fast processing image is called as high-speed quick look image or simply browse image.
In the following, we will introduce the browse mosaics in the south polar and north polar regions and green land and their temporal changes.1. Antarctica
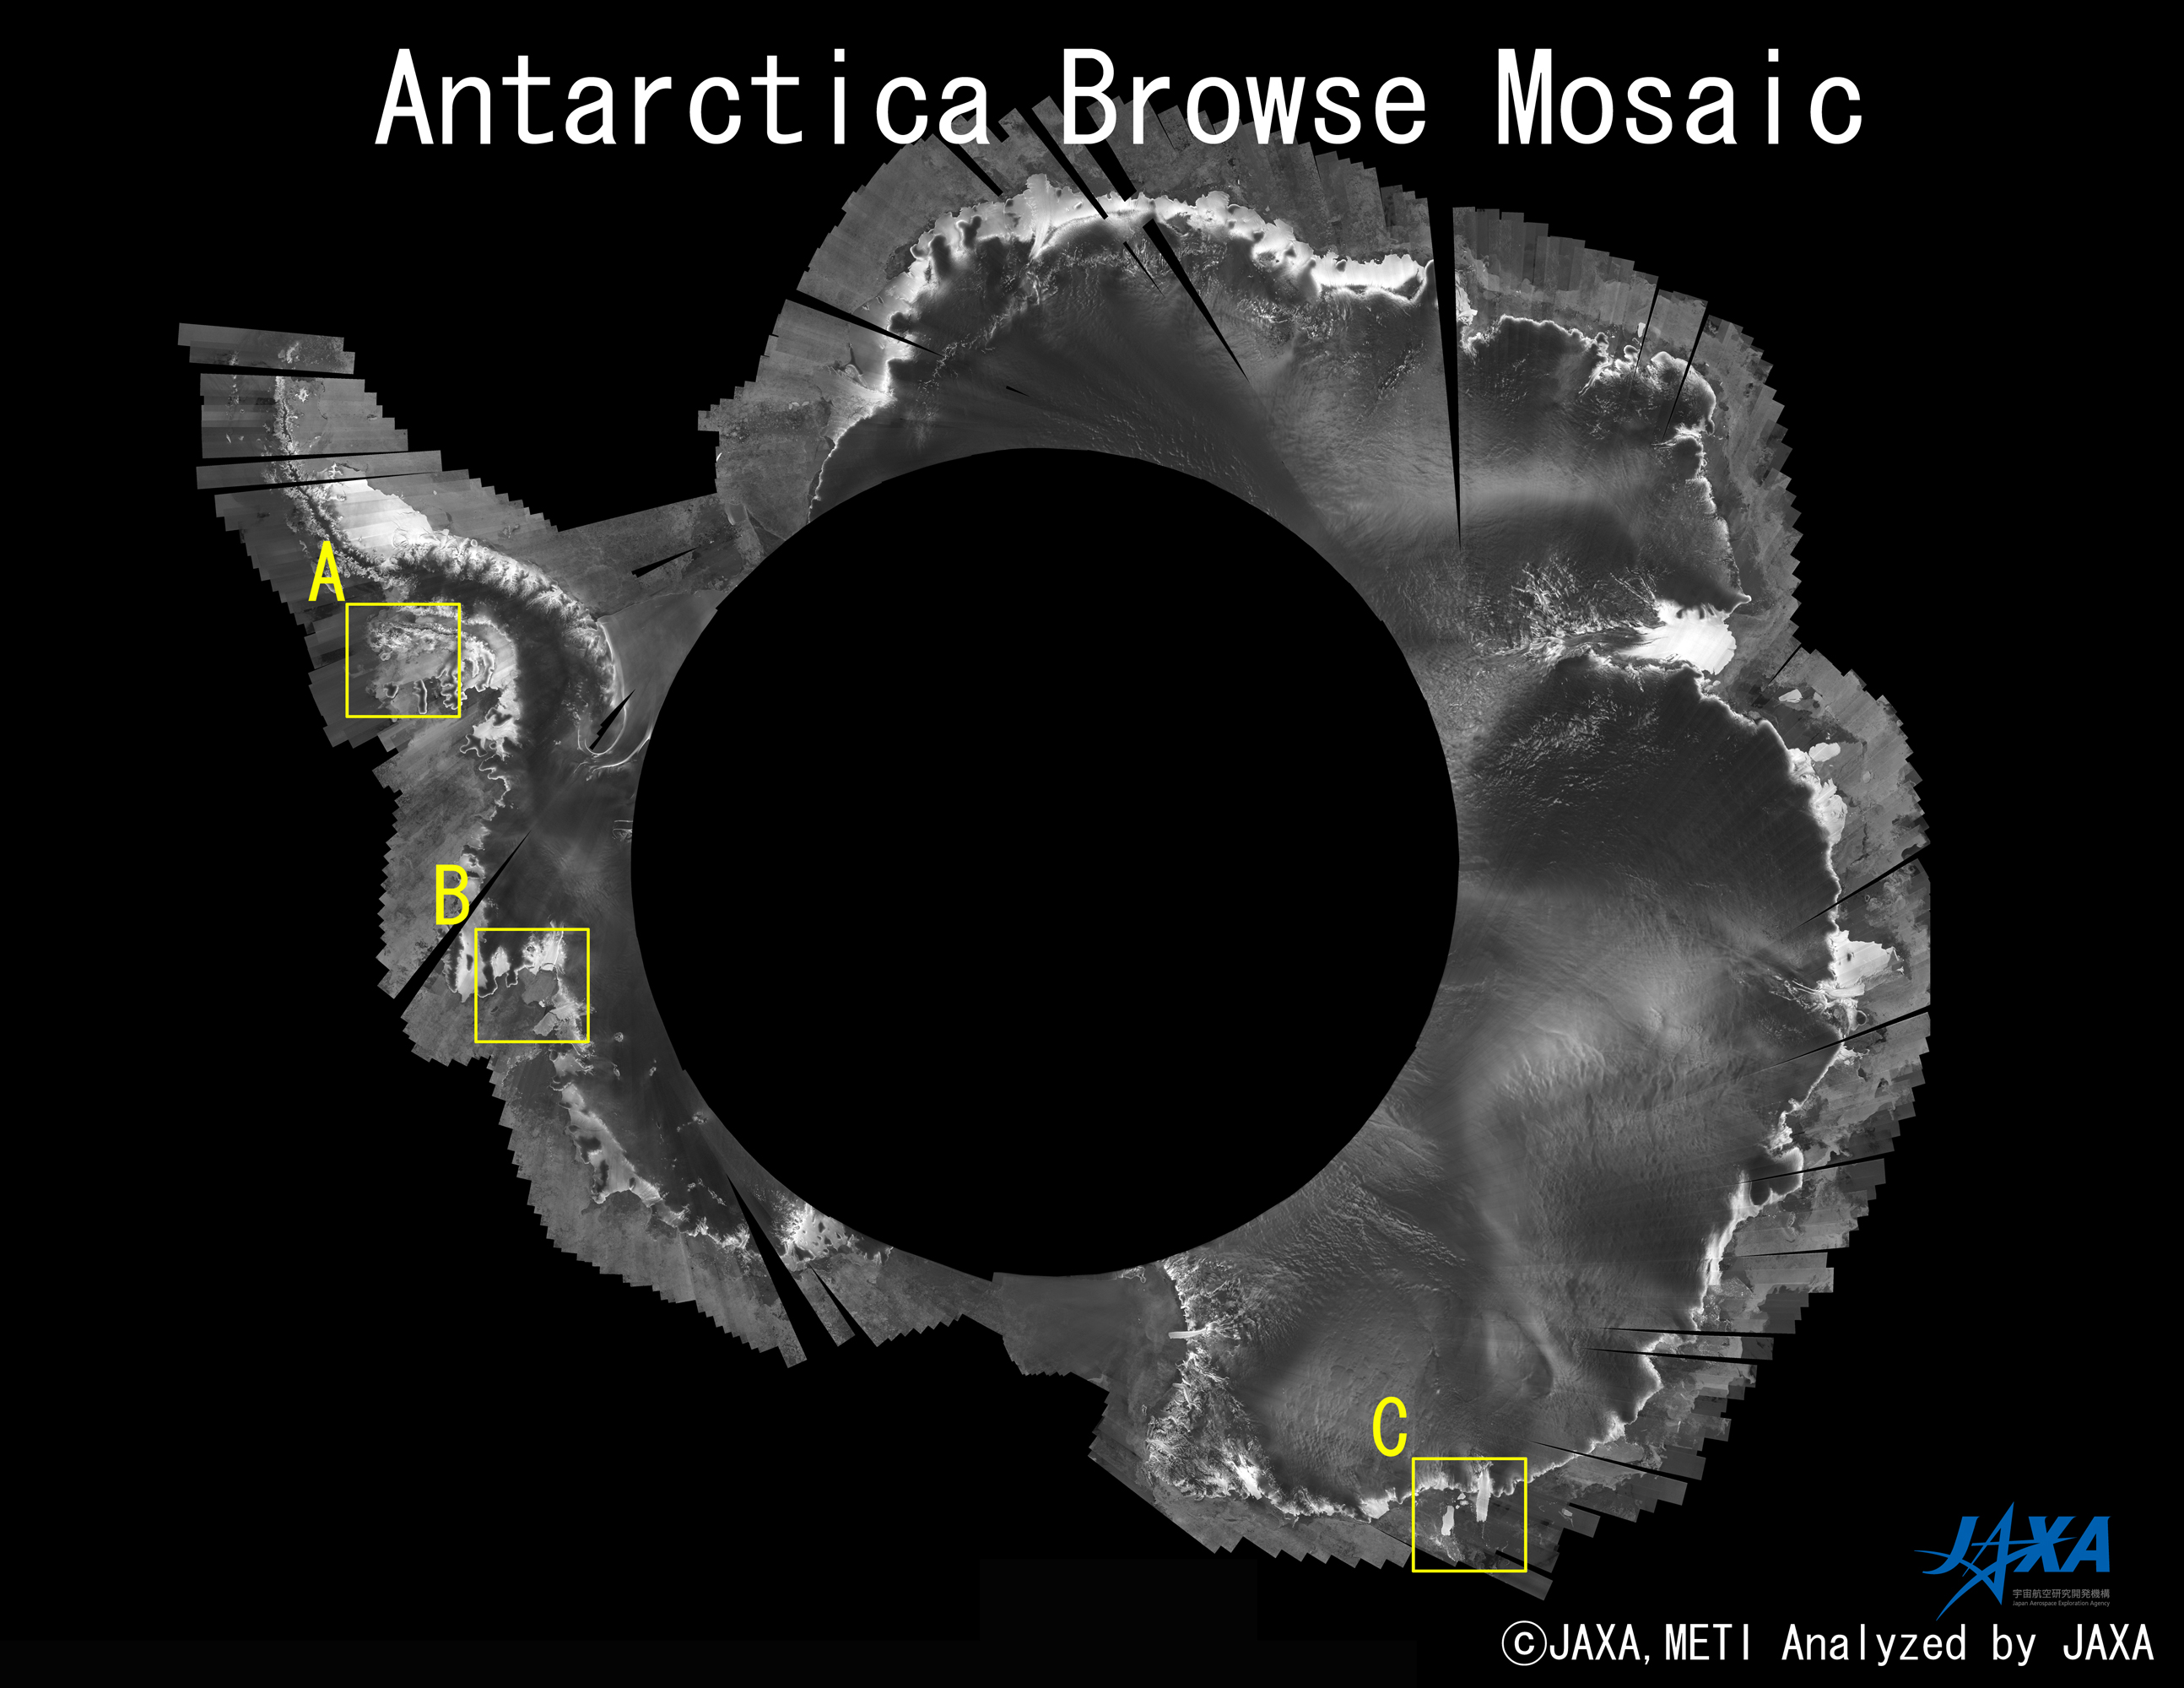
(Click to View Enlarged Image)
1.1 Image comparison
Area A (Near Alexander Island):
One of the largely moving area at the root of the Antarctica peninsula. This figure shows the winter, summer and winter, from Aug. 2007 to June 2008. Comparison between two summers depicts the ice sheet decrease in the region 1 and 2. Summer image of Jan. 2008 looks dark. This is because the surface if the ice sheet becomes smooth and radar backscatter decreased.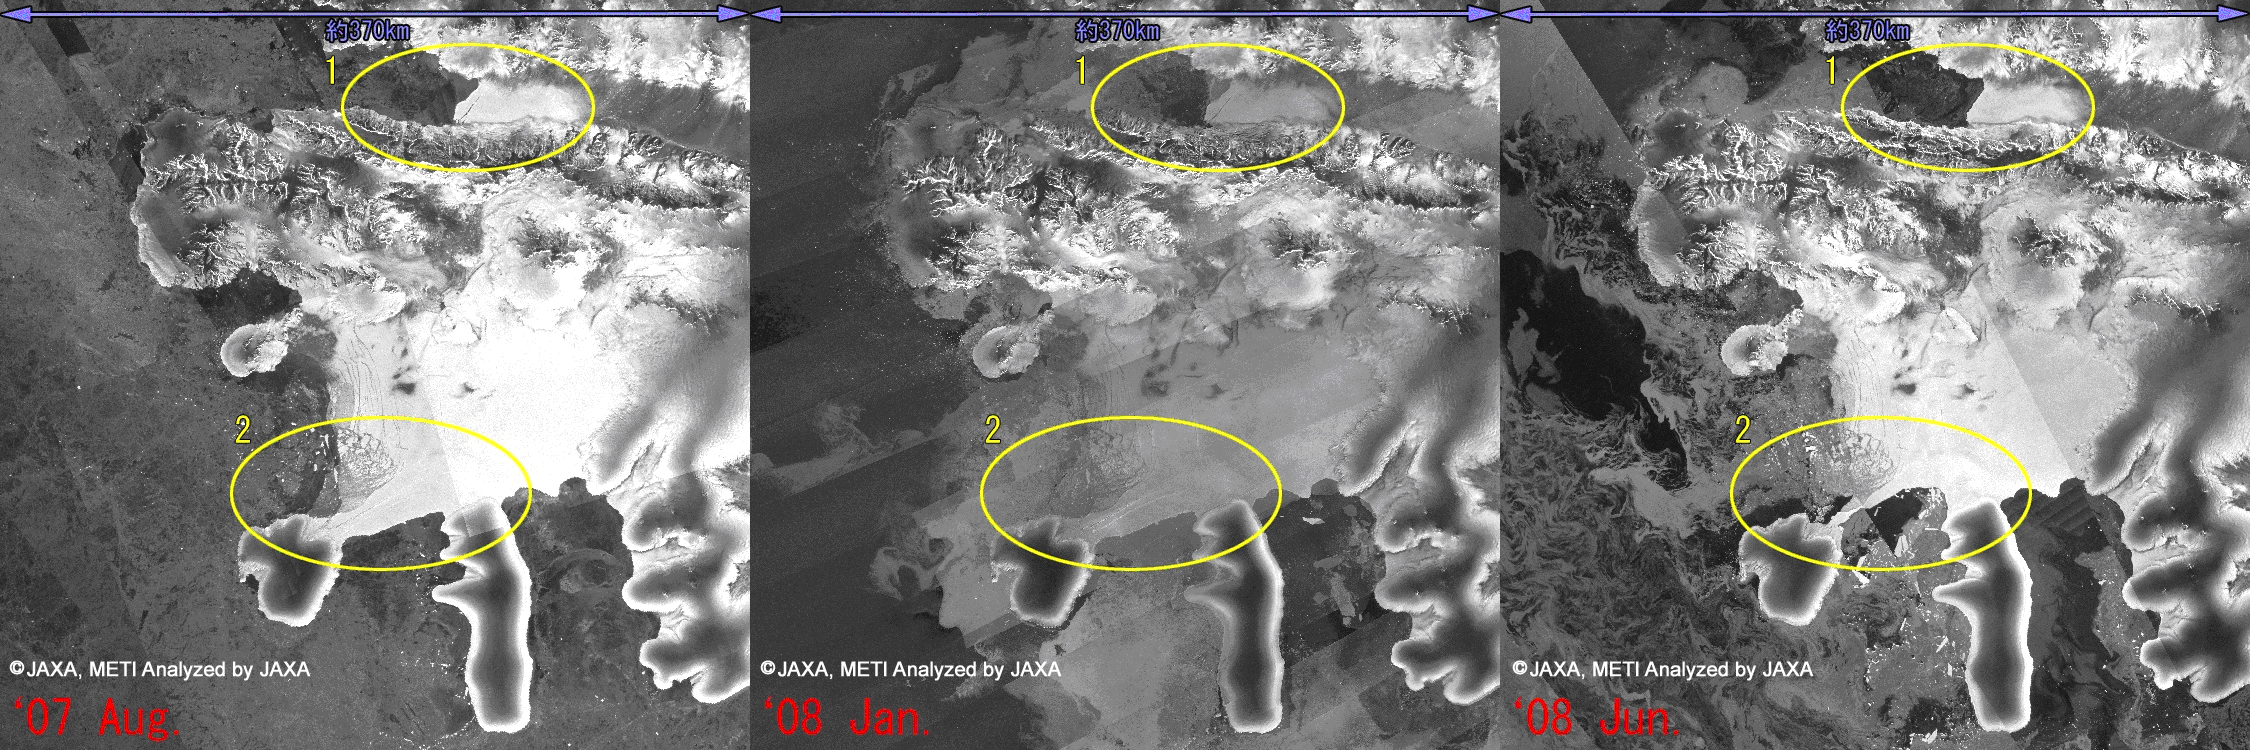
(Click to View Enlarged Image)
Area B (Near King Peninsula):
This figure shows the changes at the coastal region of the pine island glacier located at the root of the Antarctica peninsula. During a year, ice cracked down and moved to the off coast in the region 1. Region 2 also shows the ice sheet floating.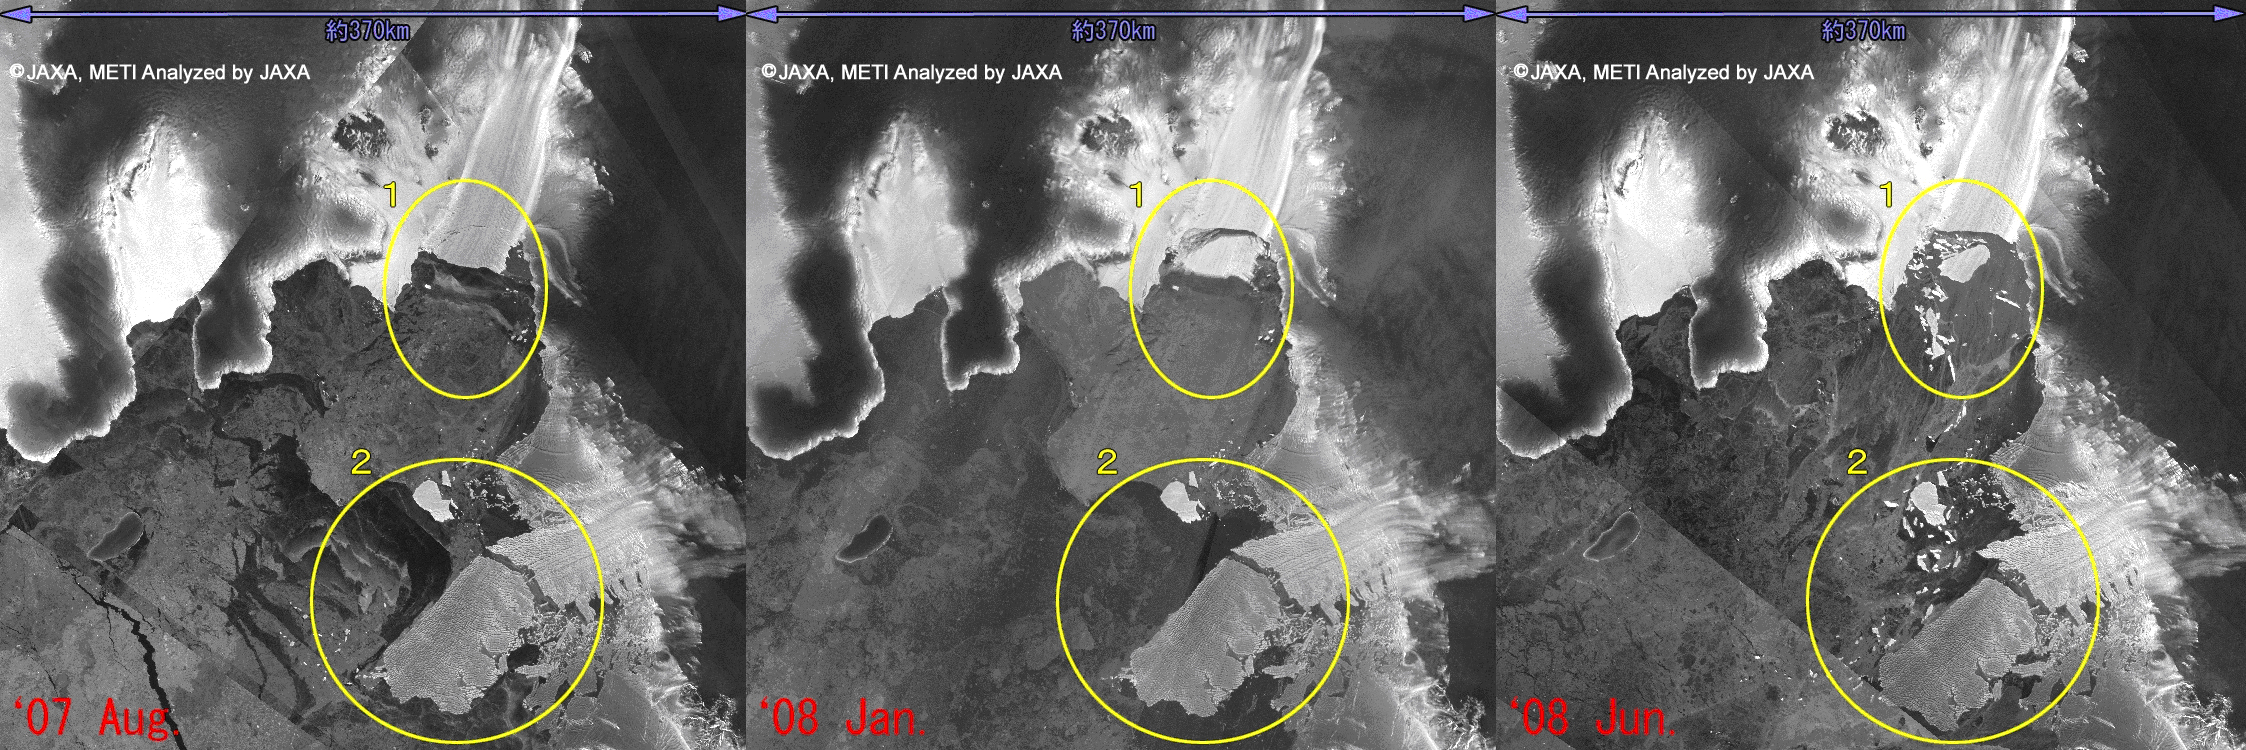
(Click to View Enlarged Image)
Area C (near George V land):
This example also shows the ice sheet floating.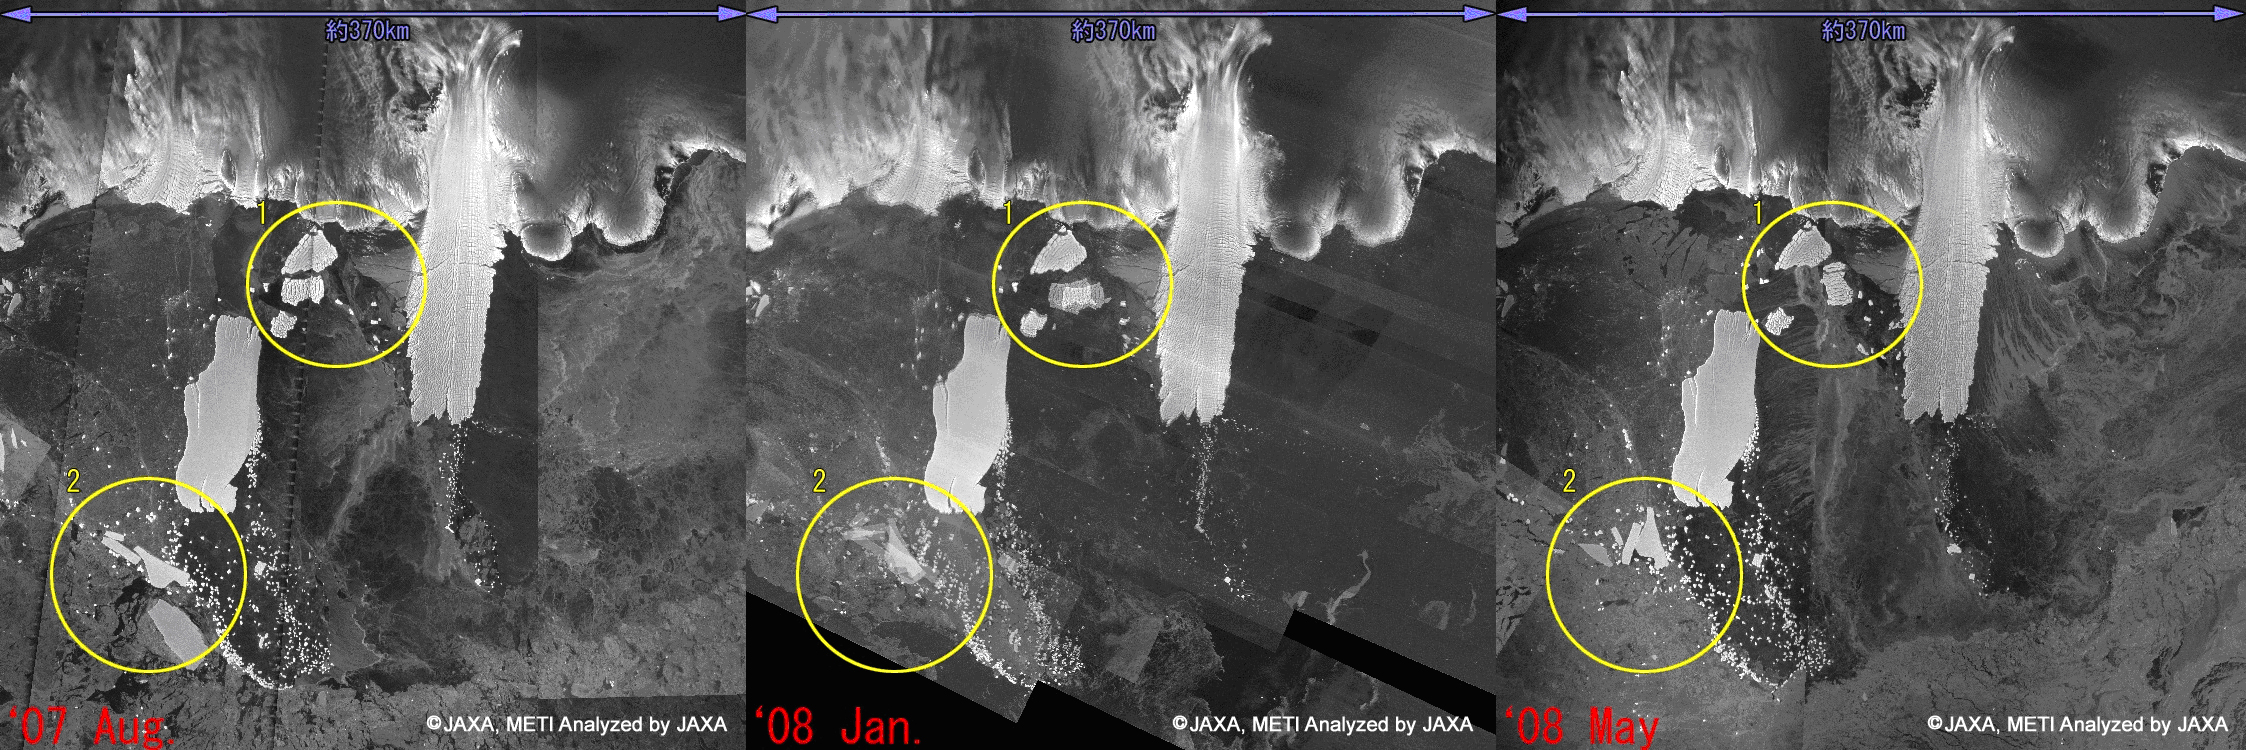
(Click to View Enlarged Image)
2. Greenland
Figure 5 shows the browse mosaic of the Greenland. This color image is observed by using the PALSAR polarimetry mode in the 11th cycle which is from April 22, 2007 to June 6, 2007. Three power components, horizontal transmit-receive (HH), horizontal transmit-vertical receive (HV), and vertical transmit-receive (VV) are color coded to Red, Green, and Blue, respectively. This image is world first polarimetric mosaic image over the Greenland. White area shows the rough surface snow and ice, light green for melting ice or thin ices. Dark area near the coast region means that the area is non-ice or slightly covered by the snow, or covered by slightly the smooth surface ices (it needs the ground truth). There are several areas where the ice moves very fast. Jakobshavn Glacier, which is one of the fast moving glacier, shows the quite big change over 13 years through the comparing with the JERS-1 SAR image (Fig. 6).
Note) Electro magnetic wave propagates with the vibrating electric field with magnetic field which are orthogonal each other. With regard to the electric filed, the vertical polarization has the vibrating electric filed perpendicular to the ground surface and the horizontal polarization has parallel component to the ground surface. The scattered signal has the different component of these two polarization on the target. Thus, the analysis of the power balance in the polarization can provide the features of the target. The analysis of the polarimetric data and retrieving the feature of the target is so called the polarimetry or polarimetric analysis.
It may show that the dark purple in the center of the island shows the smooth surface ice sheet, white area shows the rough ice, the coastal green area shows the ice melted rough surface.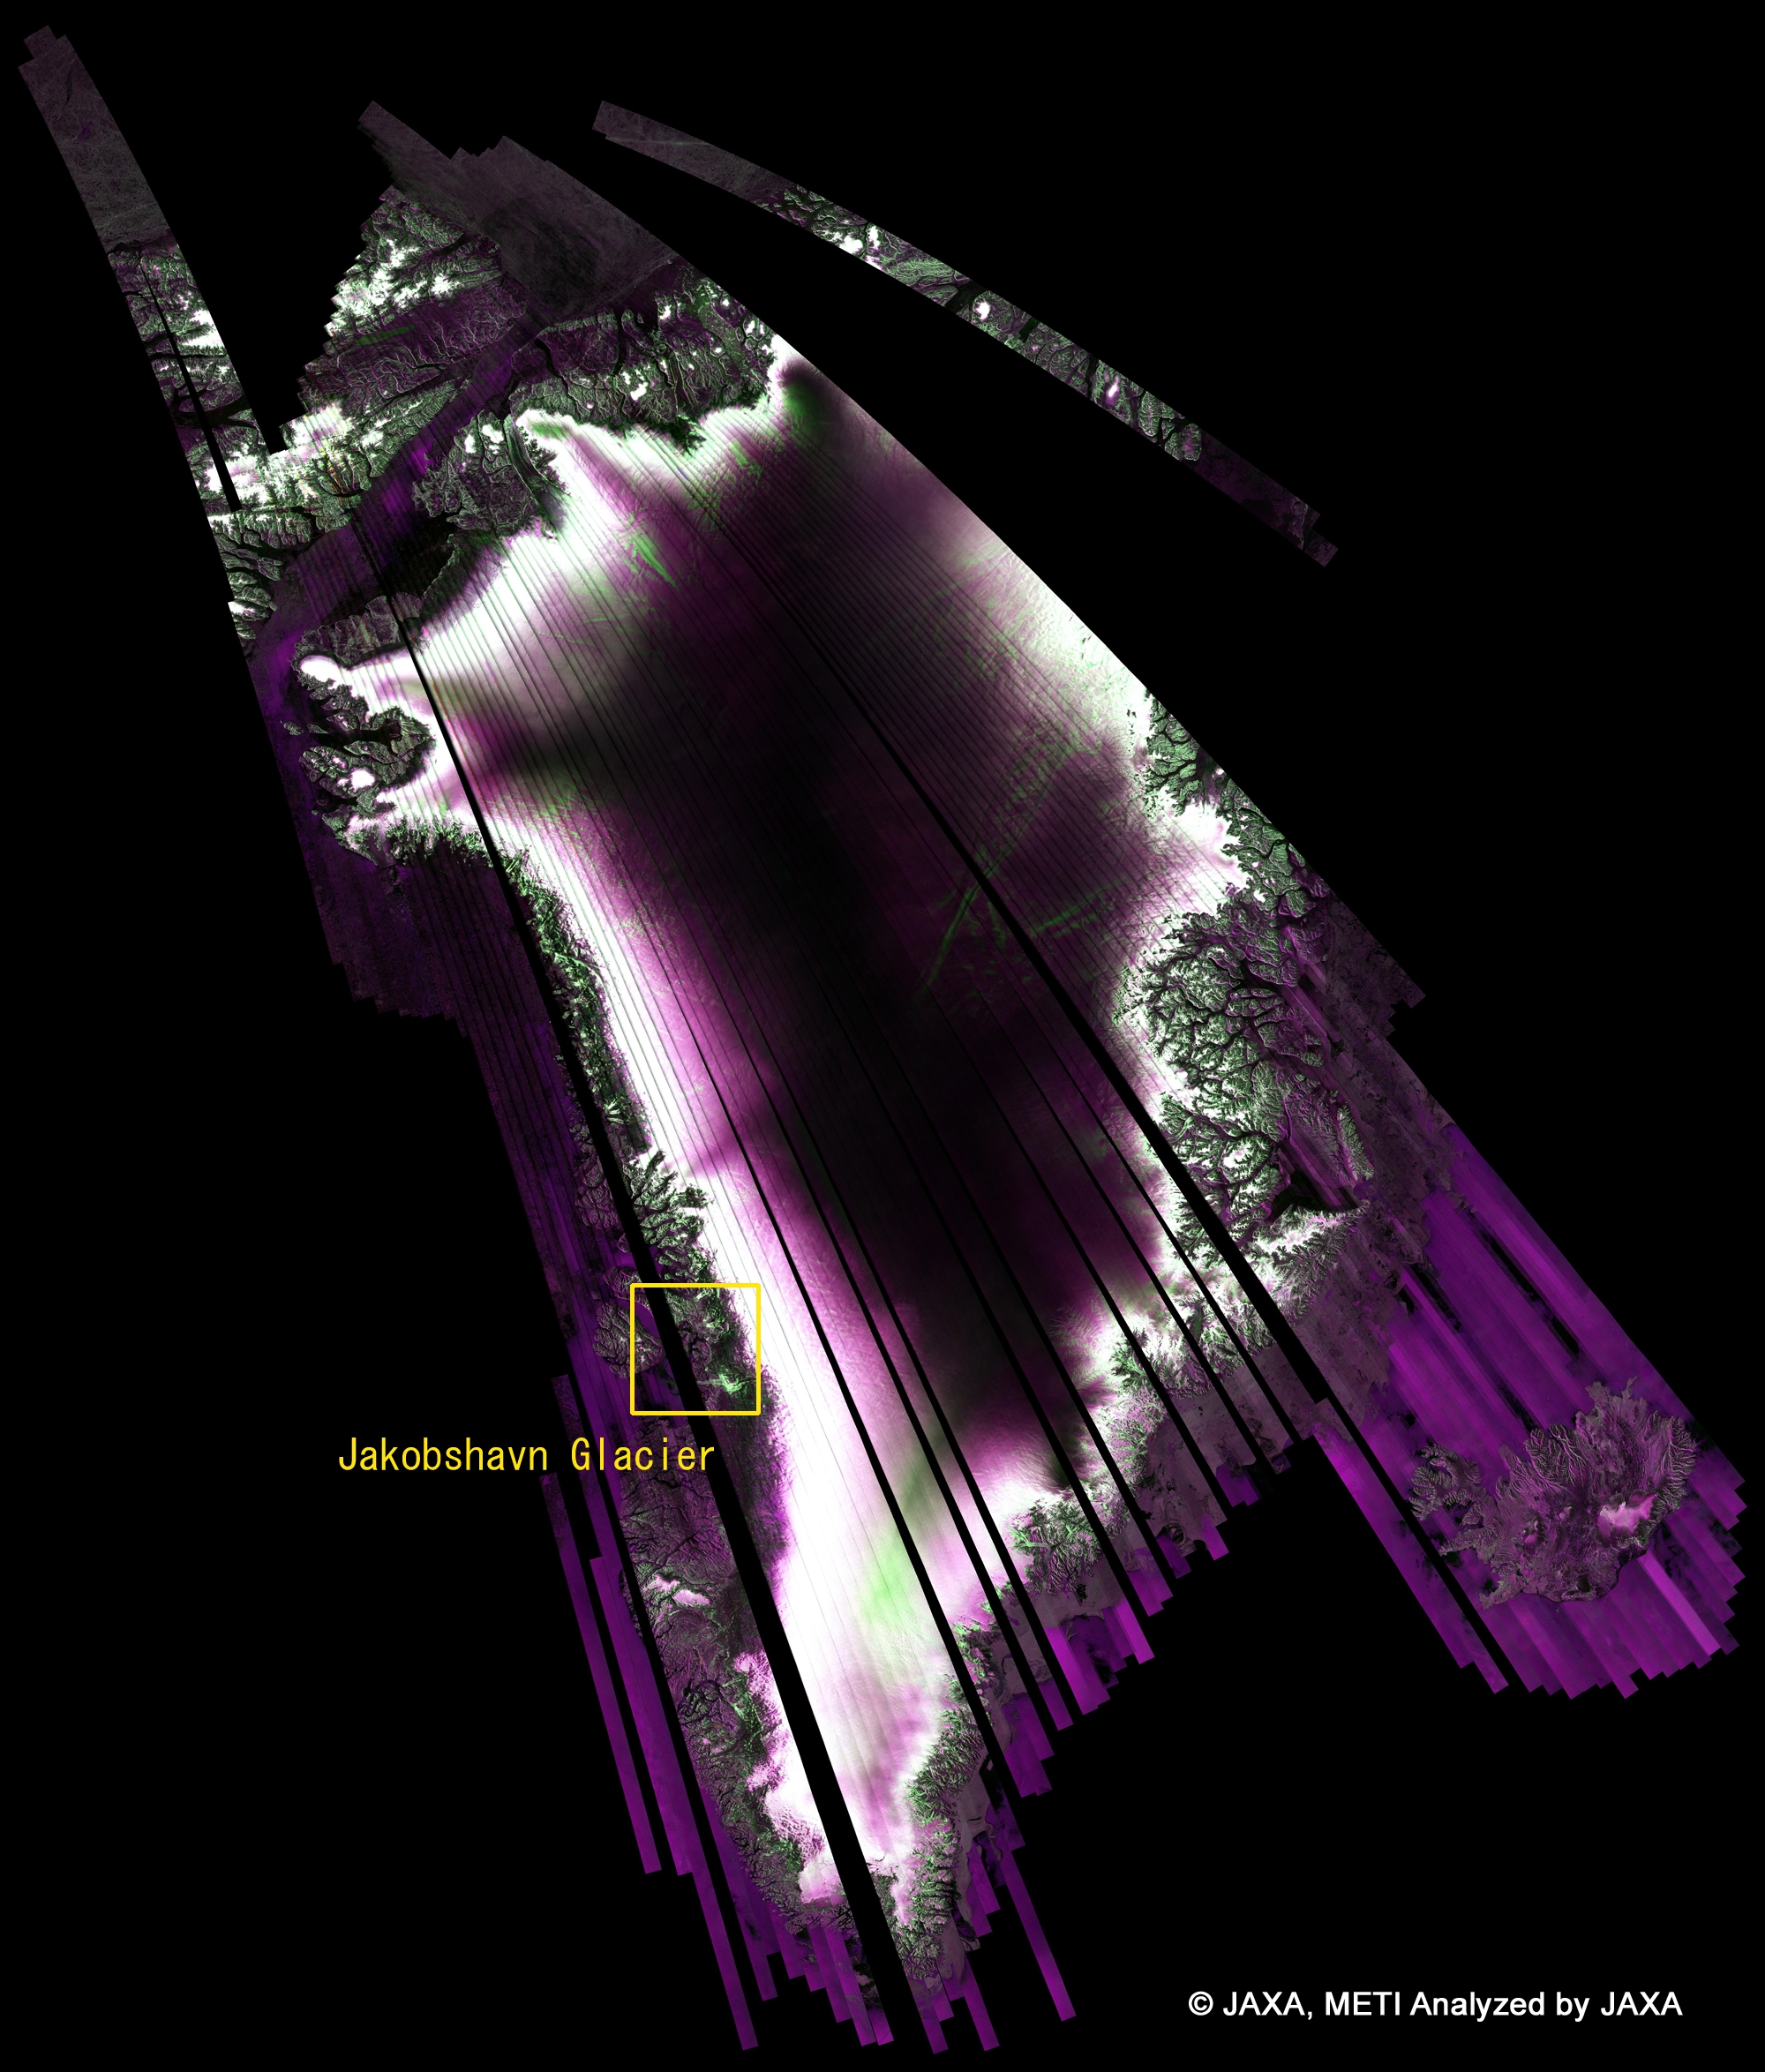
(Click to View Enlarged Image)
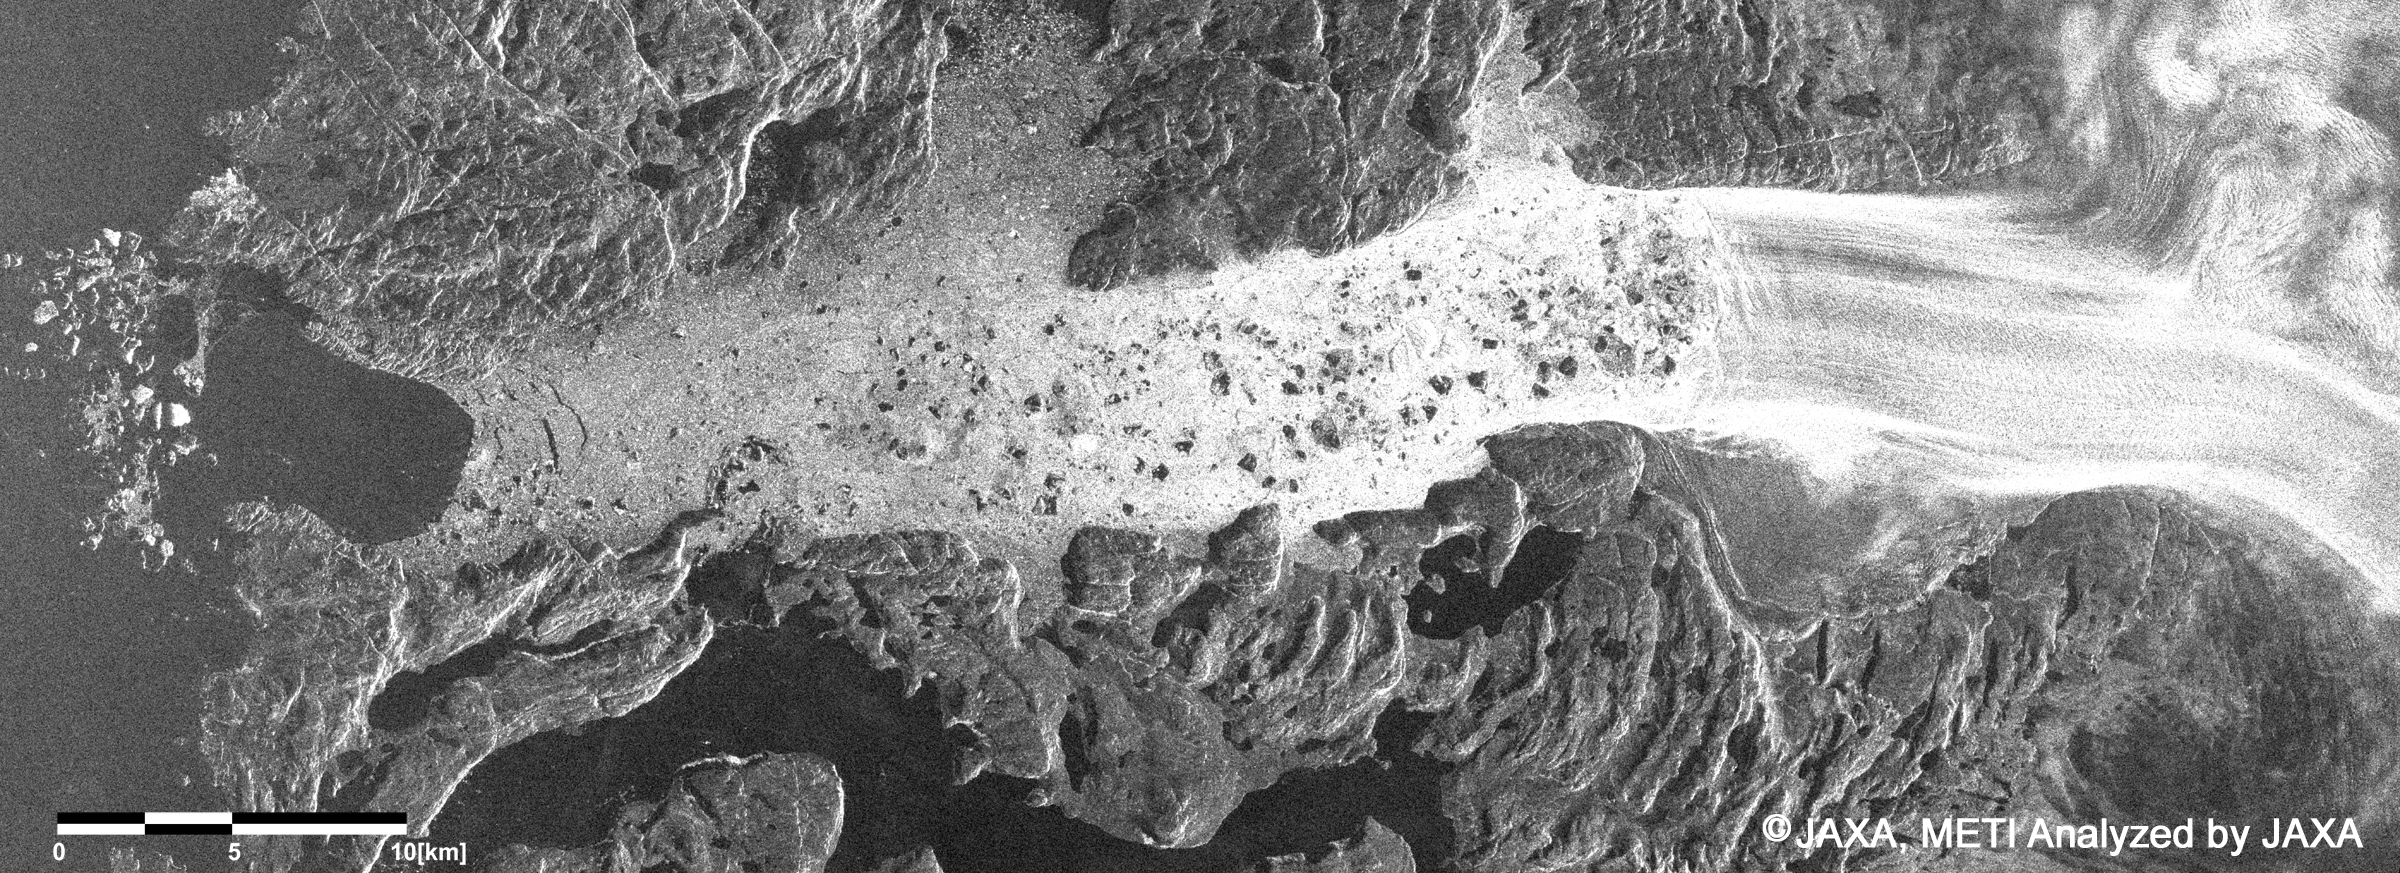
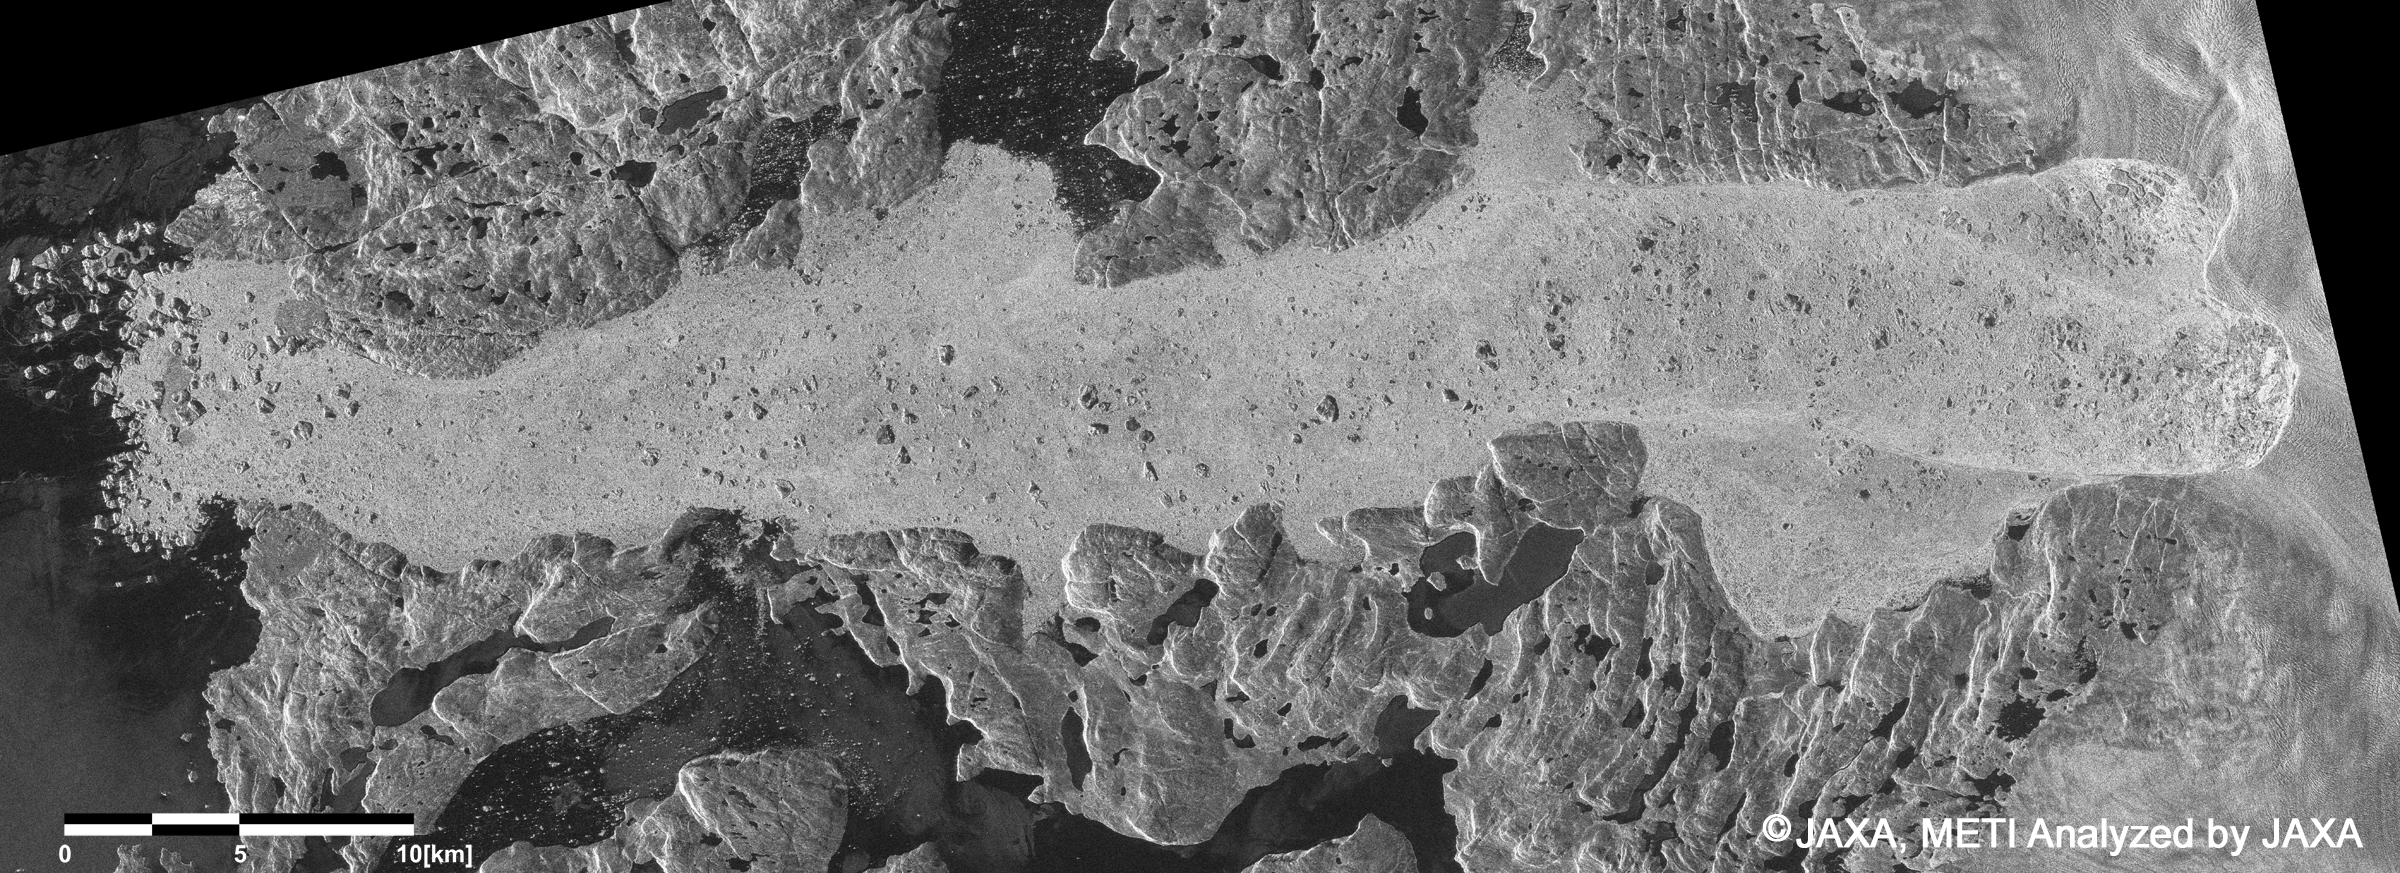
2.1 Comparison with JERS-1
Jakobshavn Glacier:
(Click to View Enlarged Image)
3. North Poles
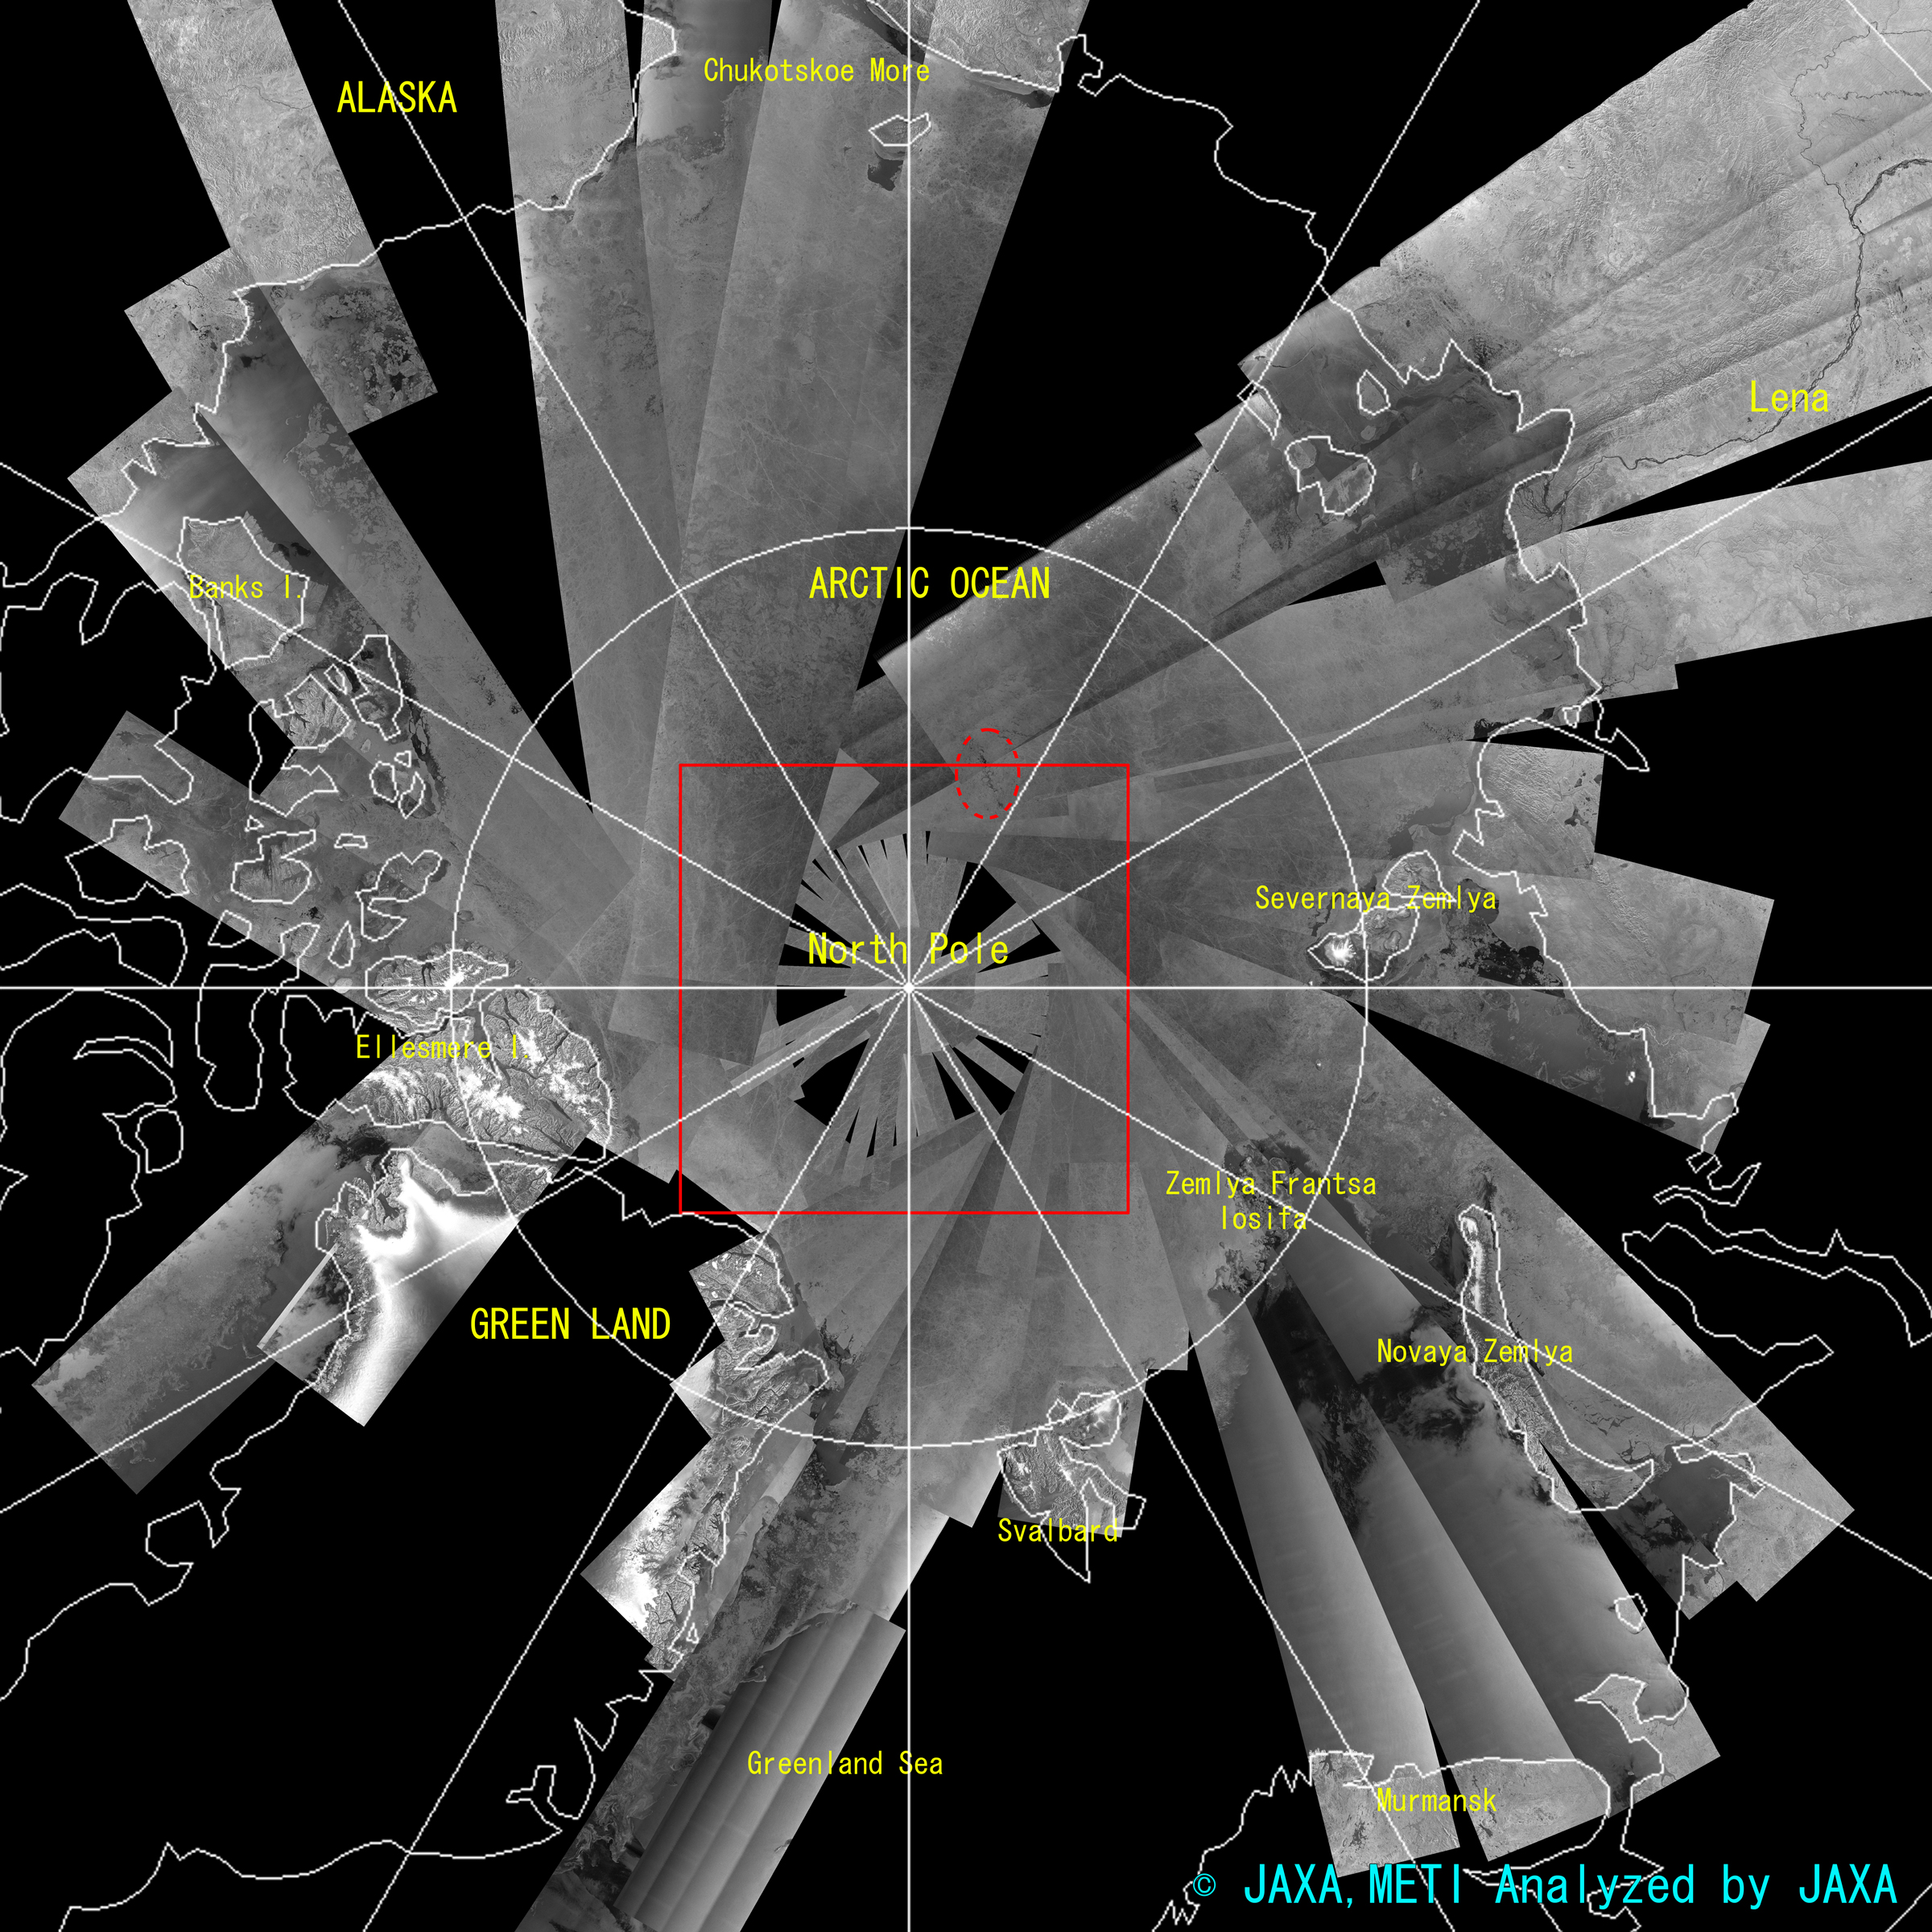
After June 9 2008, PALSAR observes the North Pole regions including the North Pole twice a day frequency (one by ScanSAR and one by FBD49.0). It plans to cover this area during 46 days and acquire three times coverage's by the beginning of fall 2008. Global warming may melt the large area of the polar ice region. Thus, JAXA continues to monitor this region by using PALSAR. Figure 7 shows the first mosaic made from June 9 2008 to July 25 2008. Dark area corresponds to the missing paths which are interrupted by the urgent observations in June. Enlarged images in Figure 8 shows that the North Pole regions are covered by the ice and exceptionally the dark areas in the red broken circles are open oceans.
(Click to View Enlarged Image)
(Click to View Enlarged Image)
Downloading products and browsing images
If the right of the thumbnail picture of the table of the following link place "Download" is clicked, the Data files (Raw format) and the image files (PNG format) of each mosaic are downloadable.
Notices
This dataset is available to use with no charge under the "Terms for Use".
To publish images using the dataset, please display "©JAXA, METI" in the image.