ALOS-2 images during the initial functional verification and
calibration/validation phases - Iceland
Japan Aerospace Exploration Agency (JAXA) is conducting the initial functional verification and calibration/validation (Cal/Val) of the Advanced Land Observing Satellite 2 (ALOS-2; Japanese name: "Daichi-2") launched in May 24, 2014 (JST). Data obtained by ALOS-2 are expected to contribute to the monitoring disasters, deforestation, sea ice in Okhotsk and polar regions, and many more.
A part of imageries obtained in the initial mission check period of Phased Array type L-band Synthetic Aperture Radar type 2 (PALSAR-2)* onboard ALOS-2 will be introduced sequentially. This page shows imageries of Iceland obtained by Stripmap mode (10 m) and ScanSAR mode between August 9 and September 11, 2014 (UT). To improve the data quality, the initial Cal/Val operation will be continued. Consequently, data products will be released to the general users from the end of this November.
* The PALSAR-2 is the only satellite-based synthetic aperture radar using the L-band frequency which is suitable for observing land deformation and the global environment. The PALSAR-2 can observe the earth's surface regardless of weather conditions and day/night.
The following imageries were acquired in the PALSAR-2 experimental observation. Around the Bardarbunga volcano in Iceland, volcanic earthquakes had been observed since August 2014, and its volcanic eruption started in August 29. Imageries focused on the volcanic activity are shown below.
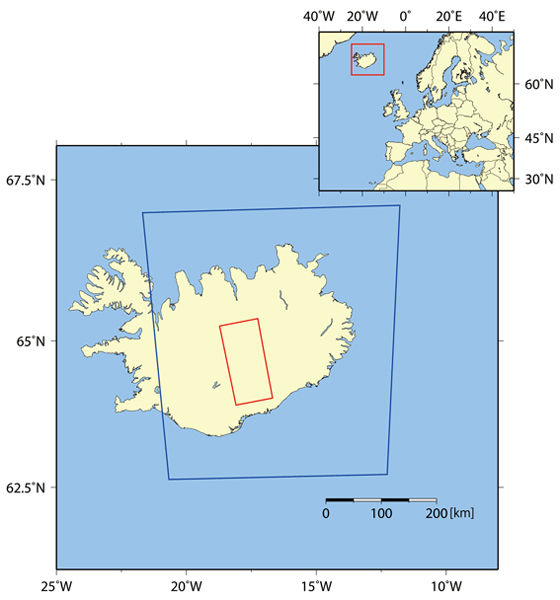
 Figure 1. Data acquisition area
Figure 1 shows the observed areas in Iceland. A blue rectangle was observed by ScanSAR mode (Fig. 2) with a swath of 350 km, whereas a red rectangle was observed by Stripmap mode (Fig. 3 and 4) with a spatial resolution of 10 m.
(Click the image for enlarge view)
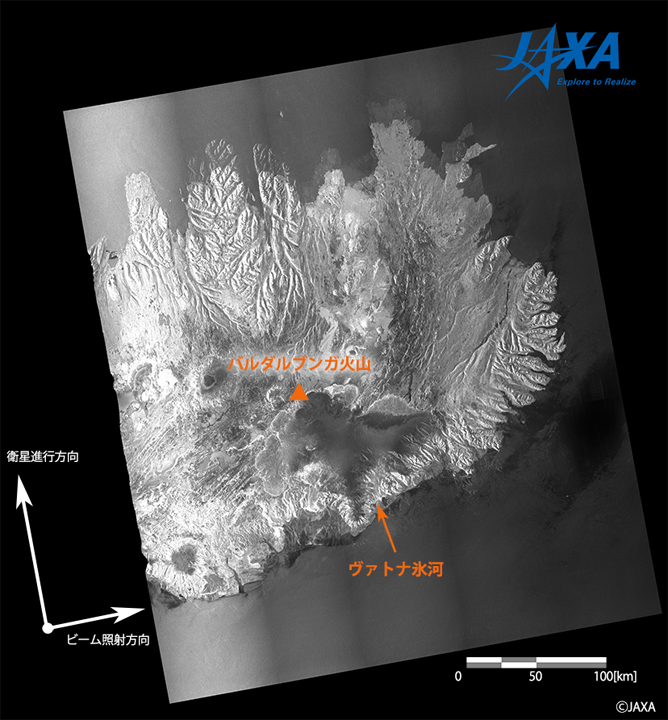
Figure 2 shows an eastern part of Iceland observed by PALSAR-2 with the ScanSAR mode before the volcanic eruption occurred. A dark part in the center near the southern coast is the Patna glacier distributed on a surface of the Bardarbunga volcano. Such a broad area can be observed by the ScanSAR mode with the wider swaths (350 or 490 km) than the Stripmap mode, which is preferable to be selected also for monitoring of catastrophic hazards and tropical forests in broad regions, for example.
(Click the image for enlarge view)
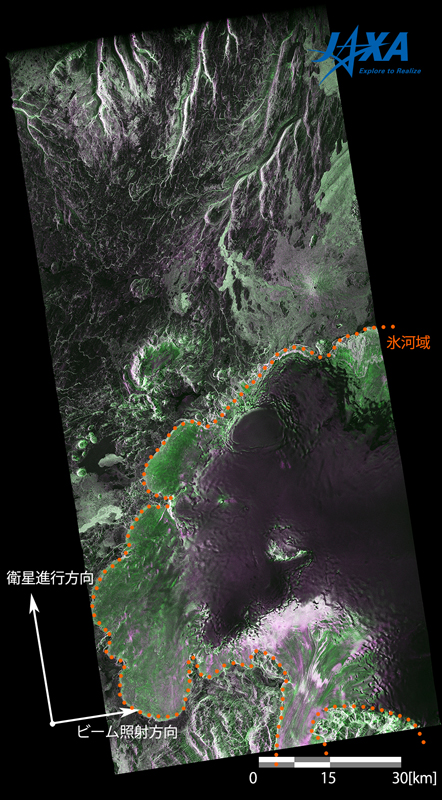
Figure 3 shows a surrounding part of the Bardarbunga volcano observed by the Stripmap mode after the volcanic eruption. In this imagery, color composite is performed with HH polarization assigned to red as well as to blue and HV polarization assigned to green. In the lower half of the imagery, different ice conditions of the Patna glacier are reflected by different colors. Smooth ice surface is supposed to be denoted as deep purple, whereas snow-covered and rough ice surface are shown as deep green. Combination of light purple and white in the lowest part shows a glacier flow to the south.
(Click the image for enlarge view)
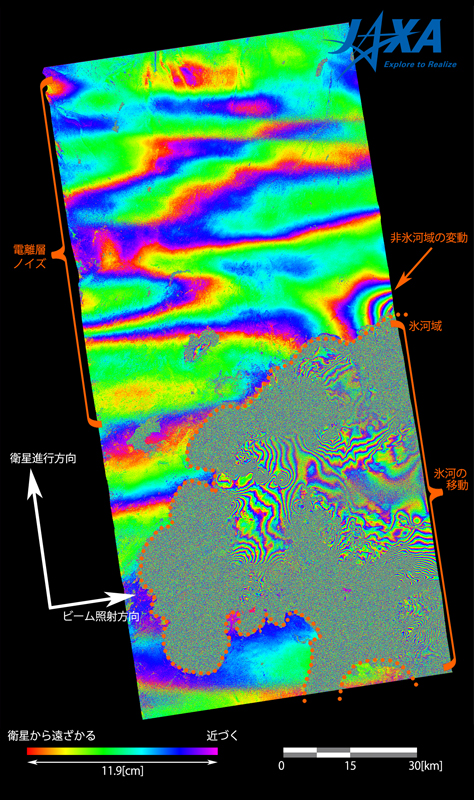
Interferometry with a couple of PALSAR-2 imageries taken on different dates can recognize a slight shift of the terrestrial surface. Figure 4 shows an interferometric imagery generated by two PALSAR-2 scenes acquired on August 28 (before eruption) and September 11 (after eruption).
Colored stripes denote shifted features of the terrestrial surface, i.e. one cycle of the color variation denotes that the relative distances from ALOS-2 has been changed at 11.9 cm (a half of L-band wavelength). West-to-east stripes in larger scales covering the upper half of the imagery are supposed to be noise components related to the ionosphere.
Numerous stripes are identified on the glacial surfaces, which reflects glacier flowing between the two dates. On the other hand, the glacier surfaces in which those stripes are difficult to be seen suggest drastic changes of surface condition such as excessively large shift or remarkable ice melting.
A series of stripes forming concentric circles is identified on the right side of the imagery, just outside of (and connected to) the northernmost part of the glacier. In the internal part of the concentric circles, an extension of the relative distance from ALOS-2 is recognized as a scale of four color cycles (47.6 cm). This situation suggests some influence by the volcanic eruption such as volcanic depression, landslide, permafrost melting, for example.
In the processing of these imageries, Ortho-reftification was performed by SRTM-DEM (90 m), whereas atmospheric correction was not.
This volcano has been observed also by another ALOS-2 sensor, Compact Infrared Camera (CIRC), which detected a high-temperature domain supposed to be a lava flow. The detail is described here (in Japanese).
© JAXA EORC


