First Image Data Acquisition by DAICHI-2 (ALOS-2)
The Japan Aerospace Exploration Agency (JAXA) acquired images from the Phased Array Type L-band Aperture Rader-2 (PALSAR-2)* aboard the Advanced Land Observing Satellite-2 "DAICHI-2" (ALOS-2). The DAICHI-2 was launched on May 24, 2014, and it is currently under initial functional verification. The images were captured during the verification stage.
The DAICHI-2's observation data is expected to contribute to understanding damages from a disaster, monitoring deforestation, and sea ice observation in the Sea of Okhotsk and Arctic area.
JAXA is continuing the initial functional verification to confirm that the DAICHI-2 satisfies its designated performances. After the confirmation, observation data will be calibrated from mid August. We plan to start offering images to the general public in late November.
* Note
The PALSAR-2 is the only satellite onboard synthetic aperture radar using the L-band frequency, which is suitable for observing diastrophism and the Earth's environment. It can perform observations on the Earth's surface regardless of weather conditions and the time of day.
The following are images acquired by the PALSAR-2 aboard the DAICHI-2 (ALOS-2) during its test observation between June 19 through 21 (Japan Standard Time.)
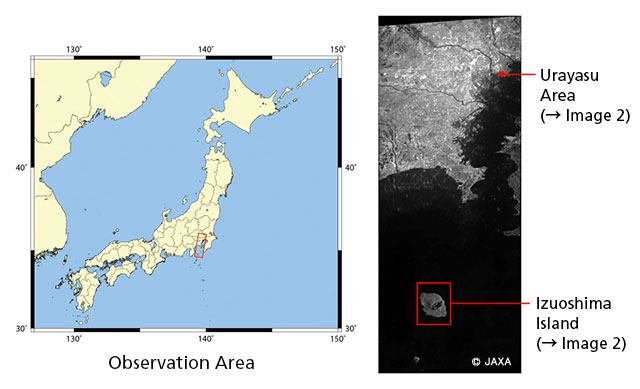 Image 1: Observation image of Kanto Region by PALSAR-2
(Urayasu City, Tokyo Disney Land Area)
(Click to View Enlarged Image)
(Click to View Enlarged Image)
Image 1 shows the observation image by PALSAR-2 with its strip map mode (resolution of about three meters) at around 11:43 a.m. on June 19 (Japan Standard Time) and an attached map indicates the observed area. The resolution of three meters is the world's best for the L-band synthetic aperture radar aboard an Earth observation satellite. With this high resolution, the DAICHI-2 is expected to understand the situation at a disaster-hit area more precisely.
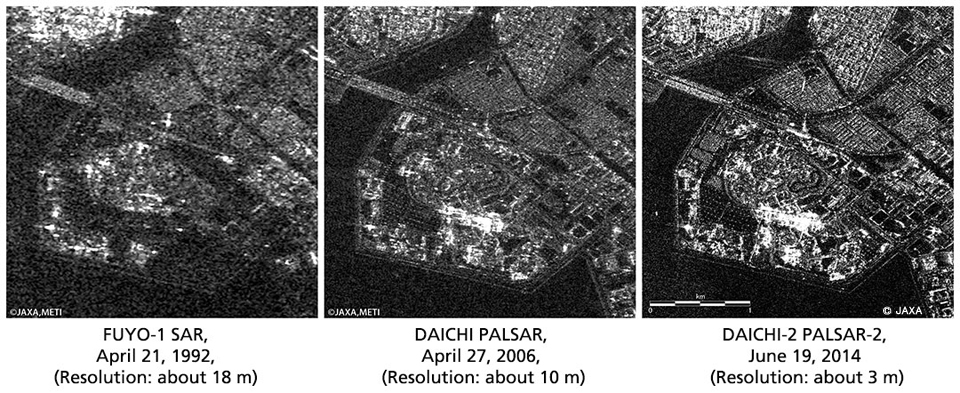
Image 2 is an enlarged version of the image around Urayasu city area in Image 1 (right), and, for comparison, the images of the same area taken by two other L-band synthetic aperture radars are also displayed. One is shot by the ALOS, which was launched in 2006 and acquired the image in the same year, and the other is the Japanese Earth Recourse Satellite -1 (JERS-1 or FUYO-1), which was launched 1992 and observed the area in the same year. You can see the resolution of the DAICHi-2 is higher compared to the past satellites.
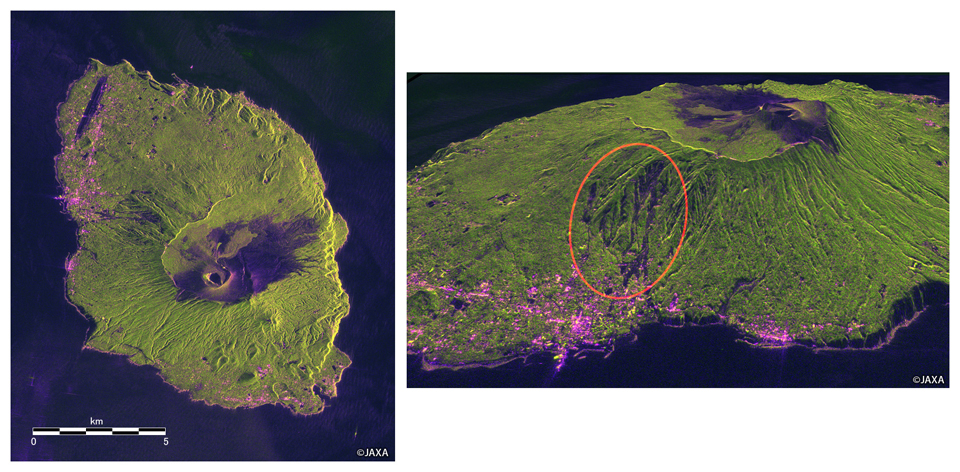
The left image of Image 3 is an enlarged version of an image of the Izu Oshima area in Image 1. The right image is a bird's-eye view image compiled by using altitude data acquired by the PRISM aboard the DAICHI. We can still see the scars of the large-scale landslide caused by Typhoon No. 26 in October 2013, even though almost eight months have passed (the dark area circled in red.) The vegetation has not recovered there yet. Image 3 was colored* spuriously using polarization data acquired through observations in order to understand the land cover classification more precisely. Roughly speaking, green indicates vegetation, light purple and yellow-green are urban areas, and dark purple is barren areas.
* Red, green and blue are assigned to HH, HV, and HH/HV polarization waves respectively to compile a polarization wave colored image.
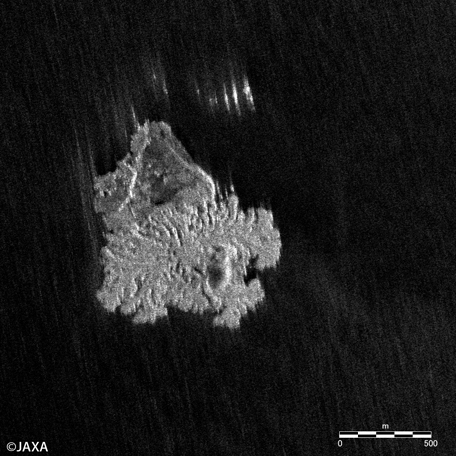 Image by an airplane (Pi-SAR-L2)
on Feb. 4, 2014
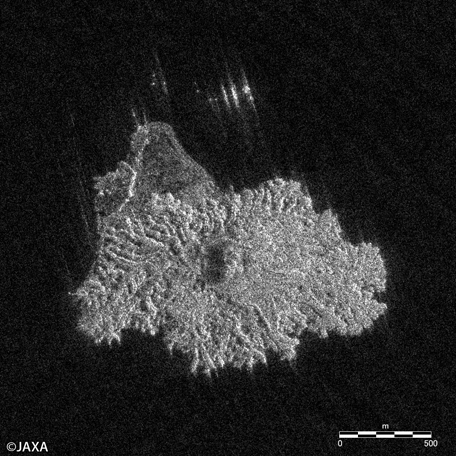 Image by PALSAR-2
on June 20, 2014
and the same island taken by the synthetic aperture radar aboard airplane (left)
(Click to View Enlarged Image)
Image 4 shows two images of Nishinoshima Island. The right one was acquired by the PALSAR-2 with its strip-map mode (about 3-meter resolution) at 10:53 p.m. on June 20, 2014. The left one is taken by the L-band synthetic aperture radar (Pi-SAR-L2) aboard an airplane on February 4, 2014. When you compare the two, in about four months the island grew bigger due to a volcanic eruption. (The incremented area is estimated to be 0.67 km² from the images.) The observation of the island was conducted during the night, and, it also proves that the synthetic aperture radar can penetrate through smoke from the eruption, thus the PALSAR-2 can monitor such an eruption activity continuously.
(Click to View Enlarged Image)
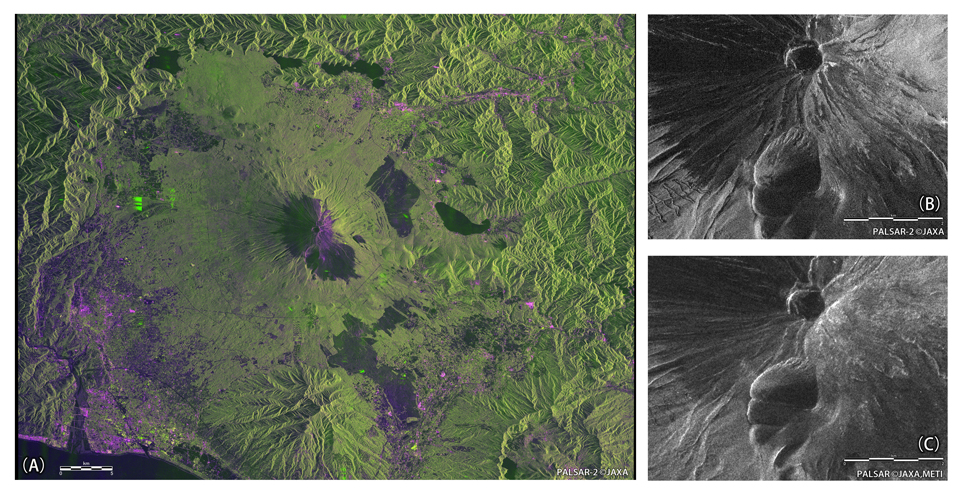
Image 5 (A) is an image acquired by the PALSAR-2 using strip map mode (about 3-meter resolution) at 10:55 p.m. on June 20, 2014. The image was colored* spuriously using polarization data acquired through the observation in order to understand the land cover classification more precisely. Roughly speaking, green indicates vegetation, light purple and yellowish green are urban areas, and dark purple is barren areas. (B) is an enlarged image around the tip of Mt. Fuji. (C) is a comparison with the image taken by the PALSAR aboard the DAICHI (ALOS.) When you compare them, you can see that visibility is significantly increased, thus roads to the top of Mt. Fuji and its crater are clearly observed.
* Red, green and blue are assigned to HH, HV, and HH/HV polarization waves respectively to compile a polarization wave colored image.
(Click to View Enlarged Image)
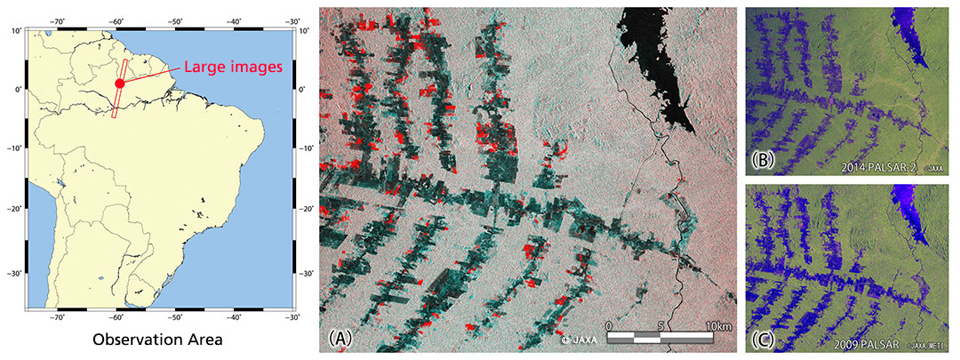
Image 6 (A) shows deforestation in the east region of Roraima in Brazil in comparison to the same region taken in 2009. Image (A) was compiled by combining image (B) acquired by the PALSAR-2 on June 21, 2014, and the other (C) shot by PALSAR (aboard the DAICHI) in 2009 and adding colors. (Sky-blue indicates non-forest areas, gray represents forests, red is deforested areas over five years.) The total deforested space reaches 25.0 km² within the area shown in this image. Observations by the PALSAR-2, which are suitable for measuring forestry with L-band radio waves, will enable global-scale forest monitoring. Therefore, the DAICHI-2 is expected to significantly contribute to the estimation of biomass of forests, which is deeply related to climate change and forestry control.
© JAXA EORC
© Copyright 1997- All Rights Reserved.