|
|
|
|
|
Global Mapping Images (prototype)
|
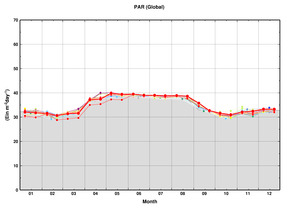
Photosynthetically Available Radiation
(Average:--.--.-- - --.--.--)
|
Graph
|
Half Monthly Ave.

|
Anomaly
|
|
Snow Cover Extent
(Average:Jul.01,2026 - Jul.15,2026)
|
Graph
|
Half Monthly Ave.
|
Anomaly

|
|
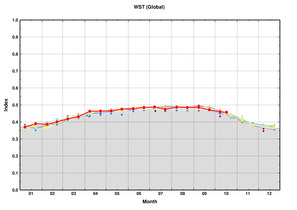
Plant Water Stress Trend
(Average:--.--.-- - --.--.--)
|
Graph
|
Half Monthly Ave.
|
Anomaly
|
|
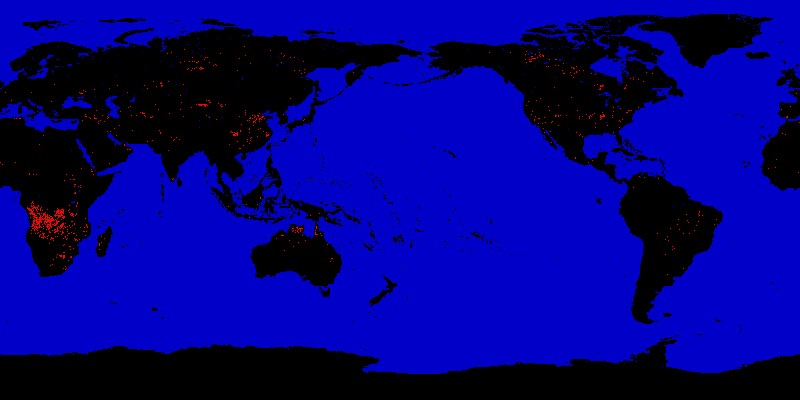
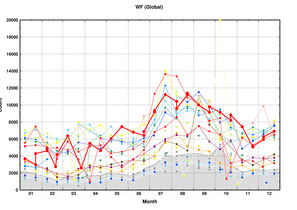
Hot Spots of Wild Fire
(Average:Jul.01,2026 - Jul.15,2026)
|
Graph
|
Half Monthly Ave.
|
|
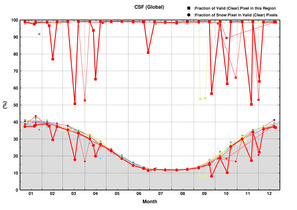
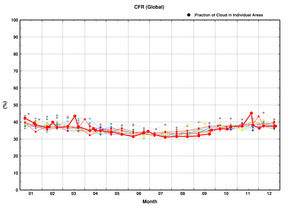
Cloud Cover Rate
(Average:Jul.01,2026 - Jul.15,2026)
|
Graph
|
Half Monthly Ave.

|
|
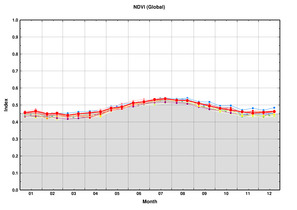
Activity of Vegetation (NDVI)
(Average:Jul.01,2026 - Jul.15,2026)
|
Graph
|
Half Monthly Ave.

|
Anomaly

|
|
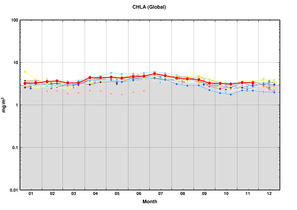
Phytoplankton abundance (Chlorophyll-a)
(Average:--.--.-- - --.--.--)
|
Graph
|
Half Monthly Ave.
|
Anomaly
|
|
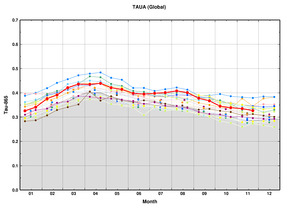
Aerosol abundance (Optical thickness)
(Average:--.--.-- - --.--.--)
|
Graph
|
Half Monthly Ave.
|
Anomaly
|
|
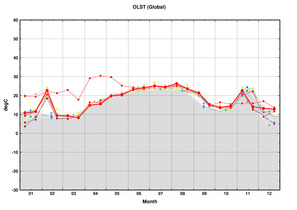
Ocean and Land Surface Temperature
(Average:--.--.-- - --.--.--)
|
Graph
|
Half Monthly Ave.
|
Anomaly
|
|
|