|
These images were produced using TRMM real-time data provided by NASA. This data is generated in a simplified process for producing the product compared to the standard product. And it is distributed to registered users within 3 hours for the operational data use, such as weather forecast. JAXA/EORC produces images from this real-time data as quickly as possible and publish them on the web site.
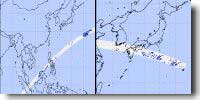
The images show the Near-Surface Rain Rate (Ver.5, before Jan. 4, 2005) and the Estimated Surface Rain Rate (Ver.6, after Jan. 4, 2005) in the 2A25 product of PR. The Near-Surface Rain Rate is the rain intensity at the lowest clutter-free (not influenced by ground clutter) range bin at each angle bin. The height is about 500m from the surface at nadir, and 2000m at the edge of the observation swath. The Estimated Surface Rain Rate is the rain intensity at the actual surface calculated from the Near Surface Z-factor at each angle bin. The indicated time in the panel is when the data in each image started and finished. When the data is drawn separately in an image, we indicate the start time (UTC) on the right and finished time (UTC) on the left.
Note that compared to standard products, there may be a small discrepancy in location, because predicted orbit information is applied to generate real-time data. |