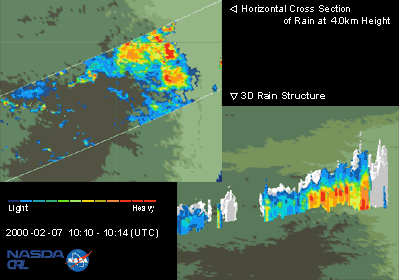
3-D rainfall (left) and horizontal distribution (right) acquired by TRMM/PR on February 7, 2000. Heavy rain fell intermittently for several weeks, causing flooding in the Limpopo River.
Figure 2 shows the 3-D rainfall image on the right and the horizontal distribution on the left based on data acquired by TRMM/PR (the area indicated in red square in the figure). TRMM/PR observes the precipitation in a wide area at rates exceeding 30mm/hour.
The background shows the sea level, with darker shades of green indicating higher altitudes above sea level. |