Combined / PR, VIRS and TMI
Rain over Argentina Feb. 20, 1998 (UT) |
|
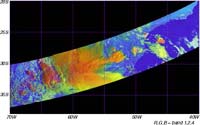 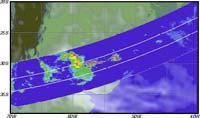 Fig.1. VIRS: RGB color composite Fig.2. TMI: 85GHz V-POL. Brightness Temperature 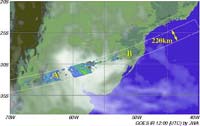 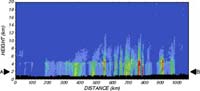 Fig.3. PR: Horizontal Cross Section of Rain at 2.0km Height Fig.4.PR: Vertical Cross Section |
|
| These images are simultaneous images of rain over northern Argentina and Uruguay from the Visible Infrared Scanner (VIRS), TRMM Microwave Imager (TMI) and Precipitation Radar (PR) from 10:40 to 10:48 on Feb. 20, 1998 (UT). Figure 1 is a colorcomposite RGB image of channels 1 (visible), 2 (near infrared) and 4 (infrared) (for red, green and blue respectively) observed by VIRS. Figure 2 shows the 85GHz, vertically polarized brightness temperature observed by TMI. Figure 3 shows the horizontal cross section of rain at 2.0km height. Figure 4 shows the vertical cross section of rain along the line AB in Fig. 3.
Optically thicker clouds at the upper layers are reddish in Fig. 1 because of the high reflectivity of ch 1 and their low temperature. Figure 3 shows that rainfall was observed in these areas. It is clear in Fig. 4 that the heavy rain developed in the layers above the heavy rain which was in the lower layers. Generally, there were ice crystals over the rain which developed at high altitudes. The brightness temperature in Fig. 2 decreased due to microwave scattering caused by these ice crystals. In this way, the rainfall process in the clouds and the characteristics of rainfall will be revealed by the simultaneous measurement by these three sensors. |
| TRMM Level 3 Monthly Rainfall Products May 2000 | |||||||||||||
|
|||||||||||||
Figures 1 to 6 show monthly accumulated surface rainfall in May 2000, selected from the TRMM Level 3 standard products (monthly and latitude-longitude grid); PR, TMI, the PR and TMI combined algorithm (COMB) and "TRMM and Others Combined" algorithm. Each algorithm is briefly described below.
|
|||||||||||||