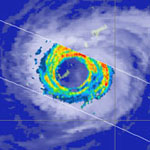
Figure shows typhoon No.8 observed by PR on Aug.7, 2000. A huge eye of the typhoon can be seen.These are horizontal cross section images of typhoon No.8. These present that a huge eye of the typhoon No.8 was growing larger day by day.
Dec. 1997 Cyclone PAM
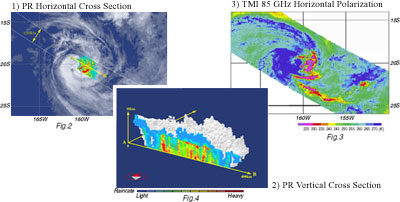
Figures show the images the PR observed the tropical cyclone PAM. Fig. #1 is a horizontal rain rate image at a height of 2.0km. The fig. #2 is a 3-dimensional cross section along the line AB in the figure #1, and Fig.#3 is a TMI 85GHz horizontal polarization map.
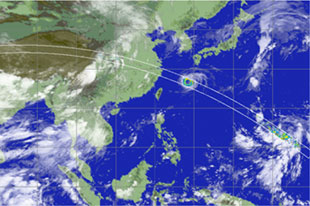
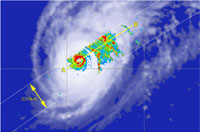
Dec.1997 typhoon No. 28 (PAKA)
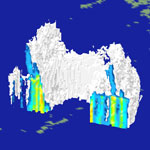
This figure is the image of typhoon No.28 from Precipitation Radar (PR) on 19.Dec, 1997. It shows a horizontal cross section of the rain at an altitude of 2.0km together with a vortex image (cloud distribution) taken from the GMS.
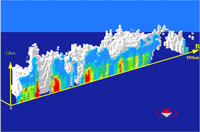
Figure shows a three-dimensional image of rainfall. The cross section shows the vertical distribution of rain intensity along the line AB which crossed the eye of the typhoon in prior figure. The white and gray cubic structure behind the cross section shows the rain echo height measured by the PR. Surrounding the eye in an elevated rain region up to about 12km, and there is heavy rain in the lower layer of this region.