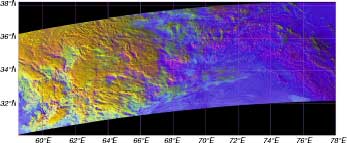
Fig.1 Color composite RGB Image
R : ch1, G : ch2, B : ch4
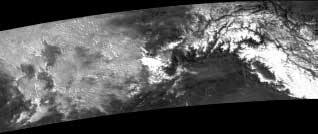
Fig.2 Gray-scale image for the ratio of ch1 and ch2
Figure 1 is a color composite RGB image (channel 1 [0.63μm] and 4 [10.8μm] for red, green and blue, respectively) over the Tibetan plateau observed by the TRMM Visible Infrared Scanner (VIRS) on Dec.21, 1997. The snow-covered Himalayan mountains are reddish, water cloud areas are yellowish, and Himalayan valleys and plain areas are bluish. The larger reflectivity for both ch 1 and ch 2 makes the water cloud yellowish, the larger reflectivity for ch 1 and smaller reflectivity for ch 2 makes snow areas reddish. The valleys and plain areas are bluish due to their relatively warmer temperature.
Figure 2 is a gray-scale image for the ratio ch 1 and ch 2. The observed region and time are the same as in Fig 1. The larger region is white. Water reflectance for the ch 1 and ch 2 wavelengths are similarly, but ice reflectance is smaller for the wavelength of ch 2 than that of ch 1. Therefore, the ratio of ch 1 / ch 2 is larger for snow covered areas than water cloud areas.
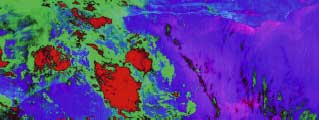
Image over the south of the Brazil Dec.21, 1997(UTC)
Fig.3 Color composite RGB Image
R : smaller BTD between ch4 and ch5
G : larger BTD between ch4 and ch5
B : brightness temperature at ch4
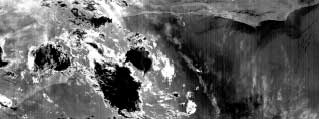
Fig.4 Gray-scale image for BTD between ch4 and ch5
Figure 3 is a color composite RGB image (red for smaller brightness temperature difference (BTD) between ch 4 and ch 5 [12μm], green for the lager BTD, and blue for the brightness temperature (TBB) at ch 4) over the south of the Brazil observed in the same day. Otically thicker cumulus clouds are reddish due to the smaller BTD, optically thin ice clouds are green and ocean and land are blue because of the warmer TBB. Regions with less water vapor are reddish due to the smaller BTD, and moist regions are bluish over the ocean because of the larger BTD and warmer TBB.
Figure 4 is gray-scale image of BTD. The observed region and time are the same as in Fig. 3. The larger BTD is shown in white. Optically thin cirrus clouds exhibit larger BTD, while optically thick cumulus clouds indicate smaller BTD. Over cloud free ocean areas, the BTD increases with the increase of water vapor. The BTD is useful for classifying clouds and deriving water vapor amount. The Sea Surface temperature, which is corrected for water vapor absorption, can also be estimated using ch 4 and vapor amount. The Sea Surface Temperature, which is corrected for water vapor absorption, can also be estimated using ch 4 and ch 5.
Standard Products ・・ Samples
Research Products ・・ Samples (Sea Surface Temperature)