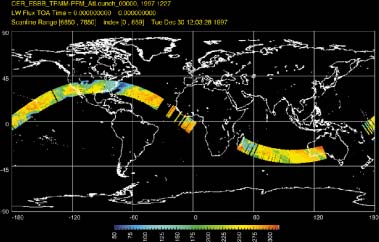
This plot shows the long-wave flux or heat energy leaving the Earth during the first orbit of measurements after CERES began scanning the Earth. The flux is expressed in units of watts per square meter, or energy per unit area. Blue indicates cold tops of clouds, and red generally warm, clear desert regions.
Long-Wave Radiant Energy Dec. 28, 1997
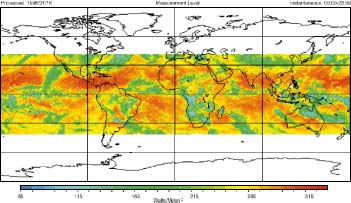
This picture shows the amount of heat energy which is emitted from the Earth and its atmosphere. The color scale ranges from cold to hot. Blue indicates cold tops of cloud systems, and red, hotter regions on the Earth such as the deserts and tropical oceans.
The anomaly that an over voltage was loaded for the CERES instrument occurred around August 1998, 9 months after launch, analysis of the cause and some counterplans have been performed until now. Therefore the science data acquisition is limited, intermittently done.