Pre-launch Calibration
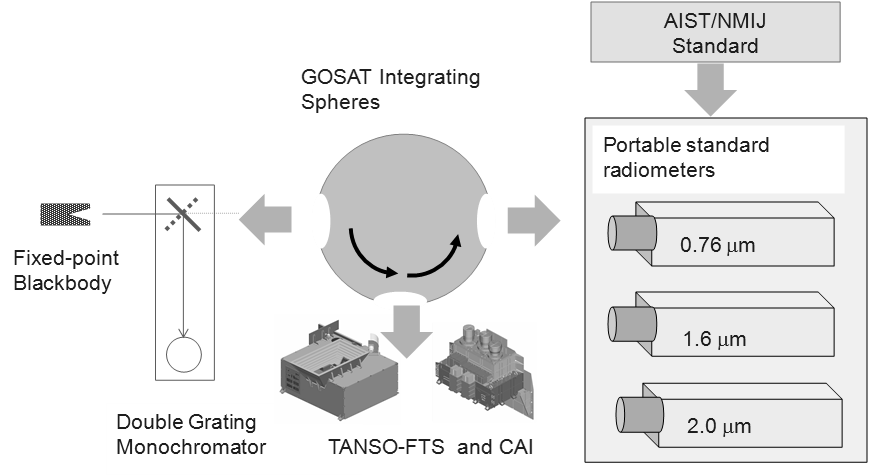 Configuration for TANSO-FTS and CAI prelaunch radiometric calibration experiments.
TANSO-FTS
TANSO-FTS has channeling in Band 2S, which is caused by multiple reflections at the band separation optics and its magnitude is stable. A small oscillation feature of the conversion factor corrects channeling simultaneously and produces channeling-corrected spectral radiance.
 and 2S (solid line) of high gain.")
Radiance conversion factors from the Level 1B data to the spectral radiance for the TANSO-FTS Band 2P (bold gray line) and 2S (solid line) of high gain.
Radiance Conversion Table and Level 1B Updates
Radiance Conversion tables for V201 (compared with V150 conversion table):
- V201.201 algorithm was applied to prelaunch calibration data.
- Combination of integrating sphere (absolute) and thermal vacuum data (no absorption) were used.
- No significant difference in strong CO2 and week CO2 (at least OCO-2 retrieval range)
- Up to 1% difference in Band 1 (O2 A) Gain M as previous version has overcorrected the band 1 gain M non-linearity. It is much smaller than prelaunch calibration accuracy of 3%.
- No need to change radiometric degradation factor (RDF) [Kuze et al., 2014, IEEE TGRS] (V201/V161 ratio are constant: prelaunch, RRV)
- V201 best-estimated-spectral radiance was calculated using RDF Kuze et al., 2014 and V150 radiance conversion factor. The next version (to be V210) will use V201 or equivalent radiance conversion table but the difference is small.
- The main update of V210 will be TIR (band 4) non-linearity correction and glint flag in mid and high latitude).
Noise level estimation for V201:
- The raw L1B spectra with the unit of V/cm-1 have white noise. Out-of-band spectra can be used for SNR estimation.
- The best estimated radiance spectra were calculated from spectrally dependent radiance conversion table. Weak out-of-band spectra were largely-magnified and noisy. The out-of-band spectra in V201 (best estimated) were excluded. V201 still include out-of-band raw spectra.
- Noise level can be estimated from V201 raw spectra with unit of V/cm-1.
| Radiance Conversion Table (prelaunch data was reprocessed with V070, V150, V201) | ||||
|---|---|---|---|---|
| WL start (cm-1) |
WL corrected (cm-1) |
Number of rows | ||
| V070 (July 2009) | Absorption | 12400.143 (0.5 cm-1 interval) |
(not shown) | 2601 |
| (May 2010) | Envelope, released from NIES GDAS | 12400.143 | (not shown) | 2601 |
| V150 (May 2012) | Envelope, released by request | 12400.143 | 12402.586 | 2601 |
| V201 (March 2016) | Envelope, will be released from NIES GDAS | 12400.143 | 12402.586 | 2601 |
| Level 1B product | ||||
| WL start (cm-1) |
Interval (cm-1) |
Number of rows | ||
| V150, 161 (raw) | Radiometric Degradation Factor in Kuze et al., 2014 used V150 | (not shown) | (not shown) | 6565 |
| V201 (raw) | 12400.078 | 0.19949 | 6565 | |
| (best estimated) | Converted with V150 table | 12900.008 | 0.19949 | 1504 |
| V210 (Best estimated) | Will be converted with V201 | TBD | TBD | TBD |
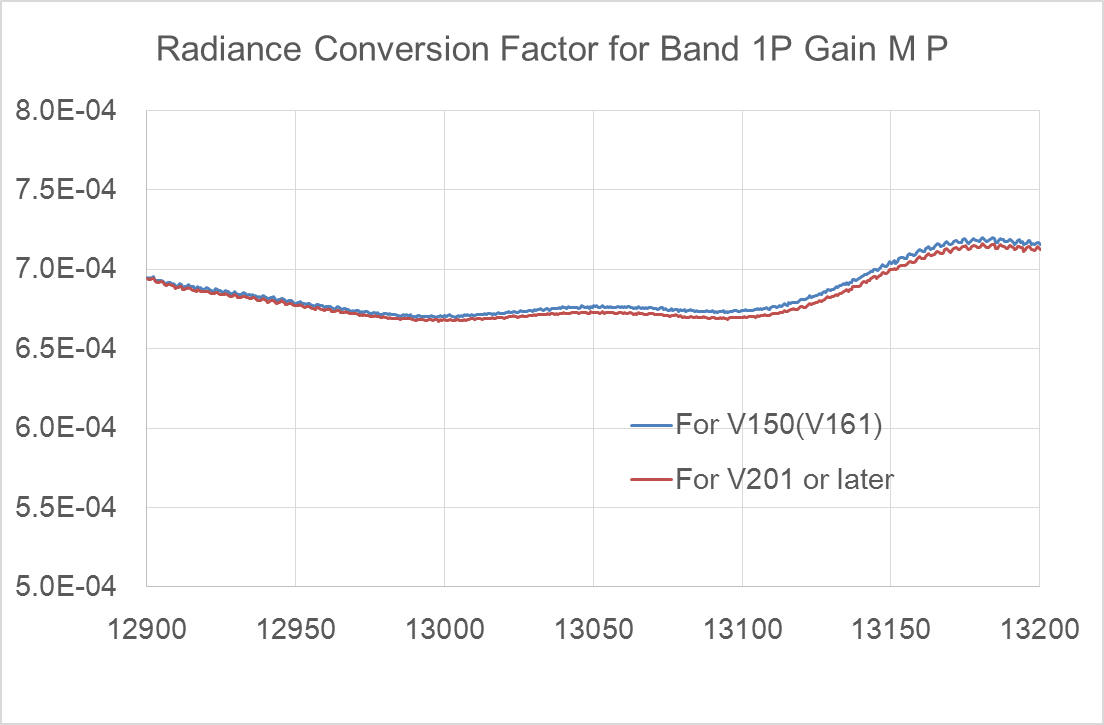
Comparison of Band 1P radiation conversion factors between FTS V150(161) and V201.
TANSO-CAI
NOTE: NIES is in charge of TANSO-CAI Level 1B processing where the radiometric calibration of TANSO-CAI data is performed1. The description of the radiometric calibration below is therefore just a suggestion from JAXA.
(1 The technical information regarding the actual TANSO-CAI Level 1B processing algorithm is available at GDAS.)
The TANSO-CAI Level 1A data includes signals and offsets which vary depending on the total input radiance, and dark currents. The observed spectral radiance is calculated basically using the following equation:
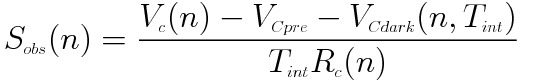 (1)
(1)
where  ,
,  , and
, and  are output, dark level, and response of the pixel number n, respectively.
  is the integration time of the detectors.
  is the average of output of the first three pre-scan pixels and calculated separately for the odd and the even pixels. We assume that the dark level is a function of the integration time and is constant with time since launch. is based on the pre-launch calibration and degradation correction is described below.
All the pixels of each band were calibrated at the same time before launch by using the integrating sphere, the inner surface of which is coated with barium sulfate (BaSO4). Radiation emanating from the aperture of the integrating sphere has a non-Lambertian angular distribution, especially for bands 1 (UV) and 4 (SWIR).
Spectral radiance of the integrating sphere was calibrated at a direction perpendicular to the aperture and its angular distribution was not calibrated before launch. As TANSO-CAI has a wide field of view, the pre-launch data other than the center pixel has to be corrected as follows. The telescope optics of bands 1 and 4 have very small vignetting while bands 2 and 3 have large vignetting. Therefore, the angular distribution of bands 1 and 4 can be corrected.
Pixel-to-pixel Non-uniformity Correction
To check pixel-to-pixel uniformity, we assume the averaged earth albedo is uniform distributed when TANSO-CAI data acquired from all the 44 paths over one year. The earth albedo is defined as the measured reflectance at the top of the atmosphere. By correcting Rayleigh scattering and sun glint effect, pixel-to-pixel non-uniformity can be detected and corrected using the averaged measured data for Band 1. There was no need for pixel-to-pixel correction for Band 2. For Band 3, local bump structures are corrected using one-year averaged data. Band 4 is corrected using one-year averaged data, except for several pixels for which dark current has increased. These corrected radiance conversion factors are used for the TANSO-CAI Level 1B product.
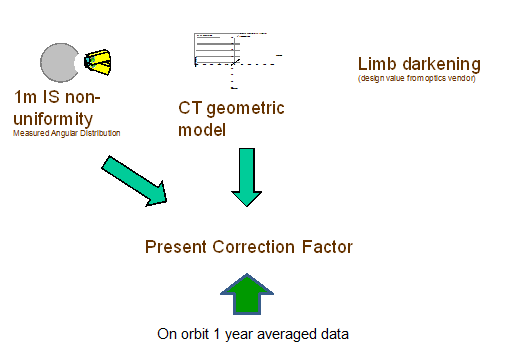
Sources for determining and correcting the radiance conversion factors for TANSO-CAI.

Radiance conversion factors for the TANSO-CAI Band 1. after the pixel-to-pixel non-uniformity correction.
Issues for TANSO-CAI (with Electronic Scanning)
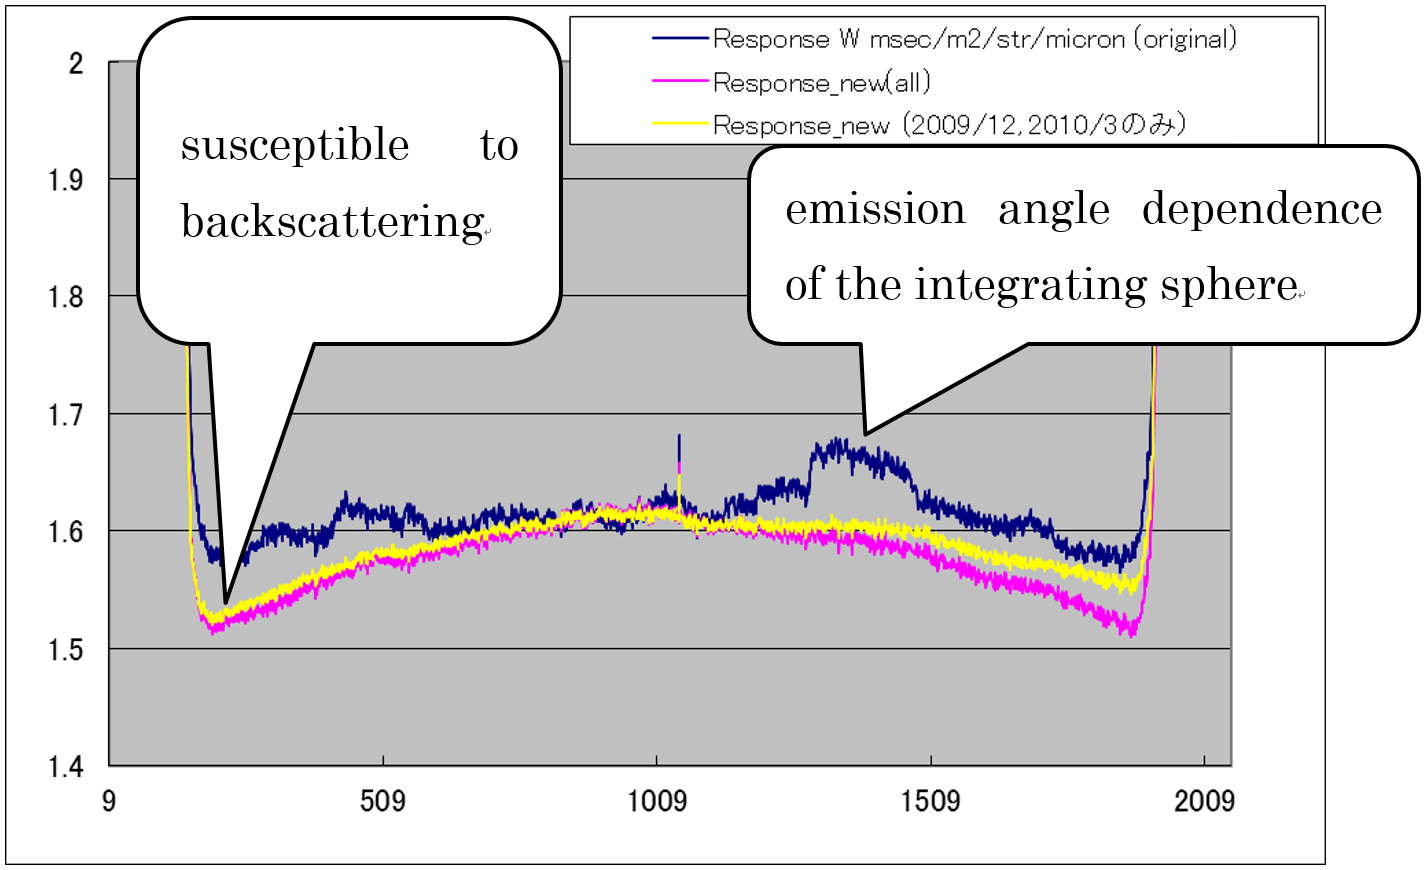
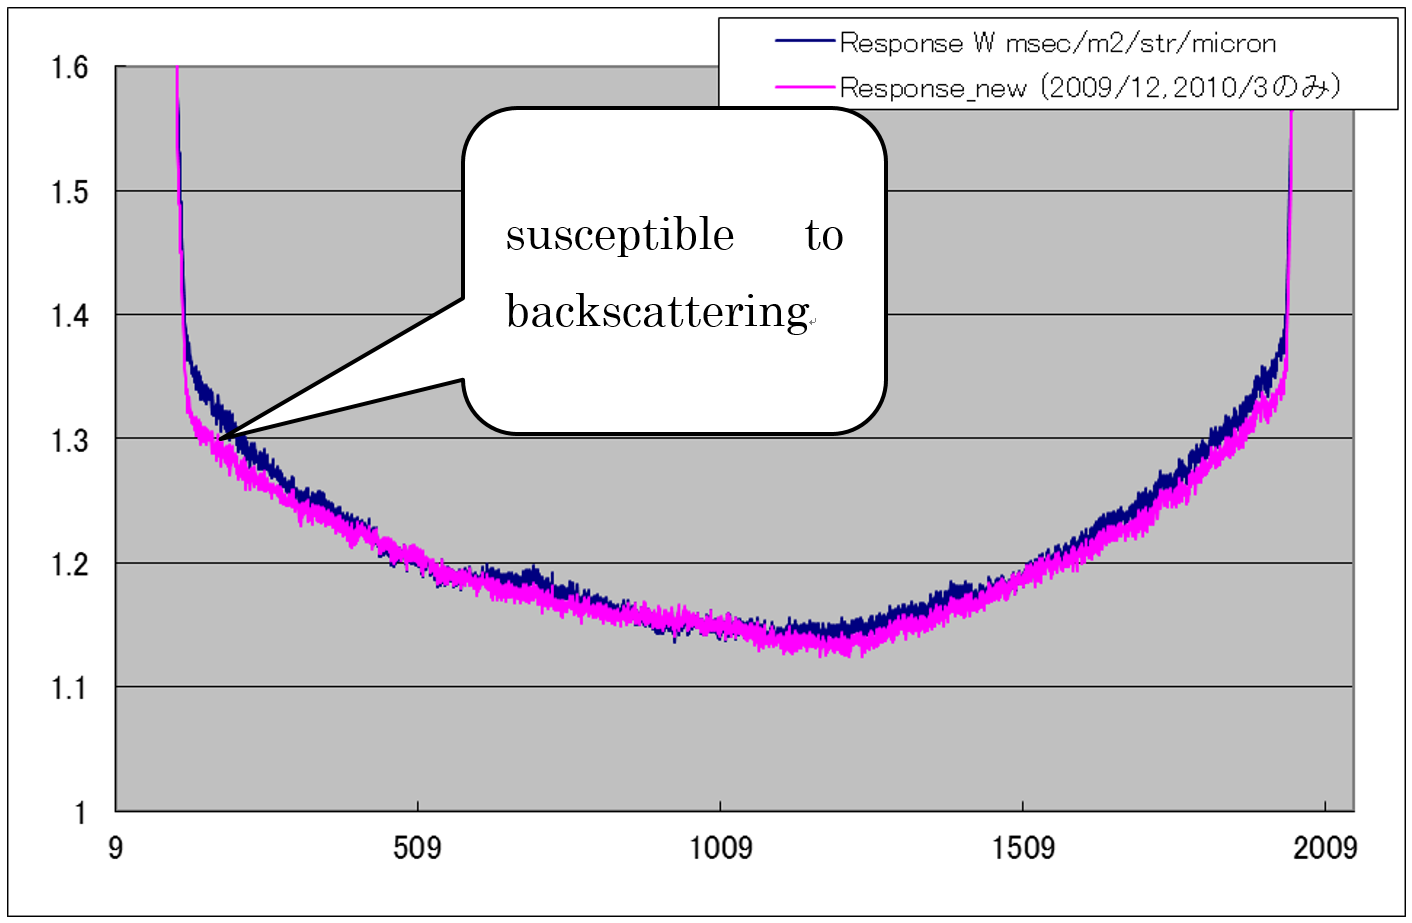
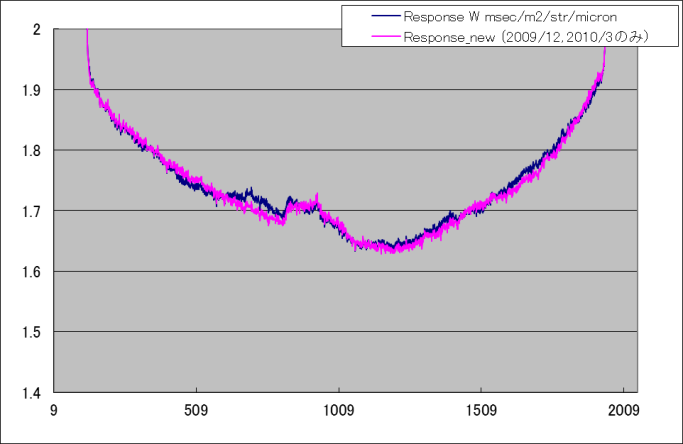
In the prelaunch calibration, we neglected the emission angle dependence of the integrating sphere and calibrated the whole pixels of TANSO-CAI at a time. Therefore in Aug. 2008, we corrected the radiance conversion factors by measuring the emission angle dependence of the integrating sphere, and by assuming that the earth's surface albedo is random and the 1-year global average for each pixel is equal (; Rayleigh scattering is partly accounted). We provide with the pixel-to-pixel sensitivity correction data based on the manufacture's design value of vignetting with the following issues:
- Only specific pixels can be calibrated in vicarious calibration in RRV or in lunar calibration.
- The prelaunch calibration data vary with pixels because of their insufficient SNR.
- The assumption of uniformity of the 1-year global average may bring underestimation of the correction factors for low-numbered pixels (east side) as they always see higher reflectance if the back reflection is stronger due to the sun synchronous orbit considering the BRDF.
- The emission angle dependence of the integrating sphere was evaluated at the center of the integrating sphere aperture and its representativeness is not evaluated.
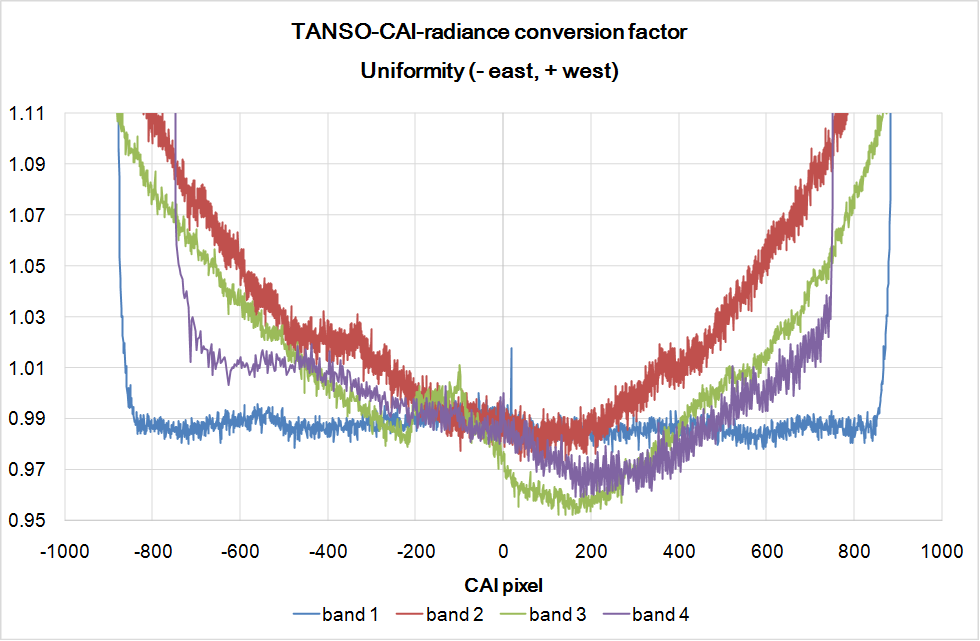
Current radiance conversion factors for TANSO-CAI
Band1: In addition to the emission angle dependence of the integrating sphere, the radiometric response function is affected by Rayleigh scattering and backscattering.
Band2: Disagree with the prelaunch calibration at east end.
Band3: Agree well with the prelaunch calibration.
Cross Calibration
TANSO-FTS (SWIR)
GOSAT and the Orbiting Carbon Observatory (OCO) by NASA's Jet Propulsion Laboratory (JPL) both detect absorptions at the 0.76-µm O2 band and at the weak and strong CO2 bands at 1.6 and 2.0 µm. In order to establish the uncertainties and biases between the respective data products, the OCO and GOSAT teams planned a number of cross-comparison studies. The first of these was the validation of the prelaunch absolute radiometric calibrations. The cross-comparison campaign was performed at JPL in 2008. The OCO reference detectors and three GOSAT radiometers viewed the OCO sphere and radiometric standard. The overall agreements between the OCO calibration and GOSAT measurement of the OCO integrating sphere were 1.5% at 0.76 µm, 2.7%±1.1% at 1.6 µm, and 0.2%±4.1% at 2.0 µm. To validate the GOSAT preflight calibration, the cross-calibration experiment continued at JAXA's Tsukuba Space Center, where the same radiometers measured the two GOSAT spheres. Agreements were better than 1.8% at 0.76 µm, 1.6% at 1.6 µm, and 1.4% at 2.0 µm.
The Airborne Visible/InfraRed Imaging Spectrometer (AVIRIS) on ER-2 aircraft flew over RRV twice at the time of GOSAT overpass on Oct. 9, 2009 and Jun. 20, 2011. Cross calibrations between AVIRIS and GOSAT independently corroborated the vicarious calibration results and showed a similar trend of degradation.
Inter-comparison with the well-calibrated Visible Infrared Imaging Radiometer Suite (VIIRS) radiometer onboard The Suomi National Polar-orbiting Partnership (SUOMI-NPP) also shows long-term agreement with the TANSO-FTS RDF model within the allocated error budget [Uprety et. al., 2015].
TANSO-FTS (TIR)
The spectral radiance has been compared at high latitude by using simultaneous nadir overpasses of Infrared Atmospheric Sounding Interferometer (IASI). IASI data can be found within 100 km of the GOSAT field of view and within 10 degrees of nadir. The difference in brightness temperature between 200 K and 270 K is smaller than ±1 K [Knuteson, private communication, Feb. 28, 2011]. For an atmospheric window region around 10 µm where the radiation from the surface is dominant, it is very difficult for IASI and GOSAT to view exactly the same location at the same time.
TANSO-CAI
A preliminary comparison between AVIRIS (a simultaneous airplane flight) and TANSO-CAI led to similar calibration results compared to the vicarious calibration [Kuze et al., 2011].
Onboard Calibration
TANSO-FTS (SWIR)
The back side of the Spectralon diffuser plate is exposed for a shot time once a month. If the degradation is proportional to the exposure time, it is safe to assume that the back side has not been degraded. Therefore, the back side calibration data permit monitoring of the relative degradation. For this analysis, the sun and earth seasonal variation in distance was also corrected. Fig. 3 (a) shows the ratio between the front and back sides of the solar diffuser plate calibrations. The figure shows a large degradation in TANSO-FTS Band 1 on the diffuser's front surface, but slowing down of the degradation with time. Fig. 3 (b) shows monthly solar calibration data using the diffuser plate's back side. The curve indicates the on-orbit radiometric response change of the instrument itself. In the first year after launch, the degradation of both the diffuser and the TANSO-FTS throughput was fast. However, the degradation became considerably slower in the following year.
The degradations occur slightly more rapidly for the S-polarization than for the P-polarization in Band 1. The most probable degradation portion is the FTS beam splitter efficiency. After correction of the Spectralon diffuser bidirectional reflectance distribution function (BRDF) and the distance from the sun, the seasonal variation remains. Possible causes are the temperature-dependent band 1 modulation efficiency, imperfect BRDF correction, and earthshine contamination [Toon et al, 2015]. The prelaunch data show a temperature dependency in the modulation efficiency.
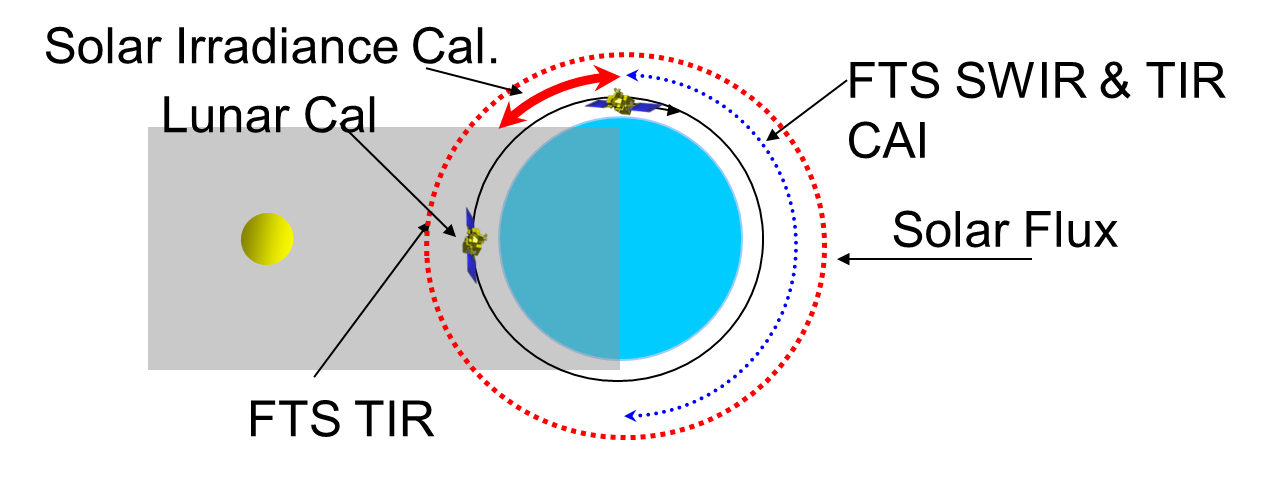
Fig. 2 Plans for regular TANSO-FTS and CAI operation on-orbit.
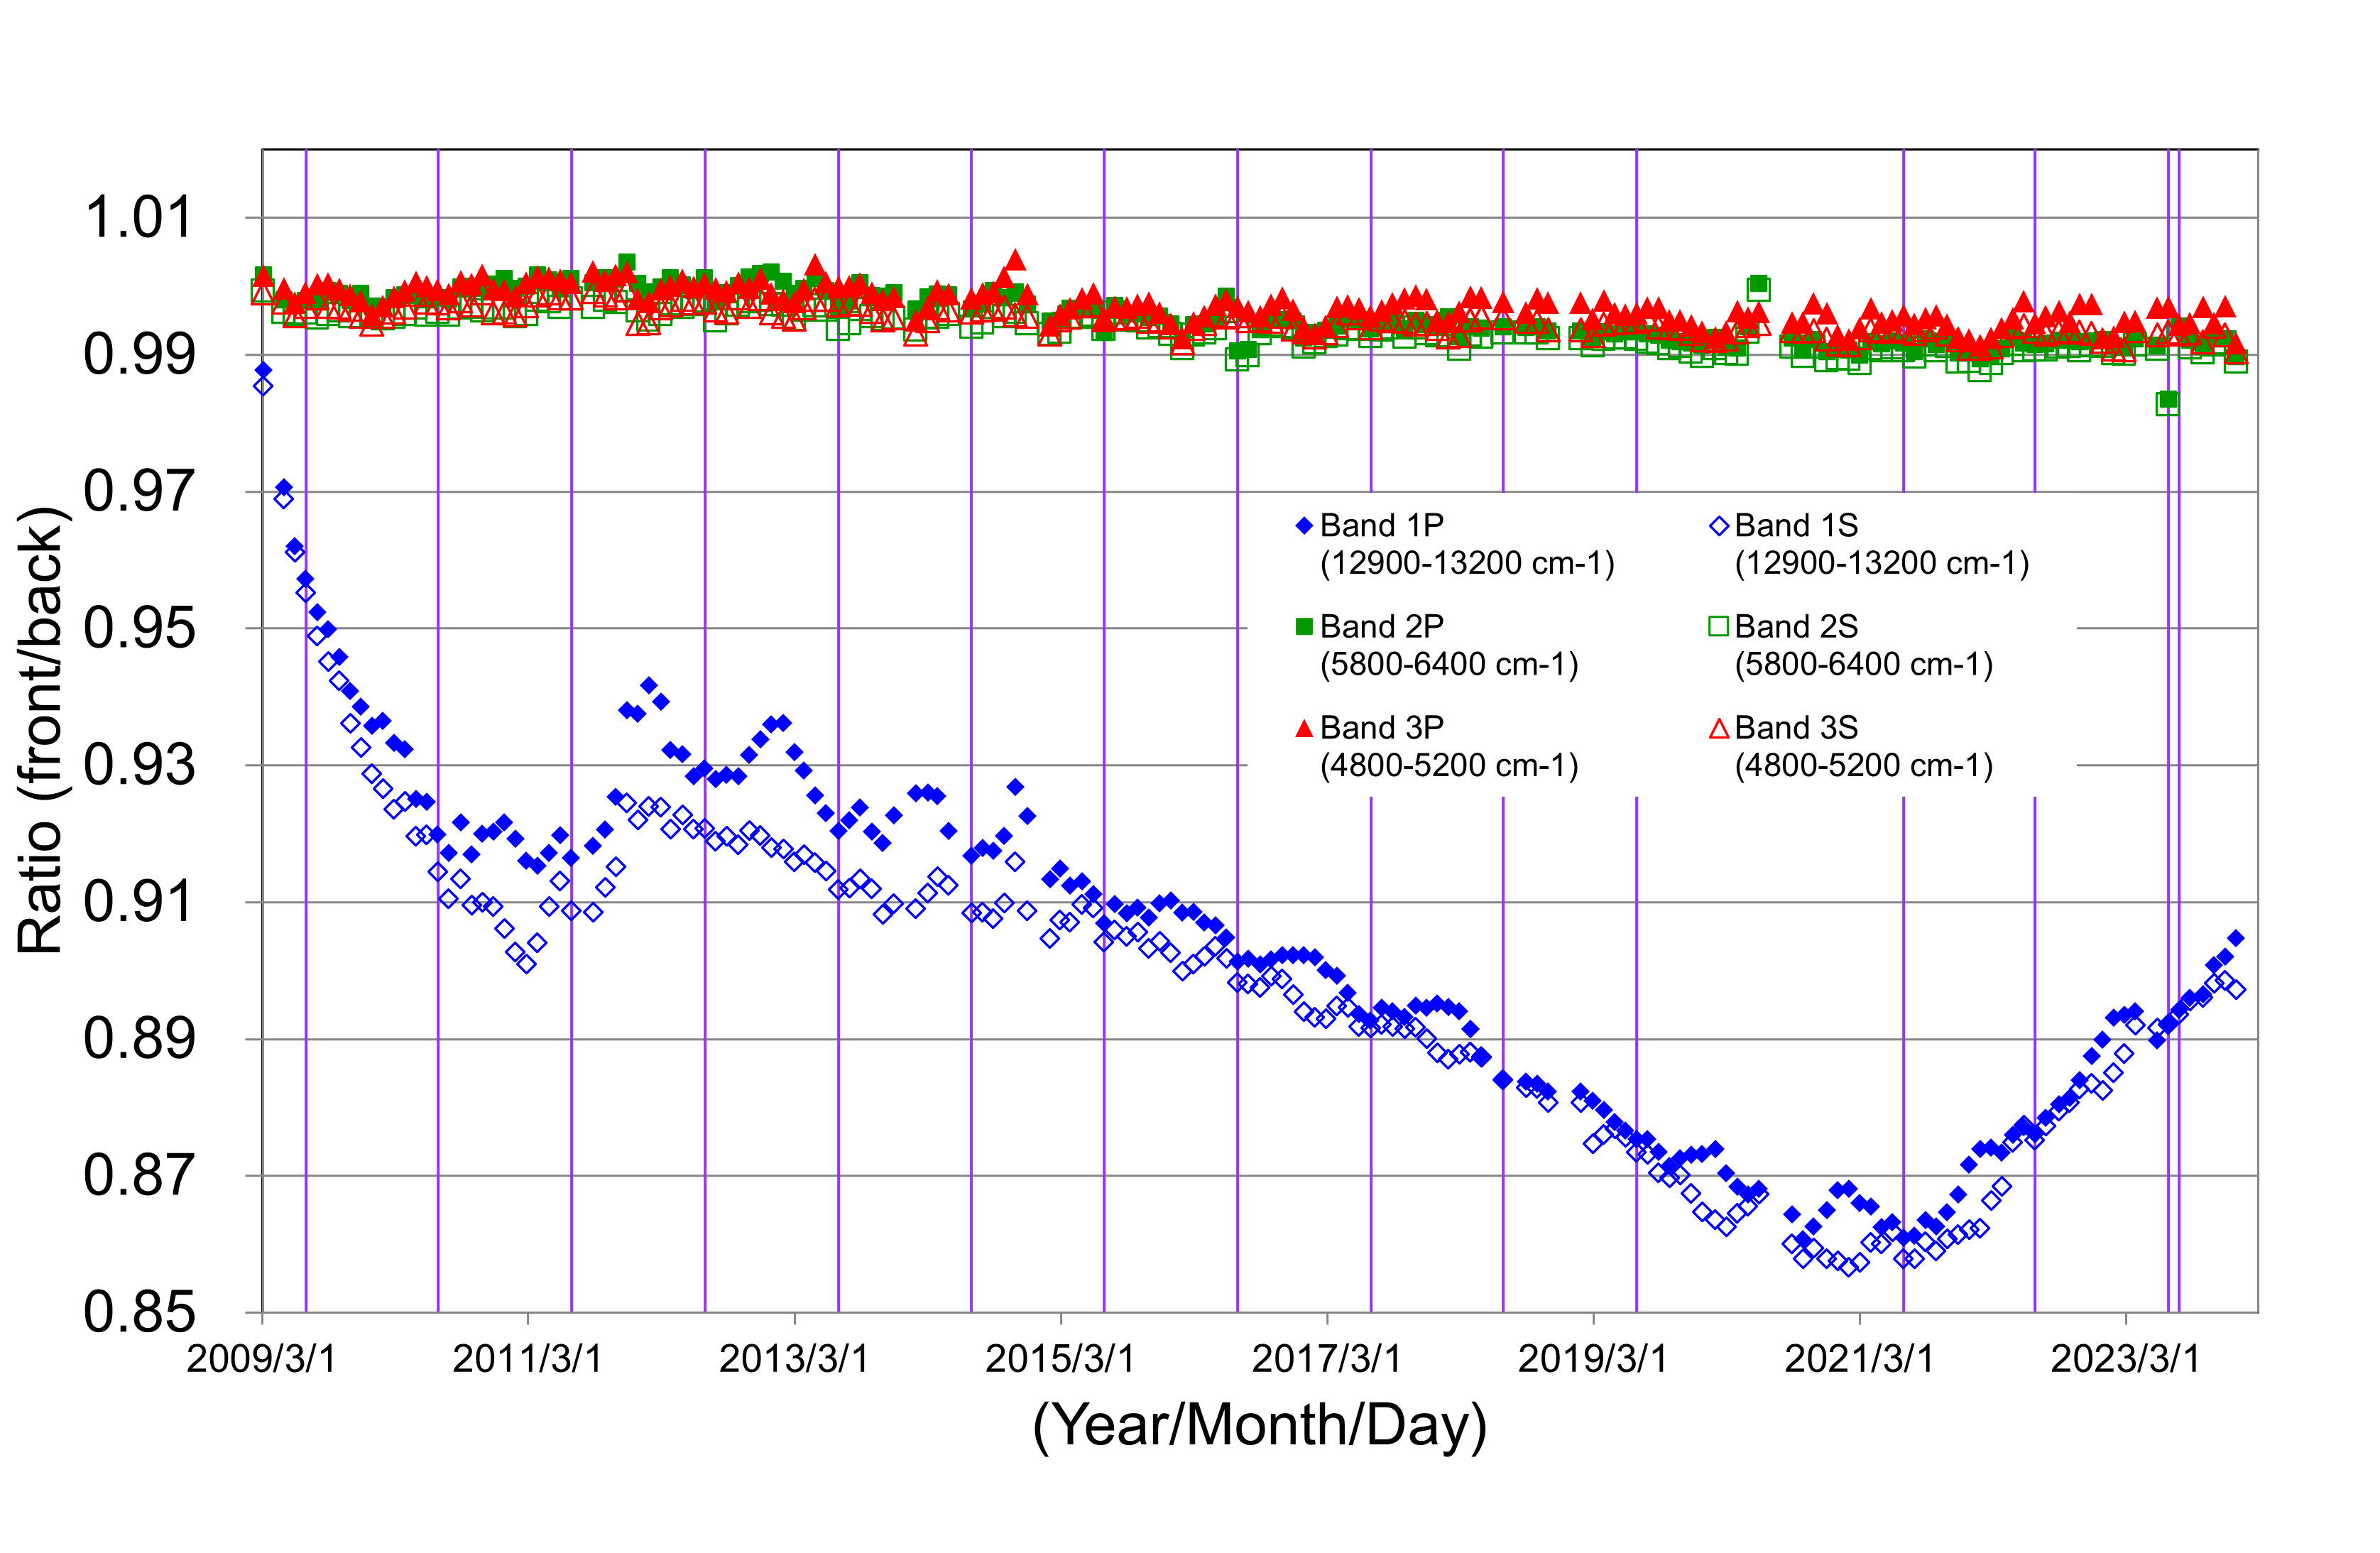
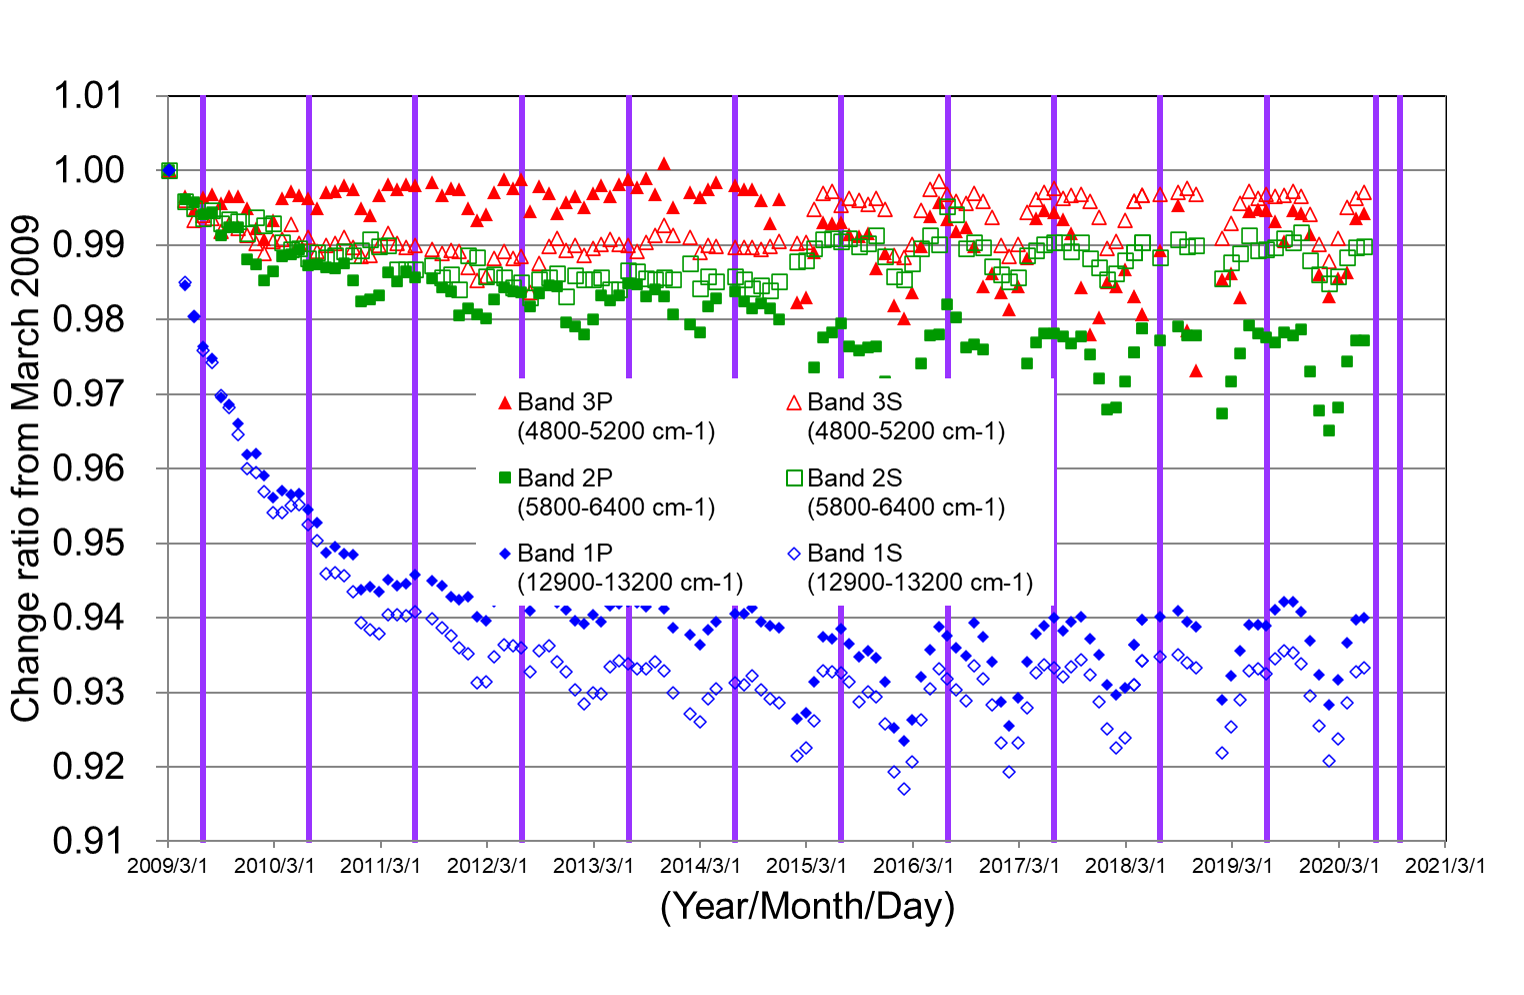
Fig. 3 Solar irradiance monthly calibration data from the onboard Spectralon diffuser, which indicates the change from the first measurement in space after correction for the distance between the satellite and the sun and the angle of incidence of the solar beam upon the diffuser. The vertical lines represent the time of the 2009-2018 vicarious campaigns: (a) ratio of the front side radiance to the back side and (b) back side calibration.
TANSO-FTS (TIR)
TIR spectral radiance is calibrated frequently by looking at deep space and the onboard blackbody. Onboard calibration accuracy does not change with time unless the temperature sensor degrades.
TANSO-CAI
In monthly "Night Observation mode" measurements, dark current levels of the TANSO-CAI sensor are monitored. Figure shows the long-term temporal variations in the dark current levels averaged over the even-number pixels or the odd-number pixels in each band. Those in Band 1, 2, and 3 are gradually increasing.
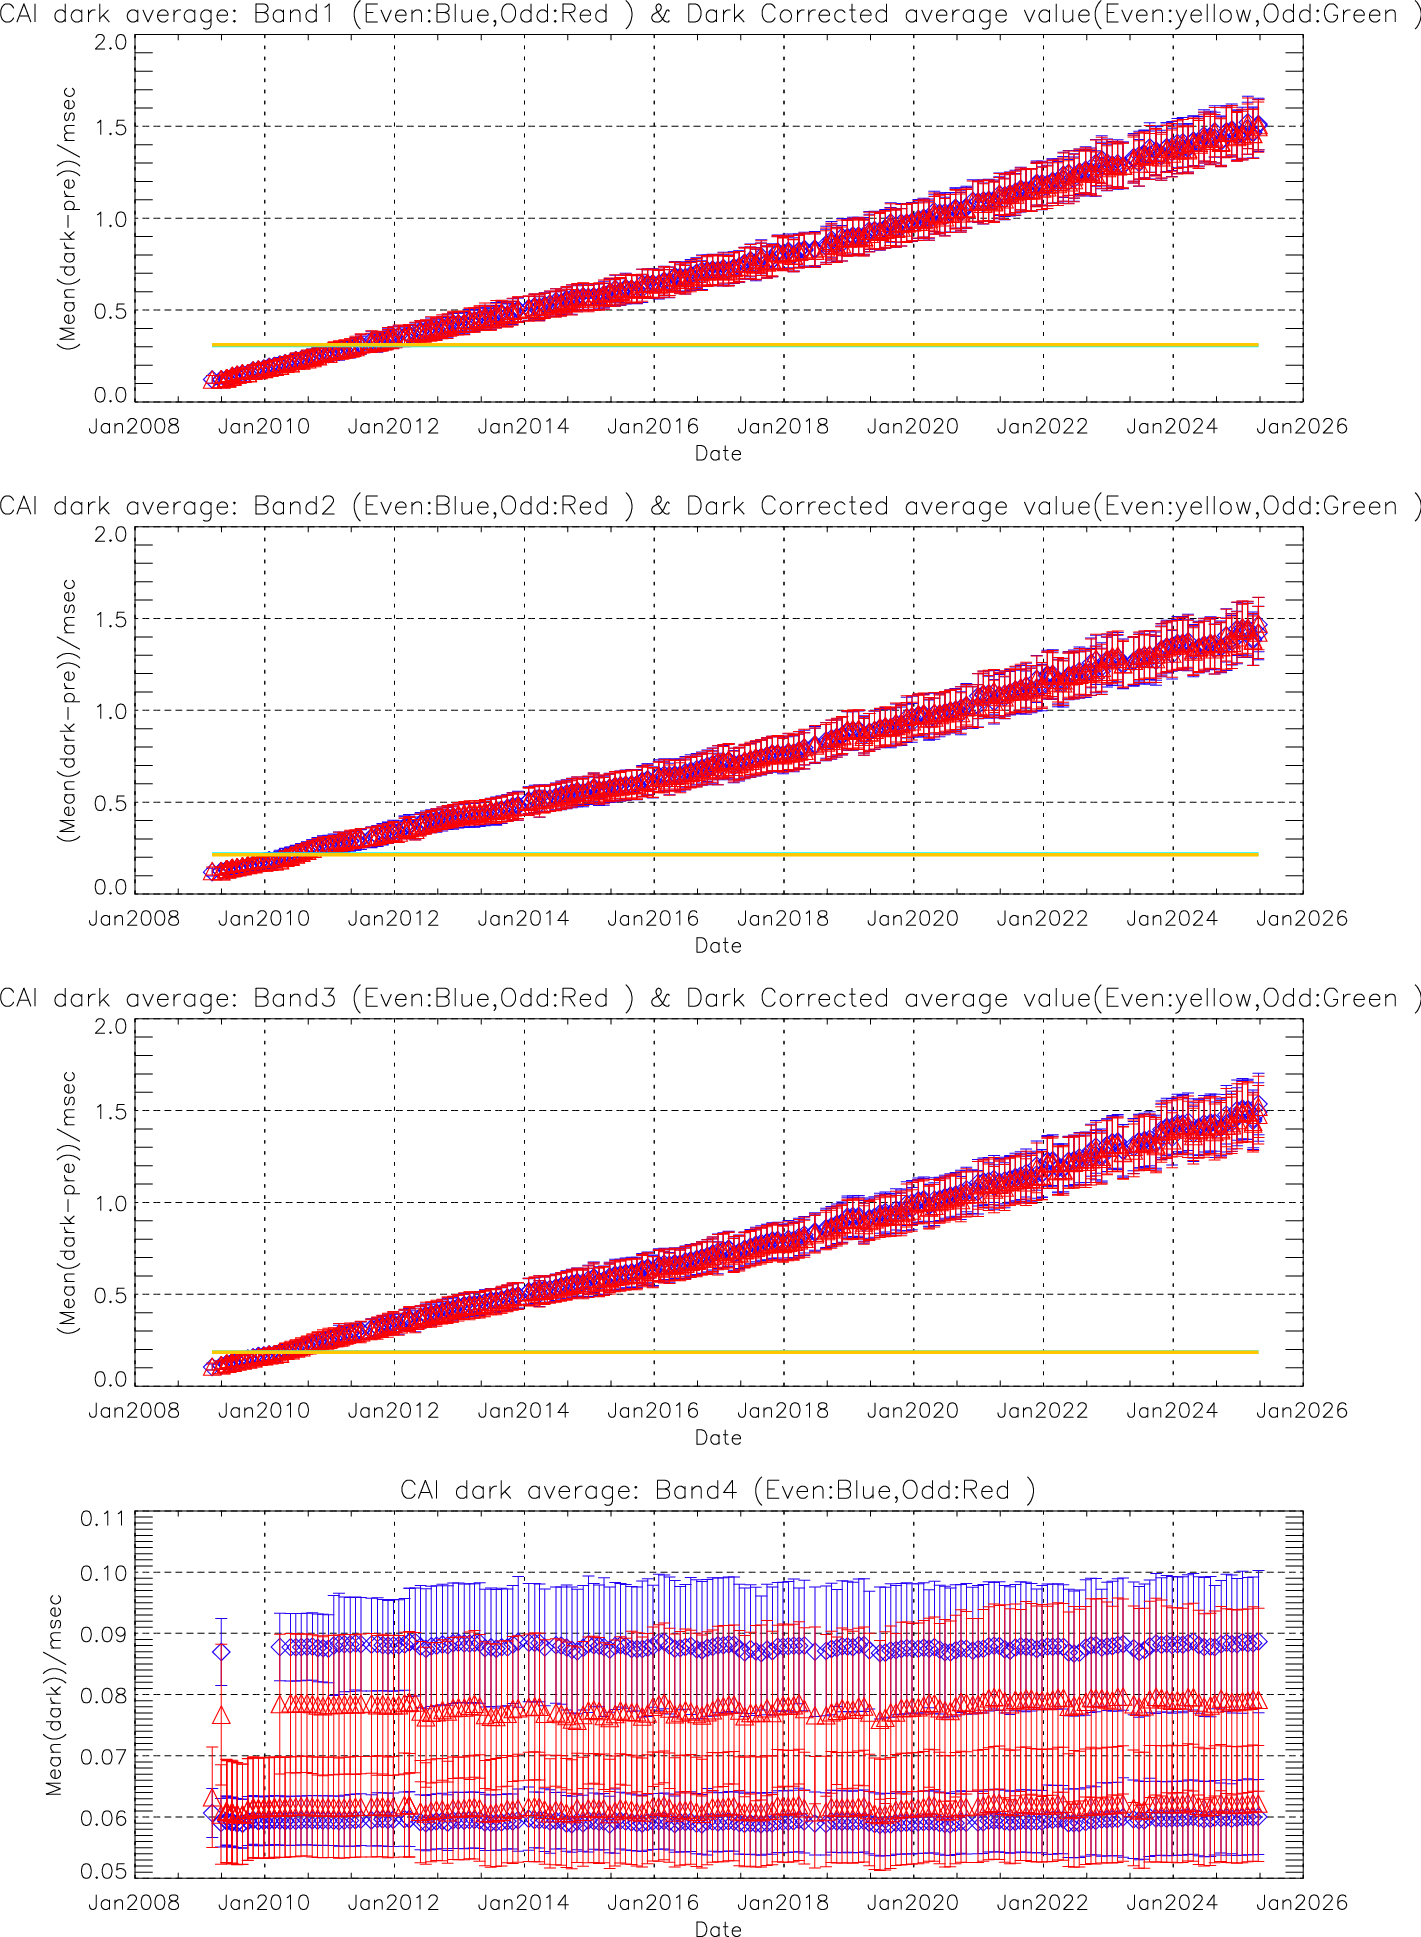
Temporal variations in the dark current levels averaged over the even number pixels or the odd number pixels of each TANSO-CAI band.
From time to time, pixels with poor sensitivities (bad pixels) were identified in Band 4. The accumulation status of the Band 4 bad pixels is summarized in table. Some bad pixels can be visually identified as vertical lines in Figure.
The latest dark level coefficient information is available for download here.
Past csv files are available for download on the following page.
csv file list
| 01 | 02 | 03 | 04 | 05 | 06 | 07 | 08 | 09 | 10 | 11 | 12 | |
|---|---|---|---|---|---|---|---|---|---|---|---|---|
| 2009 | 154 (04/29) |
18 (08/27) |
221 (10/26) |
174 (12/25) |
||||||||
| 2010 | 147 (03/25) |
481 (05/24) |
351 (09/24) |
310 (10/24) |
383 (12/23) |
|||||||
| 2011 | 248 (06/24) |
428 (08/23) |
121 (12/24) |
|||||||||
| 2012 | 229 (04/25) |
|||||||||||
| 2013 | 375 418 (02/25) |
42 (05/23) |
291 (06/25) |
254 (08/23) |
||||||||
| 2014 | 420 (01/24) |
76 377 (08/25) |
238 (09/24) |
206 (10/24) |
||||||||
| 2015 | 459 (01/25) |
356 (08/26) |
114 (09/25) |
77 (12/24) |
||||||||
| 2016 | 240 (03/26) |
382 (08/26) |
24 (09/25) |
|||||||||
| 2017 | 166 410 (06/25) |
512 (08/24) |
||||||||||
| 2018 | 233(01/25) | 207 426 (03/25) |
198 (09/24) |
|||||||||
| 2019 | 232 (10/22) |
|||||||||||
| 2020 | 452 (04/25) |
38 (05/25) |
146 (09/22) |
34 272 (11/28) |
||||||||
| 2021 | 266 (08/24) |
299 465 (12/22) |
||||||||||
| 2022 | 413 (01/21) |
346 (02/20) |
124 (05/21) |
205 439 (08/25) |
148 (09/24) |
|||||||
| 2023 | 313 (03/23) |
196 (07/21) |
||||||||||
| 2024 | 169 (01/23) |
33 371 (05/22) |
298 (07/28) |
|||||||||
| 2025 | 46 (02/22) |
90 (05/23) |
335 (07/22) |
|||||||||
| 2026 | 306 (03/25) |
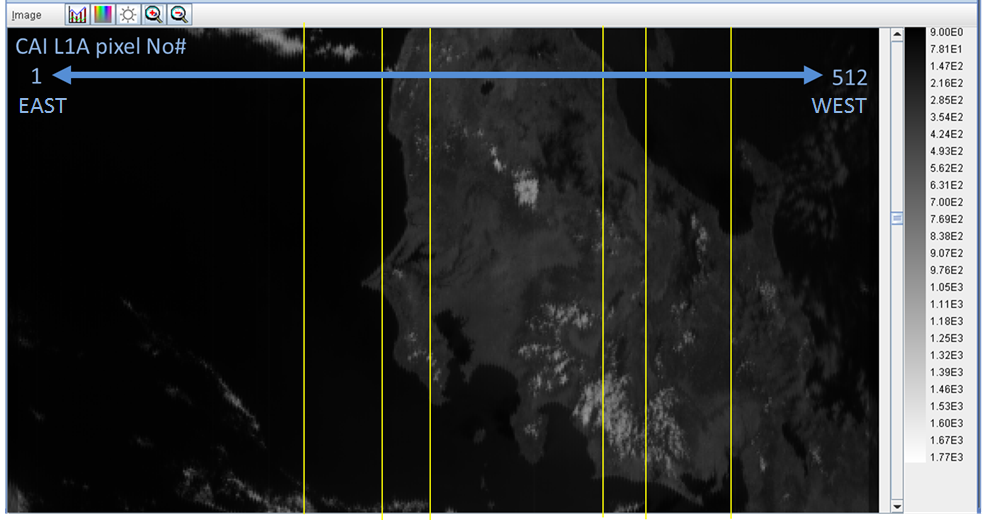
Example of bad pixels (yellow-colored lines) in TANSO-CAI Band 4(CAI L1A pixel No#1 (East) ~ No#512(West))
Lunar Calibration
The lunar surface has diffusive and temporally stable reflectance in SWIR. By pitch-maneuvering, FOV of the GOSAT instruments is pointed to the center of the full moon during night. At first, TANSO-FTS views the moon disk of 9.0 mrad wide, which is smaller than the IFOV of 15.8 mrad in such a way that spatially-averaged albedo can be measured in all SWIR bands as a secondary calibration standard. Then by slightly rotating the satellite, TANSO-CAI can vertically scan the full disk of the moon surface. The lunar calibration is the only onboard calibration method for TANSO-CAI.
Twice every year, in April or May, and just after the summer time VCC, lunar calibrations have been conducted for both TANSO-FTS and CAI. The lunar radiometric calibration is consistent with the VCC within the error budgets [Shiomi et al., 2013]. After the solar paddle anomaly, the lunar calibration was suspended to avoid extreme power consumption of the batteries.
