Please refer to the link for data use.
TANSO-CAI
TANSO-FTS


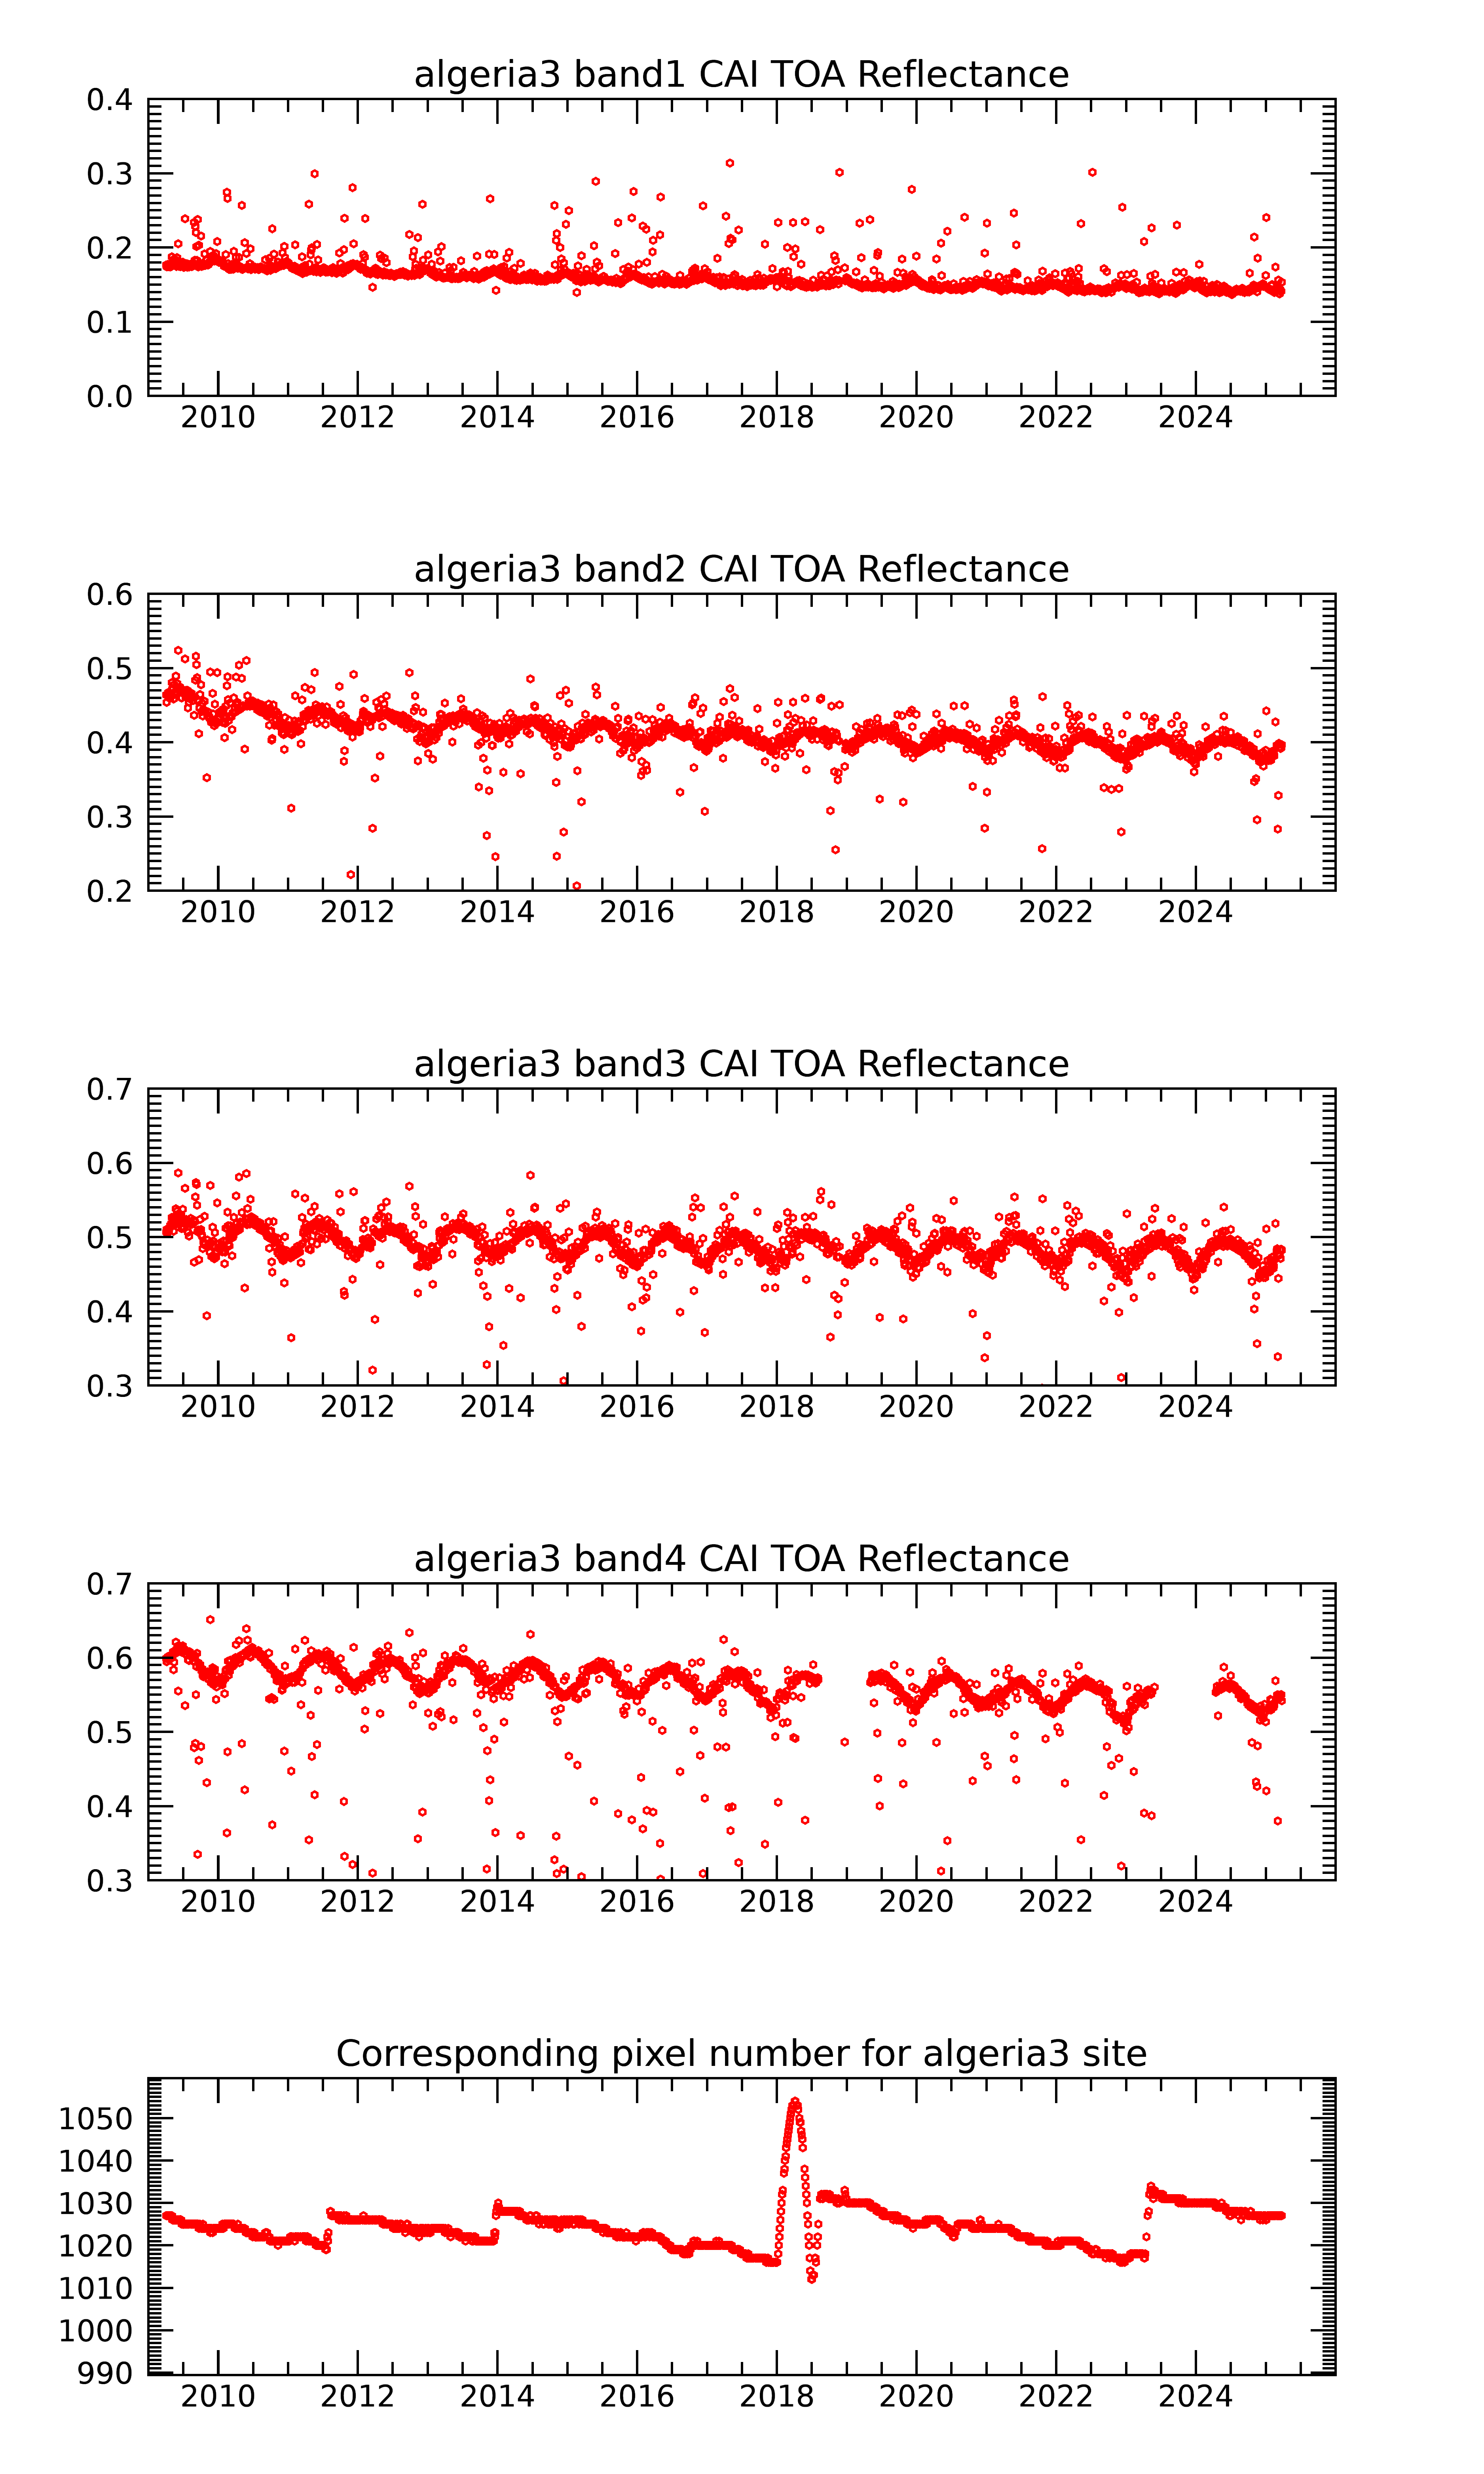
TANSO-CAI
Measured top of atmosphere reflectance change since the year 2009 of the launch and corresponding pixel number for each site.
TANSO-CAI L1B version
- 2009/04/01- : V02.00.
※Cloud data screening with CAI L2 cloud flag.
Selection criteria of the TANSO-CAI monitor data
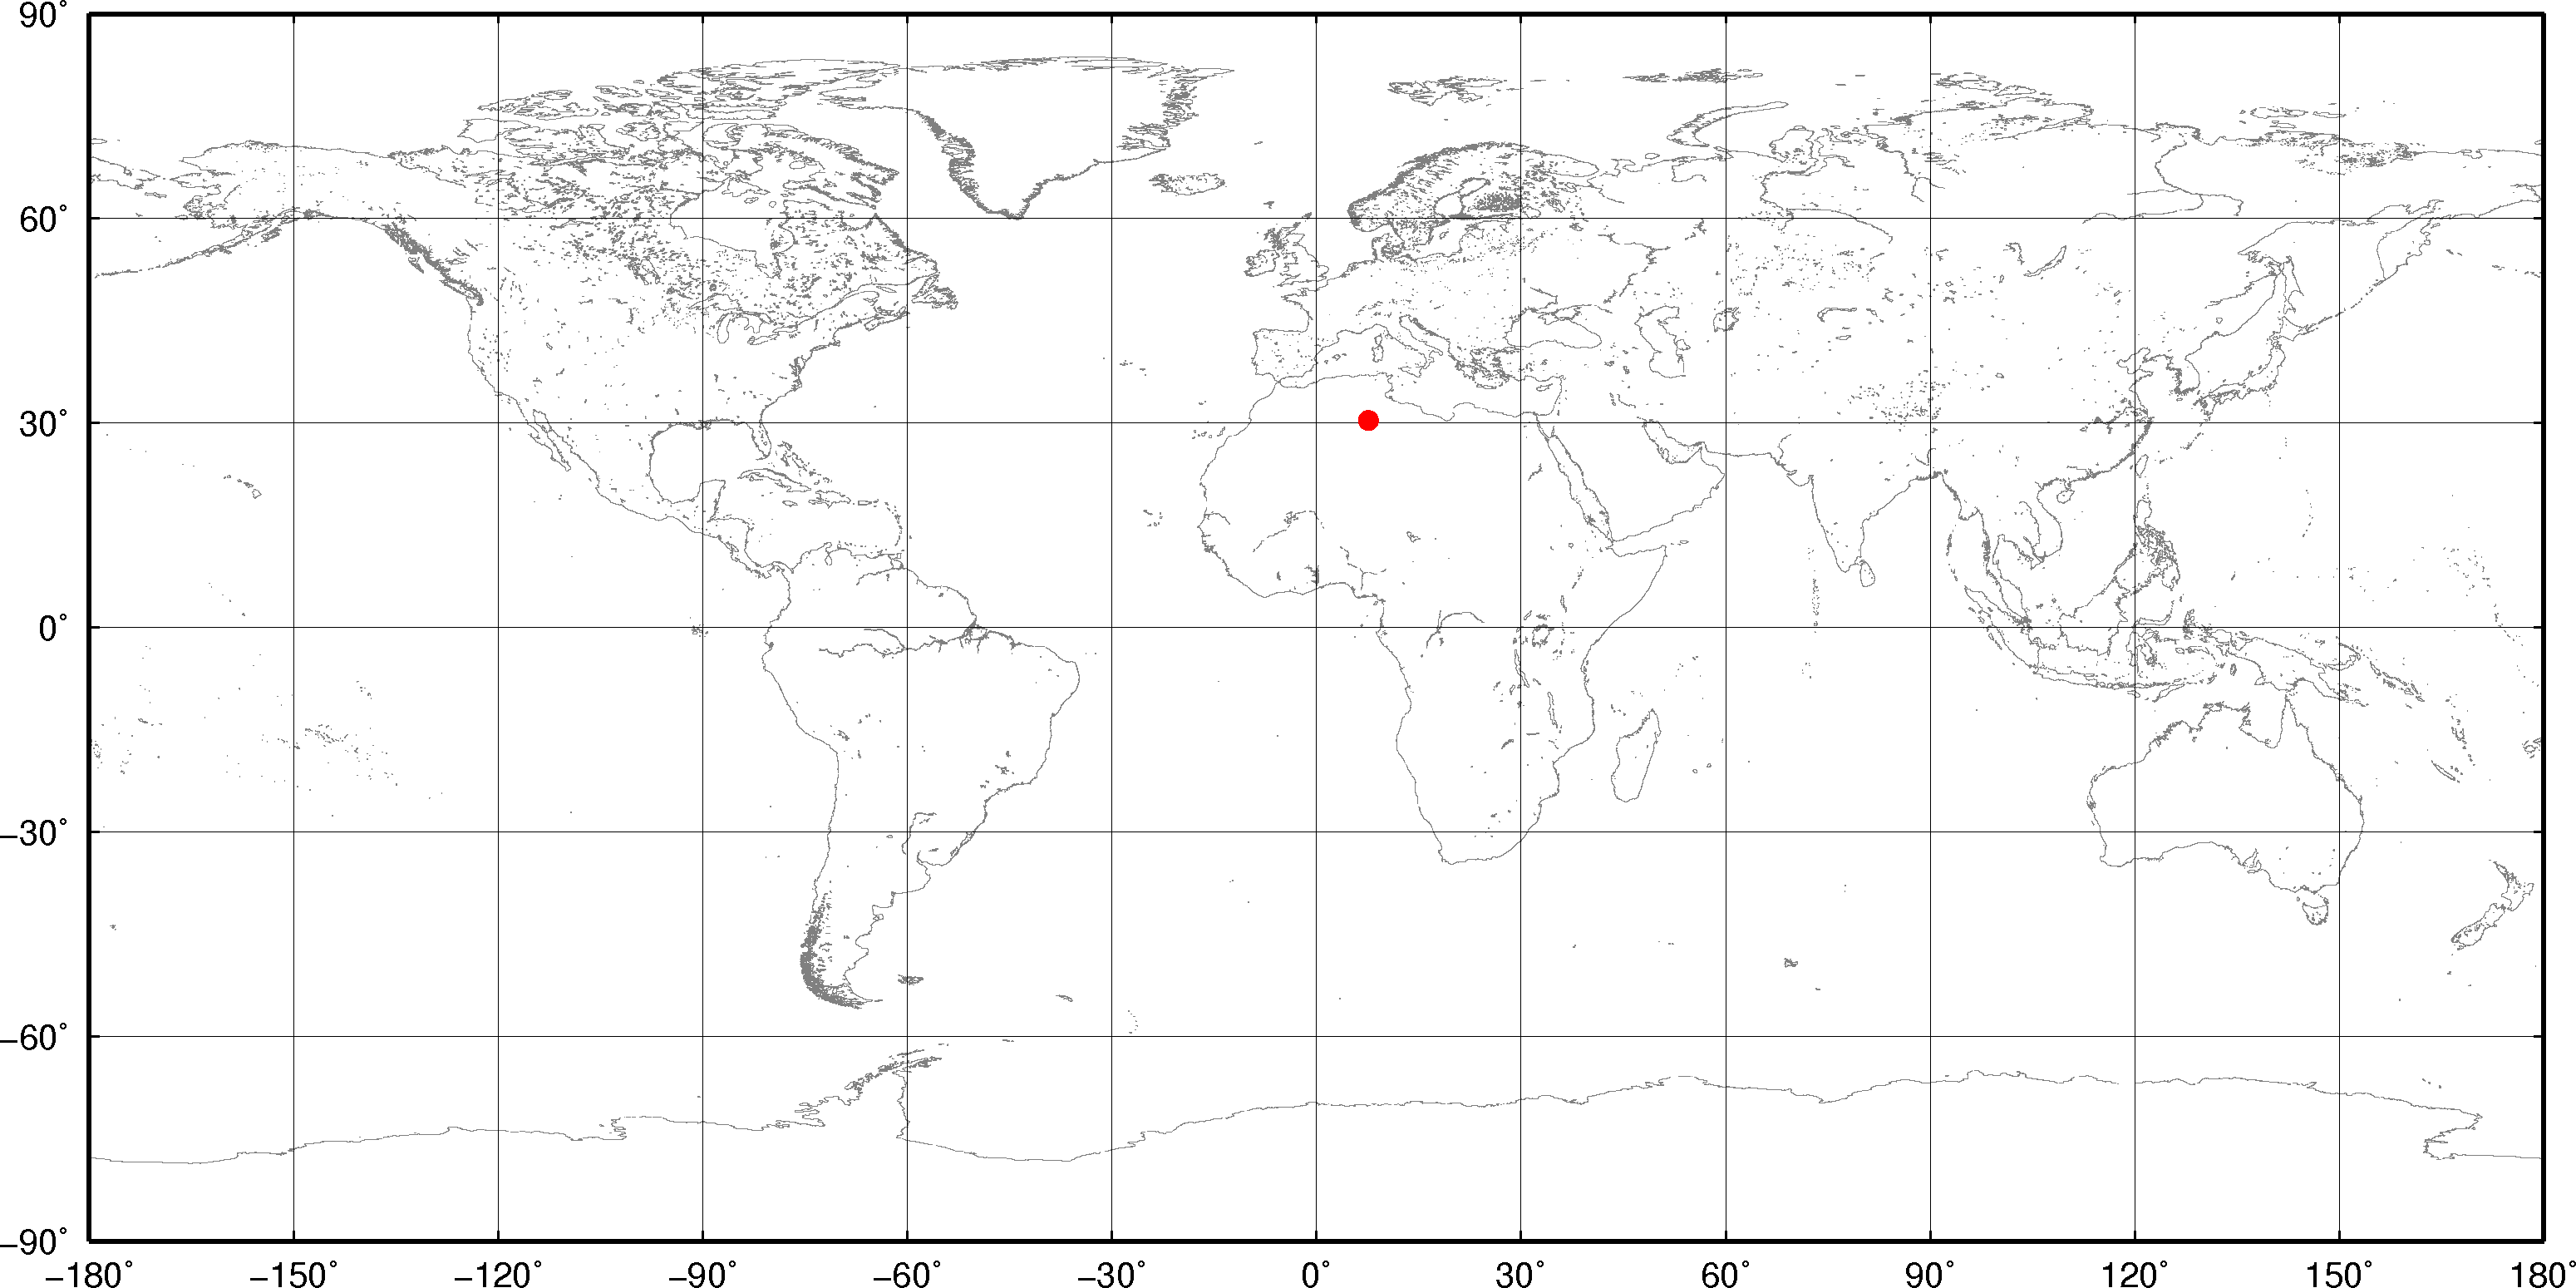
- Select the nearest pixel of the CEOS site.
- Select clear data with the TANSO-CAI cloud flag.
- Eliminate the TANSO-CAI band4 bad pixel.
Range of graph
- CAI:January 1~December 31
TANSO-CAI L1B version
- 2009/04/01- : V02.00.
Selection criteria of the TANSO-CAI monitor data
- Select the nearest pixel of the CEOS site.
- Select clear data with the TANSO-CAI cloud flag.
- Eliminate the TANSO-CAI band4 bad pixel.
Range of graph
- CAI:January 1~December 31
TANSO-FTS
Radiance monitor
Tb: Brighteness Temperature (calculated by Plank's law)
TANSO-FTS L1B version
- 2009/04/01~ : V300300
※Cloud data screening with brightness temperature at window channel.
- Red plots mean FTS grid observation.
- Green plots mean FTS target observation.
Selection criteria of the TANSO-FTS monitor data
- Select the TANSO-FTS exposure within 1 [deg.] of the CEOS site.
(※Railroad valley: within 0.09 [deg.] of the site.)
- Cloud screening by radiance ratio of band1 WN1(13019.0[cm^-1]) / band2 WN6(6394.0[cm^-1]).
Radiance ratio threshold
- Algeria2:0.90, Algeria3:0.88, Egypt1:0.88, Libya4:0.90, Niger2:0.86, Railroad valley:1.15, Winton:1.00, Gobabeb:1.20
Range of graph
- FTS:January 1~December 31
Wave name:
Tb: Brighteness Temperature (calculated by Plank's law)
TANSO-FTS L1B version
- 2009/04/01~ : V300300
- Red plots mean FTS grid observation.
- Green plots mean FTS target observation.
Selection criteria of the TANSO-FTS monitor data
- Select the TANSO-FTS exposure within 1 [deg.] of the CEOS site.
(※Railroad valley: within 0.09 [deg.] of the site.) - Cloud screening by radiance ratio of band1 WN1(13019.0[cm^-1]) / band2 WN6(6394.0[cm^-1]).
Radiance ratio threshold
- Algeria2:0.90, Algeria3:0.88, Egypt1:0.88, Libya4:0.90, Niger2:0.86, Railroad valley:1.15, Winton:1.00, Gobabeb:1.20
Range of graph
- FTS:January 1~December 31
