Myanmar was heavily flooded from May 2 to May 3, 2008, due to Cyclone Nargis. JAXA decided to activate the ALOS/PALSAR*1 to observe the area continuously after the flooding, and succeeded to image the area on June 4, 2008.
- *1 PALSAR, Phased Array type L-band Synthetic Aperture Radar, is a microwave sensor receiving radio wave reflections transmitted from the satellite. It can acquire image data regardless of the weather and time of day.
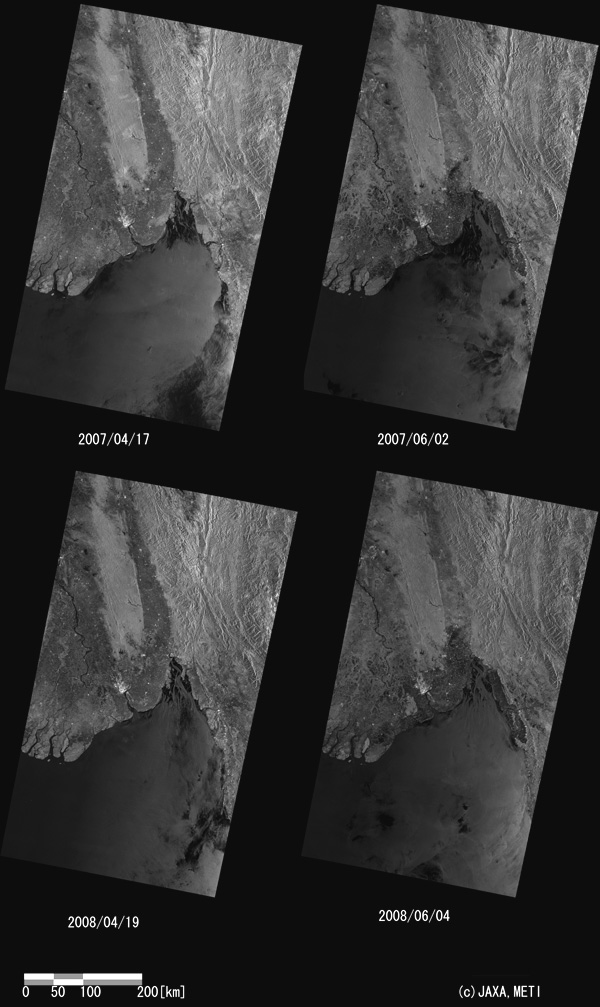
Fig. 1: PALSAR ScanSAR images on April 17, 2007 (top left), June 2, 2007 (top right),
April 19, 2008 (lower left), and June 4, 2008 (lower right).
(Click to View Enlarged Image)
The lower left of Fig. 1 shows a pre-disaster image observed with ScanSAR mode (350km width, Fig.4) on Apr. 19, 2008 and the lower right a post-disaster image observed on June 4, 2008. PALSAR measures the brightness of the land and ocean surface. The flat surface, like water, tends to look dark. Thus it is inferred from the June 4 image (the lower right of Fig.1) that large area were flooded (looks dark) after Apr. 19. On the other hand, in this area, a certain level of flooding occurs every year as a seasonal cycle between rainy and dry seasons. Since the rainy season generally starts from mid May, the expected flooded area in June 4, 2008 probably includes this seasonal cycle. Indeed the upper images of Fig.1, which are observed in April (the upper left) and June (upper right) 2007, also suggest the spreading of flooded area between April and June.
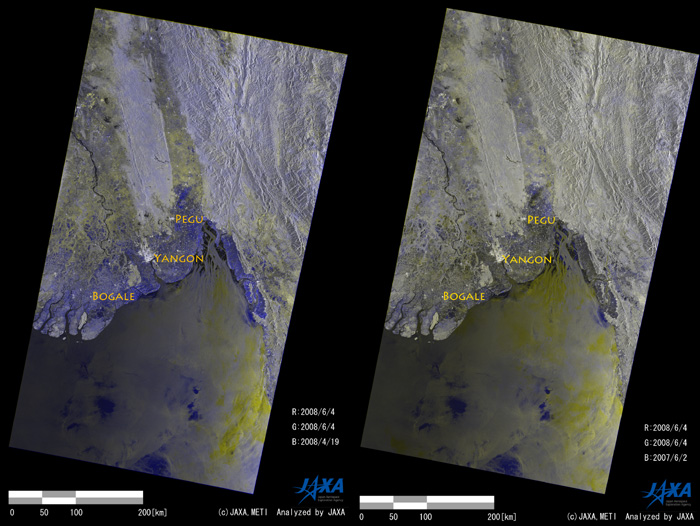
Fig. 2: Color composite images, (left) RED and GREEN for June 4, 2008 and BLUE for Apr. 19, 2008 and (right) RED and GREEN for June 4, 2008 and BLUE for June 2, 2007.
(Click to View Enlarged Image)
-
kmz file for Google Earth (6.71MB, low resolution, not orthorectified)

In order to highlight land surface changes, color composite images are created. Fig.2 left is a color composite representing the change between Apr. 19 and June 4, 2008, where the June 4 image is allocated in RED and GREEN channels and the April 19 in a BLUE one. BLUE color in the figure shows the flooded area expected and it spread out 20-100km inland from the coasts. As expected, a similar pattern is derived from the composite using the 2007 images (not shown). Here, in order to highlight the difference between June 2007 and 2008, the color composite is created by using the June 2, 2007 and June 4, 2008 images (Fig.2 right). The image shows some BLUE areas spreading especially around the river mouth of Irrawaddy and north of Pegu, which suggests that these areas are flooded in June 2008 different from in June 2007.
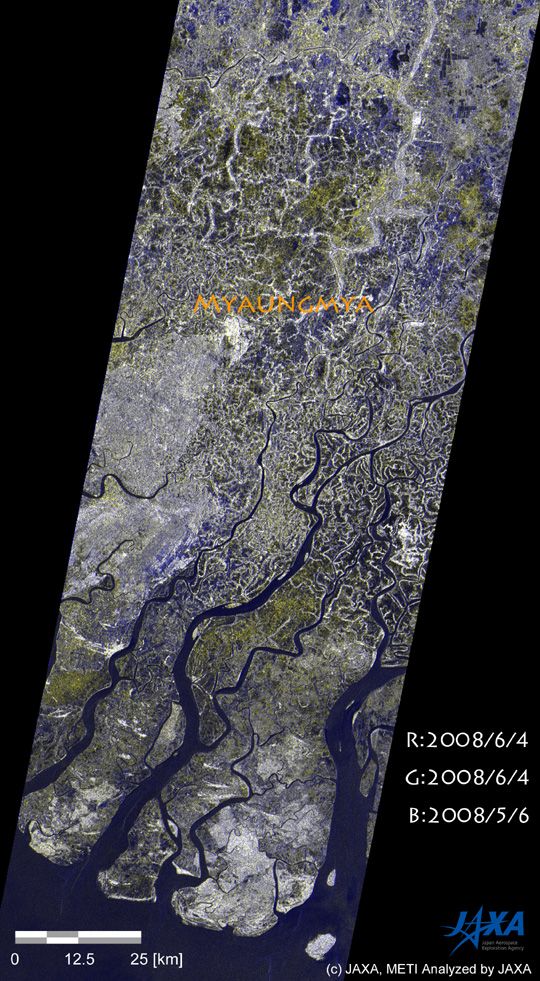
Fig. 3: A color composite image, RED and GREEN for June 4, 2008 and BLUE for May 6, 2008.
PALSAR conducted an emergency observation around the river mouth of Irrawaddy on May 6, 2008 just after the hit of Cyclone Nargis (related article: Myanmar flood water observation by PALSAR). It is possible to estimate changes in flooded areas during one month by comparing between the May 6 and June 6 images. The color composite of these images (Fig.3) shows YELLOW areas spreading around the river mouth of Irrawaddy and north of Myaungmya. Water levels in these areas are expected to lower. On the other hand, some BLUE areas exist, suggesting newly flooded areas probably due to the general rainy cycle.
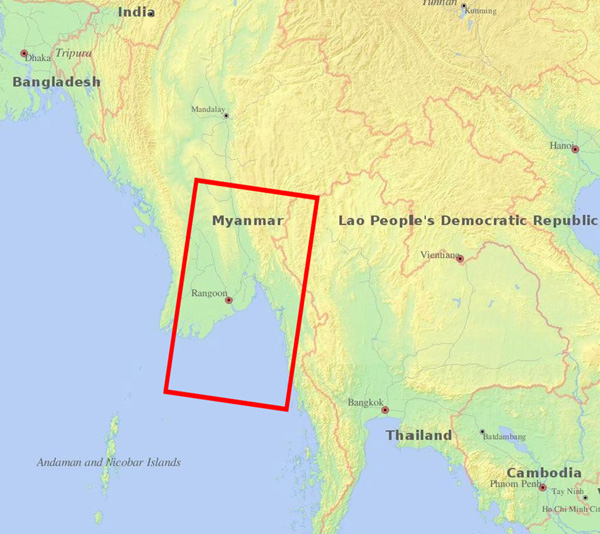
Fig.4: Map of observed area.
©JAXA EORC
Copyright©1997- JAXA EORC All rights reserved.