On January 3, 2009 (UTC), magnitude 7.6 and 7.4 earthquakes occurred off the northwestern coast of New Guinea Island, Indonesia. The Japan Aerospace Exploration Agency (JAXA) performed an emergency observation on January 14, 2009 using the Phased Array Type L-band Synthetic Aperture Radar (PALSAR) installed on the Advanced Land Observing Satellite (ALOS) to determine the state of damage caused by the earthquakes. In this report, we conducted differential interferometric SAR (DInSAR) analysis to detect crustal deformation and compared amplitude images taken before and after the earthquake to detect landslides using the data acquired on October 14, 2008. In our processing, we used precise orbital information.
1. Crustal Deformation
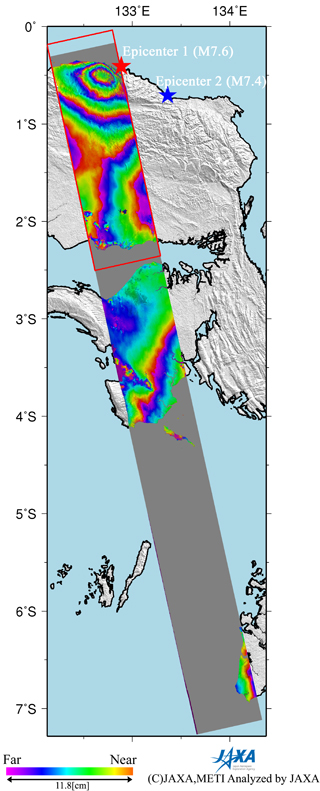
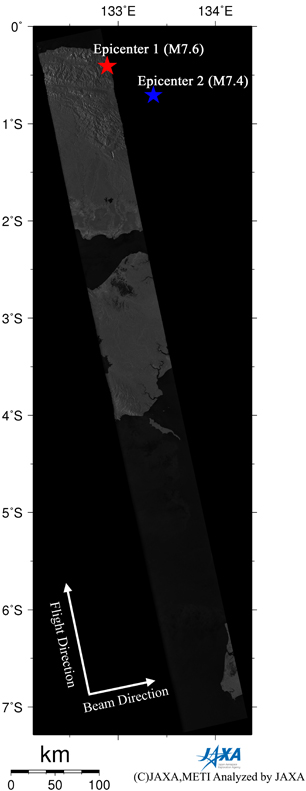
Fig.1: PALSAR Interferogram (left) and PALSAR Amplitude image (right)
(Click to View Enlarged Image)
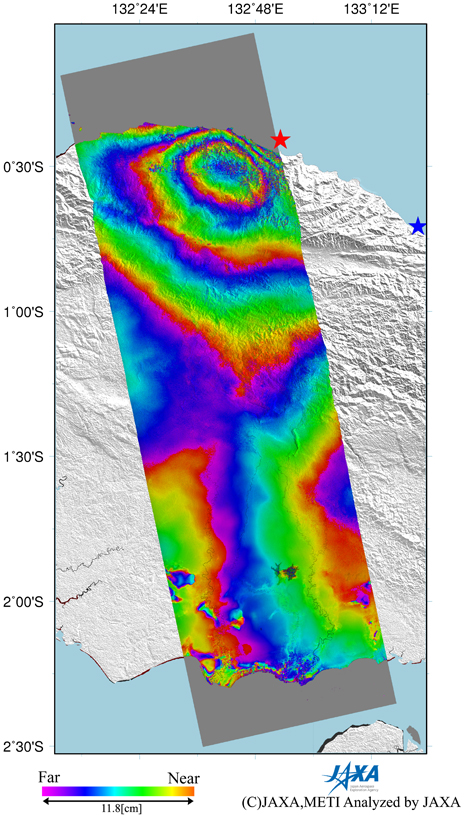
Fig.2: Enlarged interferogram of enclosed red rectangle in Fig. 1 left
(Click to View Enlarged Image)
Figure 1 left is an interferogram generated from PALSAR data acquired before and after the earthquake using the DInSAR technique. A color pattern illustrates changes of satellite-ground distance for the period. Figure 1 right is a PALSAR amplitude image acquired after the earthquake indicating an observation field of 700km from south to north. Figure 2 is an enlarged interferogram depicting the area close to the epicenter. There is an eyed pattern of color fringe southwest of the epicenter in the interferogram. This pattern is interpreted to represent a 35.4cm extension of satellite-ground distance at the center of the fringe. This indicates a northeastward horizontal displacement or subsidence caused by seismic faulting. Although other color fringes are found about 100km and 300km south of the epicenter, we interpreted that they are not crustal deformations caused by the earthquake but artifacts caused by meteorological noise or something.
* The color changes from blue, red, yellow, green, and back to blue indicating an extension of the satellite-ground distance, and one color cycle = 11.8cm.
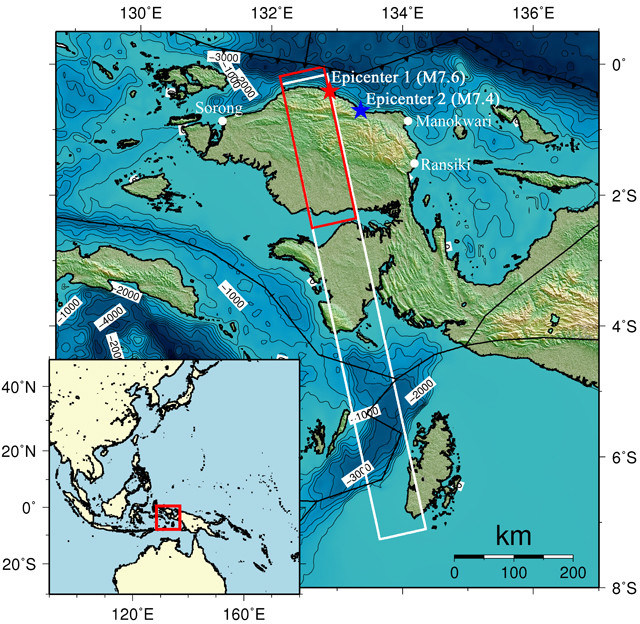
Fig.3: Overall view of the observation area (We refer to ETOPO2, SRTM3, and PB2002).
(Click to View Enlarged Image)
2. Landslides
PALSAR observed massive landslides caused by earthquakes, which were previously observed by the Advanced Visible and Near Infrared Radiometer type 2 (AVNIR-2) on January 5, 2009. Figure 4 presents PALSAR amplitude images acquired before (right; October 14, 2008) and after (left; January 14, 2009) the earthquakes. They cover almost the same area (6km x 5km) as the AVNIR-2 images. The massive (750m x 2500m) landslide and 500m landslides triggered by the earthquake are revealed in the area enclosed by the red and white circles in the left image of Fig. 4. These results from PALSAR are consistent with those from AVNIR-2. Figure 5 is an animation composed of PALSAR amplitude images before and after the earthquakes.
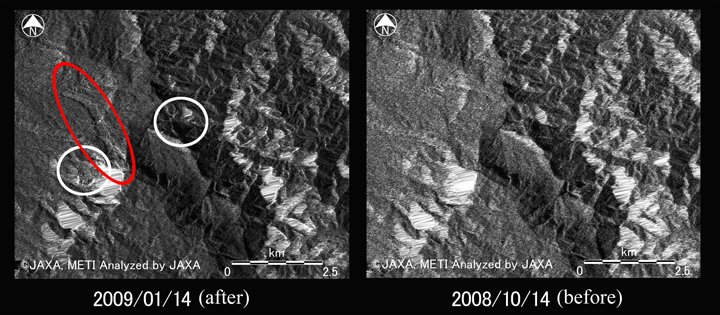
Fig.4: PALSAR amplitude images acquired before (right) and after (left) earthquakes.
(Click to View Enlarged Image)
Fig.5: GIF animation composed of PALSAR amplitude images.
JAXA plans to continue ALOS observations of the afflicted area in Papua, Indonesia.
©JAXA EORC
Copyright©1997- JAXA EORC All rights reserved.