5. Disaster Monitoring
Earthquake Monitoring by Differential Interferometry
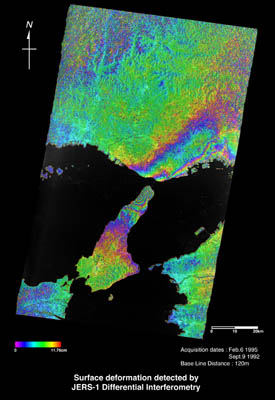
Fig. 1: Surface deformation detected by JERS-1 Differential interferometry.
(Click to View Enlarged Image)
 This shows the crustal movement caused by the Hyogo-Ken-Nanbu Earthquake (M7.2) on Jan. 17, 1995.We used data collected on Sep. 9, 1992 and Feb. 6, 1995 by JERS-1 SAR.
By processing these data with a technique called Interferometric SAR (InSAR), we succeeded in quantifying the crustal movement due to the earthquake. A full color cycle indicates crustal movement of about 12cm.
From this image, you can find crustal movement, which looks like an egg at Northern Awaji Island due to an aberration in the Nojima fault. You can also see that the Earth's crust was transformed over an extensive area, including Akashi and Kobe, from two fault transformations on the side of the mainland.
These outcomes agree with crustal movements measured in a field survey.
Observation data from JERS-1 SAR thus make it possible to quantify crustal movements due to earthquakes and volcanic actions.
Extract from the JERS-1 Earth View published by NASDA EORC
©JAXA EORC