5. Disaster Monitoring
Deformation Detection by Differential Interferometry
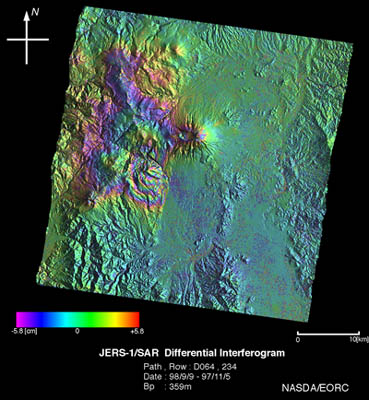
Fig. 1: Differential interferogram around Mt. Iwate.(Click to View Enlarged Image)
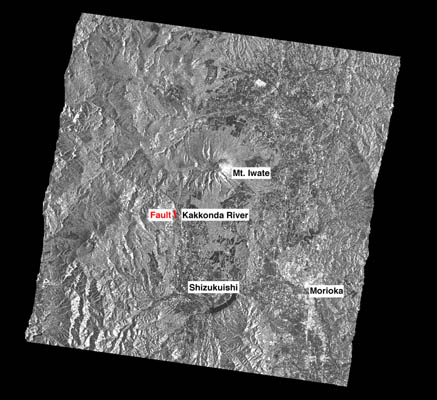
Fig. 2: Amplitude image of JERS-1 SAR.(Click to View Enlarged Image)
 JERS-1 SAR interferometry has revealed a surface deformation on and around Mt. Iwate that might have been caused by a magnitude 6.1 earthquake in the Shizukuishi area at 16:58 (Japan Standard Time) of Sept. 3, 1998 and volcanic activity. This image was derived from the interferometric analysis of two SAR images (Nov. 5 1997 and Sept. 9 1998). The additional corrections are for the topography, orbital errors, and the diffraction changes in height for the two seasons. On the scale bar, light green indicates no surface change; a color change of green->yellow->red, a change approaching the satellite in the line of sight; and green->blue->purple, a change in going away from the satellite. One color cycle represents a change in 11.7 cm. This figure shows two features: 1) a maximum uplift of several centimeters within a triangular area covering Mt. Iwate, Shizukuishi, and Hachimanntai, and 2) a 48 cm maximum uplift was confirmed on the west side of the fault. The second future was verified to agree with the truth data. Due to the lack of the GCPs in the area, it is difficult to verify the first feature. The surface change at the top of Mt. Iwate might be a pseudo deformation caused by the local water vapor distribution.
Extract from the JERS-1 Earth View published by NASDA EORC
©JAXA EORC