4. Land Use Monitoring and Land Cover Classification
Vegetation Types Classified from Multi-temporal JERS-1 SAR image
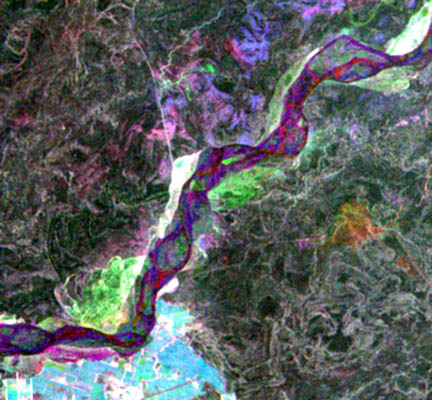
Fig. 1: Overlaid image of multi-temporal JERS-1 SAR(Click to View Enlarged Image)
(red: Sep. 21, 1992, green: Jun. 12, 1993, blue: Aug. 24, 1994).
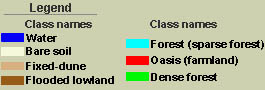
Fig. 2: Classification of vegetation type.(Click to View Enlarged Image)
 This area for JERS-1 SAR data vegetation type analysis is located along the Tarim River, China.
In fig. 1, three scenes (path-row: 173-232) acquired about a year apart (21 September 1992, 12 June 1993 and 26 August 1994; the growing season in the study area), were used to discriminate vegetation types. The images were processed at level 2.1 (standard geocoded image resampled to UTM projection). All images are from the end of spring to the beginning of autumn and are therefore concentrated within the growing season of this area.
This area for JERS-1 SAR data vegetation type analysis is located along the Tarim River, China.
In fig. 1, three scenes (path-row: 173-232) acquired about a year apart (21 September 1992, 12 June 1993 and 26 August 1994; the growing season in the study area), were used to discriminate vegetation types. The images were processed at level 2.1 (standard geocoded image resampled to UTM projection). All images are from the end of spring to the beginning of autumn and are therefore concentrated within the growing season of this area.
There are both dense and sparse surviving forests on both sides of the river and the dry riverbeds. The lands between the forests and moving sand dunes are natural desert steppe, and they are used mainly as rangelands. Many optical sensors have difficulty distinguishing various vegetation types, but it is relatively easy to differentiate vegetation types using multi-temporal JERS-1 SAR data. Many land cover features (i.e., bare land, fixed dunes (including steppe), dense forest, and oasis (including farmland), forest (including sparse forest)) can be distinguished in this image. White and green represent dense forest and forest areas, black and blue represent water (springs) or bare land (sand dunes), and yellow represents farmland (oasis). Red and pink represent seasonally flooded lowlands. For the image in August, the dense forest along the river produces higher NRCSs than dense forest in the June and September images due to the corner reflector effect during the flood season. For the images in August and September, oasis (farmland) areas have relatively high responses and appear as brighter tones in the image. This may be due to stems of the crops or the moisture content of the soil.
The response of vegetation biomass and its seasonal influences on radar signals in the multi-temporal images were clearly shown by the analysis of these data. In particular, depending on their growth status and seasonal changes, the vegetation components affected each temporal image differently. We could thus identify several backscattering sources and group them into several vegetation types.
Figure 2 is a distribution map of vegetation types derived from the color composite JERS-1 SAR data. Here, the supervised maximum likelihood classification was applied to the color composite image (Fig. 1). The obtained results were compared and found generally consistent with the results derived from field investigation and some other published data (some areas, where seasonally changes has occurred, were classified as oasis including farmlands (i. e., the red area in Fig. 2). SAR data can be considered applicable to vegetation type analysis.
Extract from the JERS-1 Earth View published by NASDA EORC
©JAXA EORC