![[ADEOS Home]](../../../../images/ADEOS_HomePage.gif)
![[Directory]](../../../../images/Directory.gif)
![[What's New of the ADEOS web pages]](../../../../images/WhatsNew.gif)
![[EORC Home]](../../../../images/EORC_HomePage.gif)
OCTS Global SST Val Report ( Figure Data Viewer )
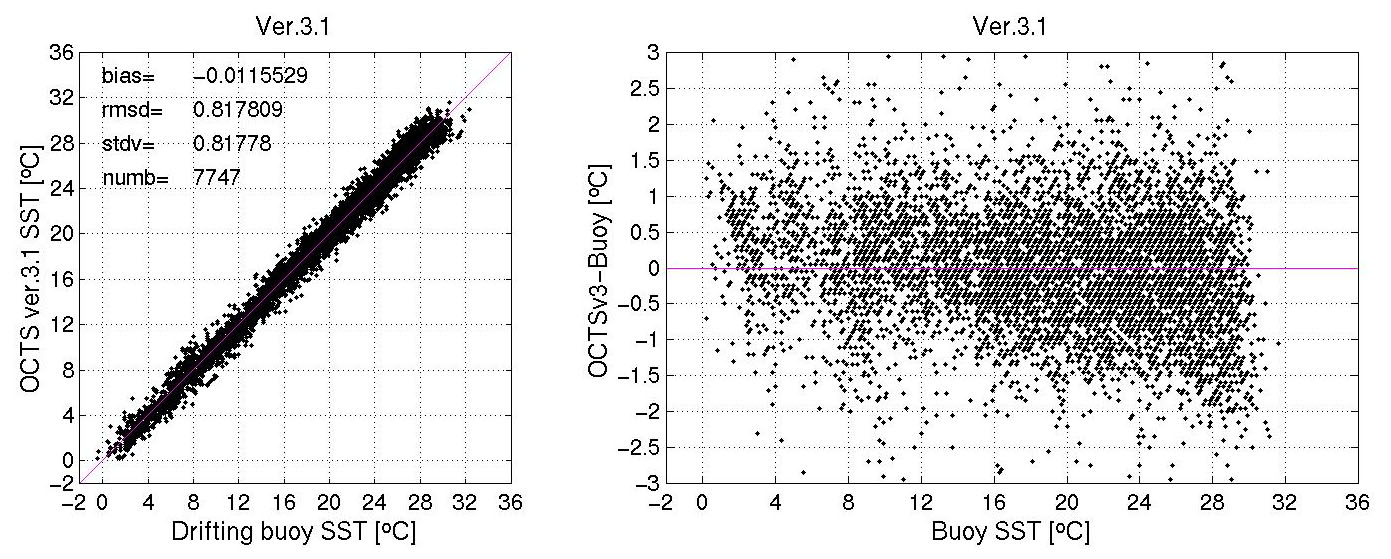
Figure 1
Figure 1 Scatter diagram of Drifter buoy and original L3BMSST.
(Number=7747,Bias=-0.01,RMSE=0.82)
[ Figure1.JPG ; 243 Kbyte ]
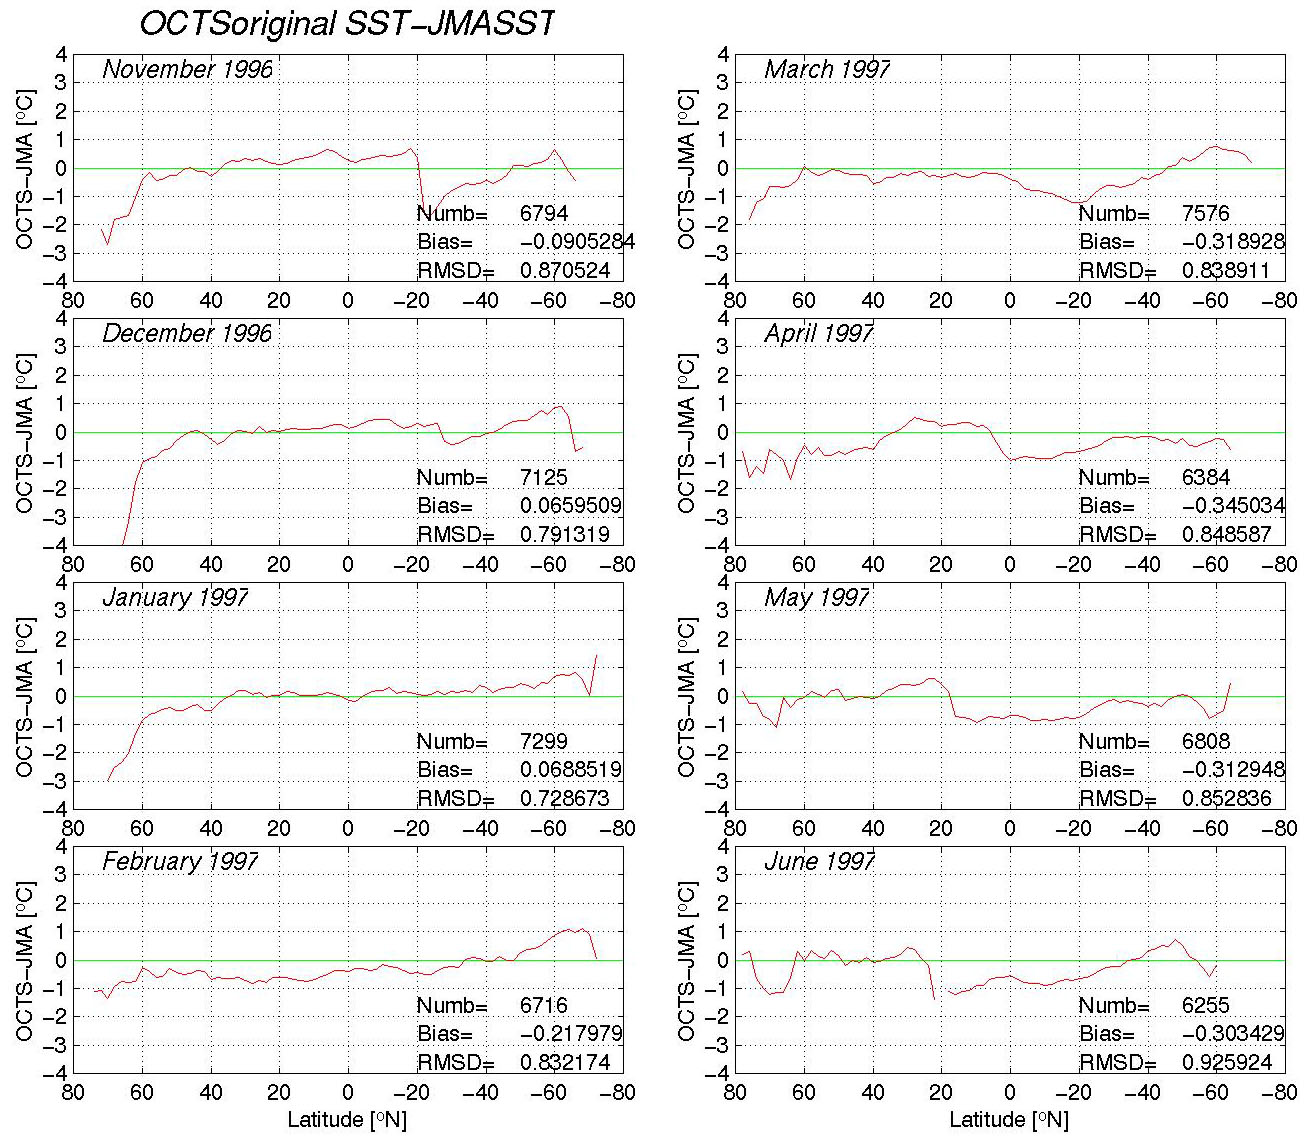
Figure 2
Figure 2 Latitudinal averaged bias of L3BMSST minus JMASST
[ Figure2.JPG ; 405 Kbyte ]
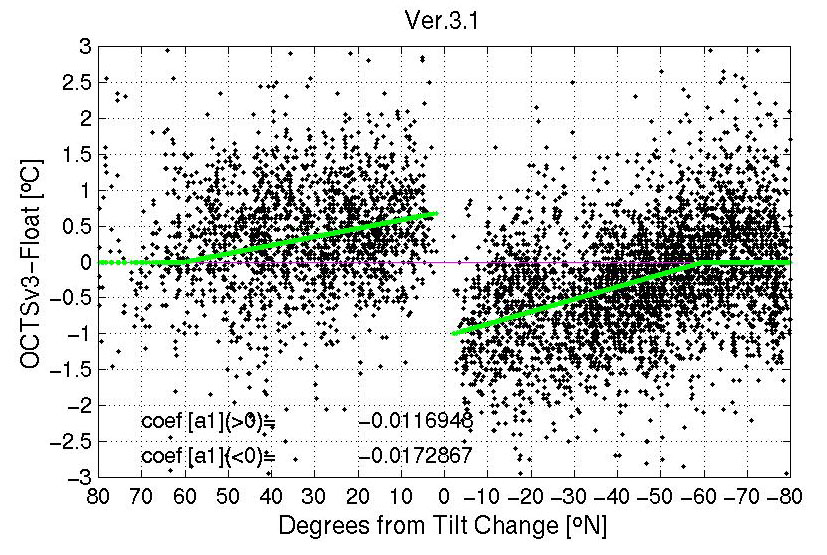
Figure 3
Figure 3 Residual Plots for degrees from Tilt change latitude
[ Figure3.JPG ; 202 Kbyte ]
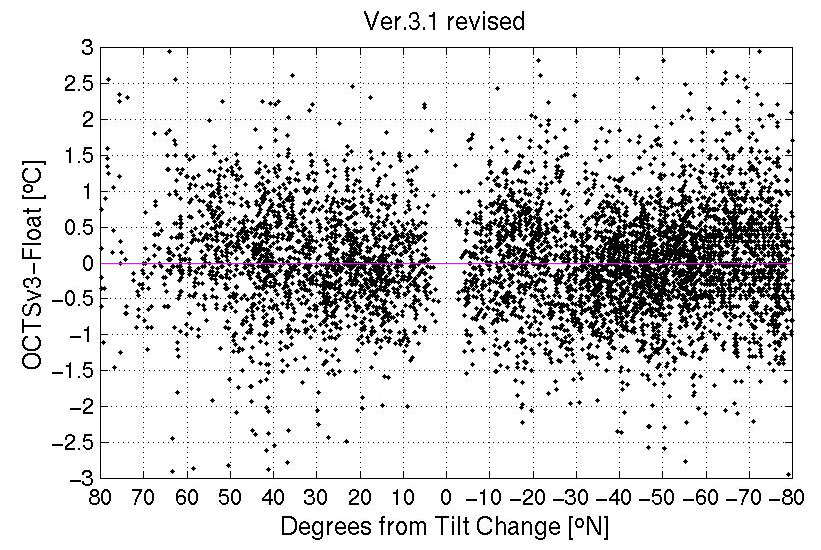
Figure 4
Figure 4 Residual Plots for degrees from Tilt change latitude.
[ Figure4.JPG ; 193 Kbyte ]
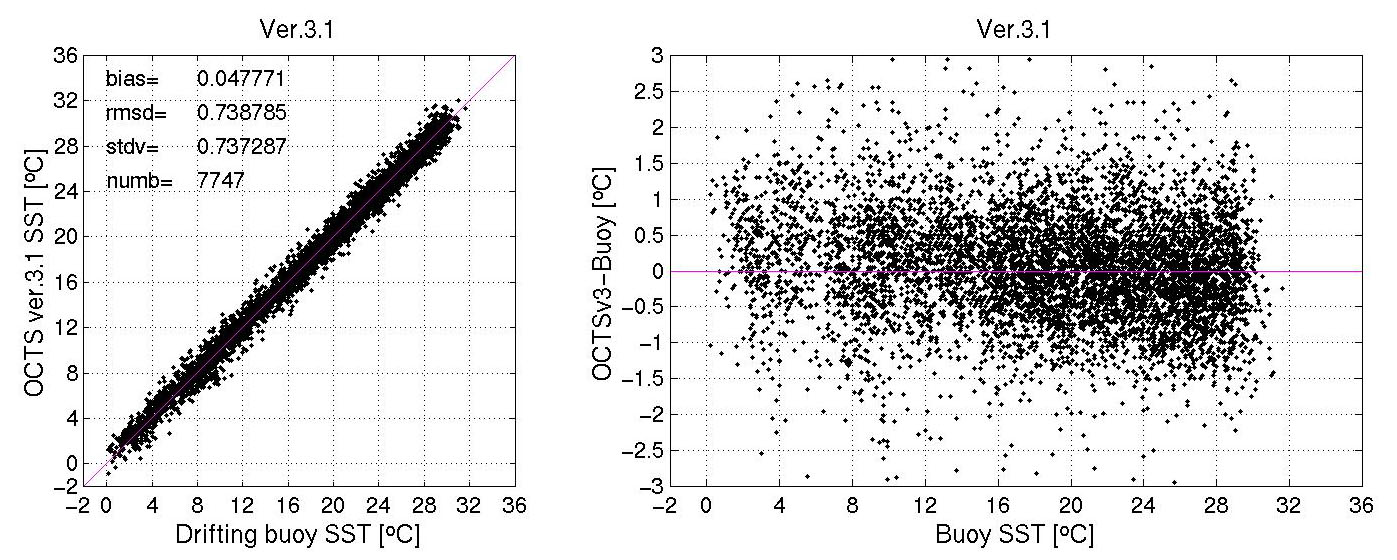
Figure 5
Figure 5 Scatter diagram of Drifter buoy and revised L3BMSST.
(Number=7747, Bias=0.05, RMSE=0.74)
[ Figure5.JPG ; 236 Kbyte ]
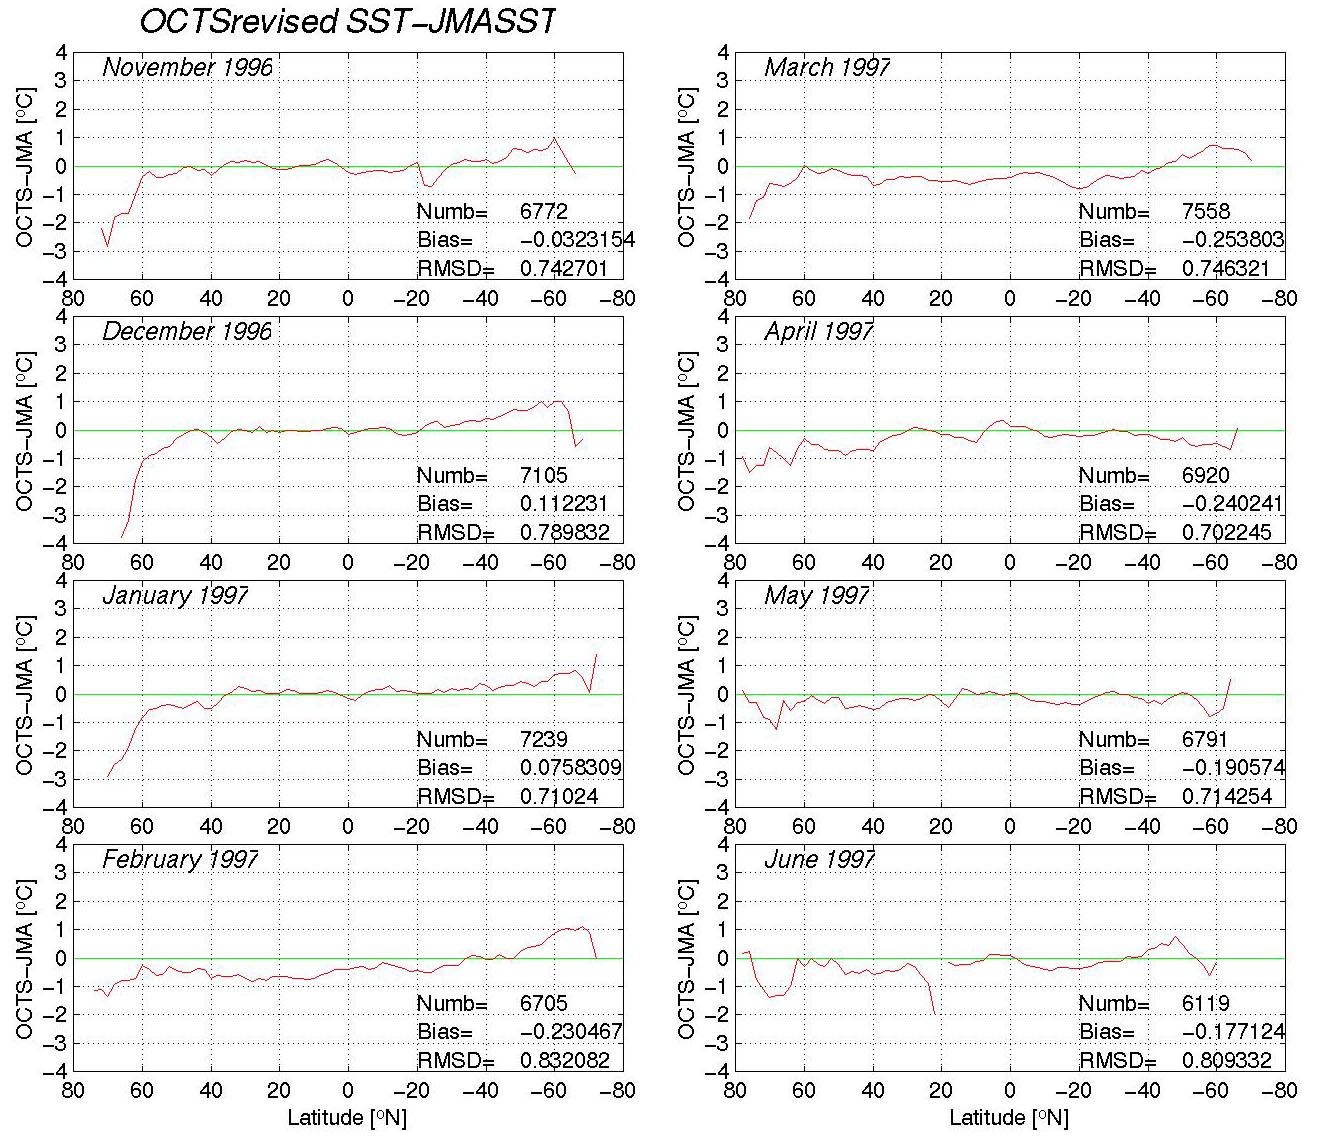
Figure 6
Figure 6 Latitudinal averaged bias of revised L3BMSST minus JMASST
[ Figure6.JPG ; 411 Kbyte ]
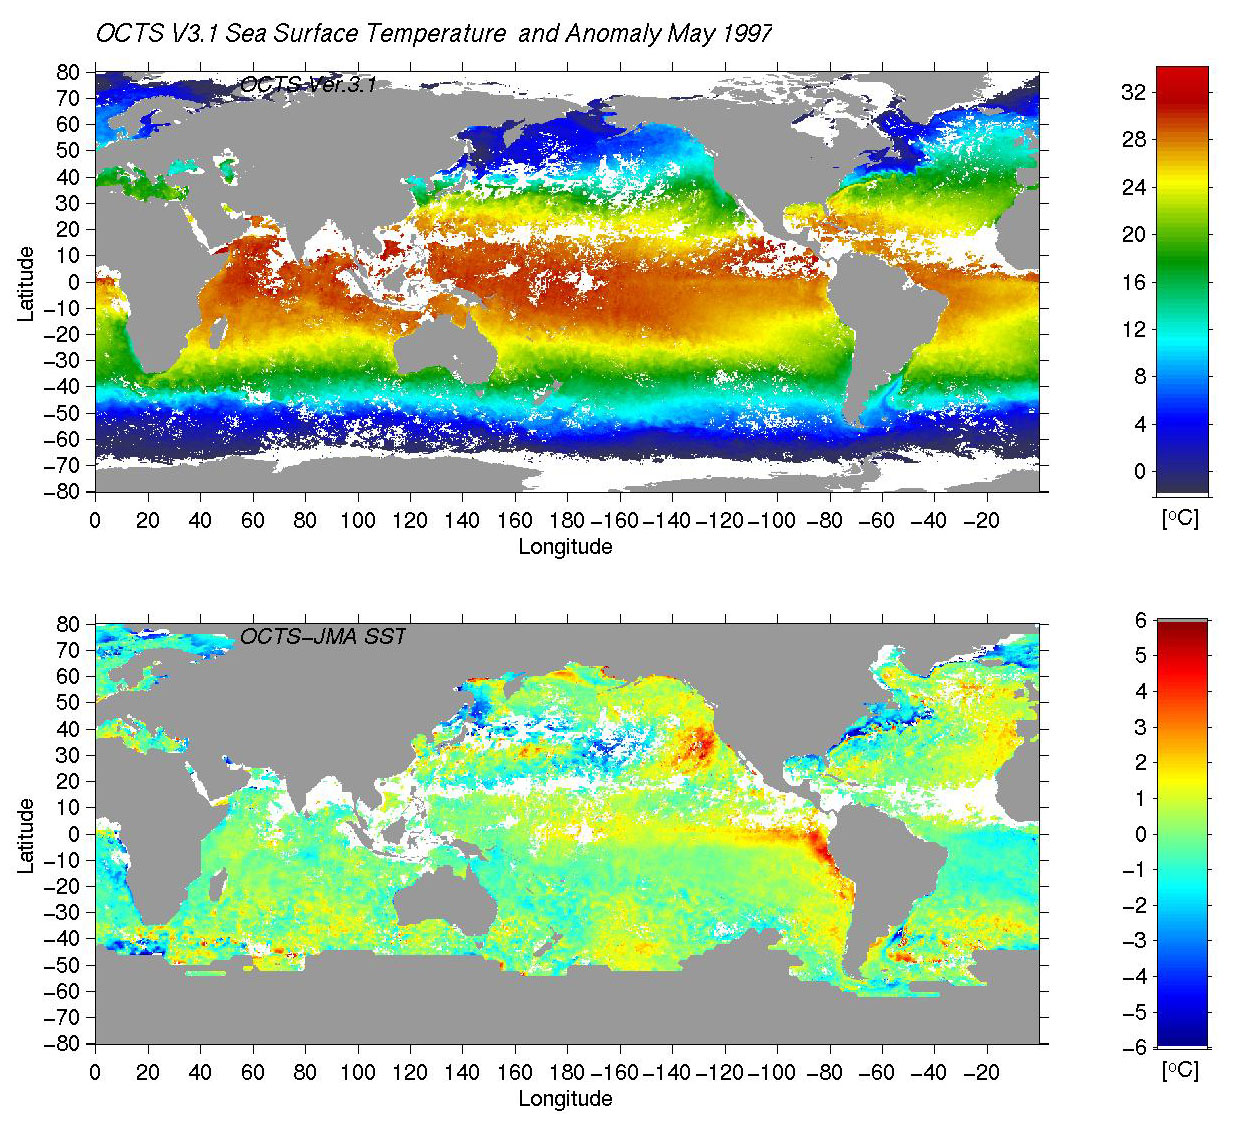
Figure 7
Figure 7 Revised SST and SST anomaly from JMASST.
[ Figure7jma.JPG ; 454 Kbyte ]
- Download Figure -
**************************************************************
Hiroshi Murakami (ÂĽľĺˇˇąŔ)
E-Mail : murakami@eorc.nasda.go.jp
National Space Development Agency of Japan (NASDA)
Earth Observation Research Center (EORC)
**************************************************************

 Earth Observation Research Center
Comments to: adeosdata@eorc.nasda.go.jp
Last Update: 22 October 1998