ページの先頭です。
本文へジャンプする。
【Important Notices】This page is an archive page of information published in the past. Since the update has been completed, it may contain broken links or outdated information. For the latest information, please use the new site Earth-graphy (earth.jaxa.jp).
ここからサイト内共通メニューです。
サイト内共通メニューを読み飛ばす。
サイト内共通メニューここまで。
ここから本文です。

Seen from Space 2014

Climate Change and Carbon Cycle
  - Vegetation as the Moderator of Greenhouse Effect -


Atmospheric carbon dioxide is the greenhouse gas that most significantly influences global warming, according to fossil-fuel consumption associated with daily life and industry, in addition to changes in land use and land cover resulting from deforestation. Atmospheric concentration of carbon dioxide has been increasing since 1750, in which pre-Industrial Revolution levels were approximately 280 ppm in 1750 (Ref. 1). The Japan Meteorological Agency recorded carbon dioxide levels at three domestic measurement points: Ryori in Iwate, Minami-torishima in Tokyo, and Yonakuni-jima in Okinawa. The data measured at Ryori, which recorded the monthly mean in March and April 2012, was 401.2 ppm and 402.2 ppm, respectively, and exceeded 400 ppm as the highest levels documented since 1987 (Ref. 2).
 
An understanding of carbon dioxide and its effect on global climate change is necessary for predicting and modeling its influence on the changing processes of planetary carbon cycles across Earth’s three spherical sub-systems of atmosphere, ocean, and land. Earth observation satellites, in conjunction with in situ measurement, are important tools for understanding the present status of the Earth in the quantitative aspect. On the basis of observation data obtained from the Greenhouse gases Observing SATellite (GOSAT), the National Institute for Environmental Studies (NIES) analyzed atmospheric greenhouse gas concentration, fluxes (absorption and emission) of carbon dioxide through the Earth’s surface, and the observation data related to carbon sequestration, including photosynthesis and respiration in the biosphere. NIES then released products of carbon dioxide absorption and emission estimation data and global atmospheric concentration distribution as Level 4A and 4B products (version 02.01), respectively, on December 5, 2012 (Ref. 3, 4). Such research is used to evaluate global atmospheric carbon dioxide observation data, and the atmospheric transportation model, referred to as the top-down approach, is used to estimate the Earth’s surface status at the bottom of the atmospheric layer in relation to atmospheric conditions. Conversely, the global carbon balance assessment method using both models and surface observation data is referred to as the bottom-up approach. These two approaches are used for comparative experiments and validation, and they contribute toward the reduction of uncertainty and improvement in accuracy of the estimated carbon balance on land and in the ocean. 

Monthly mean image of phytoplankton (chlorophyll-a) concentration in August 2012.
Fig. 1.

Monthly mean image of phytoplankton (chlorophyll-a) concentration in August 2012.

Two ecosystems on the Earth’s surface, the ocean and land, play important roles in the global carbon cycle. The oceanic phytoplankton concentration distribution map (Fig. 1) is a critical source of data for estimating primary carbon production in the ocean. Generally, the concentration is low in the open water and high in coastal zones, in which there are suspended solids in water and aeolian dust-borne yellow sand, clouds, and atmospheric aerosols. Research on atmospheric correction and in-water algorithm improvement 1) (Ref. 5) have been conducted by using former satellites including the Ocean Color Temperature Scanner (OCTS) onboard the Advanced Earth Observing Satellite (ADEOS) and the Global Imager (GLI) onboard Advanced Earth Observing Satellite 2 (ADEOS-II) in Japan. Further,  research and development is ongoing through the exploration of intermediate algorithms obtained from Moderate-resolution Imaging Spectroradiometer (MODIS) data in the next phase of satellite data processing and analysis technology. Thus, because of its vulnerability to both direct and indirect influences of human activity and climate change, the terrestrial ecosystem faces significant challenges from the degradation of its carbon fixation ability. 

The terrestrial ecosystem encompasses grasslands, wetlands, forests, and agro-ecosystems. In the carbon cycle process, carbon fixation occurs through net primary production (NPP) in plants after absorption of carbon dioxide through photosynthesis, which is estimated from the direct measurement of plant growth. NPP is usually defined as the total amount of primary production in one year and is the difference (NPP = GPP - R) between gross primary production (GPP) and respiration (R; Ref. 6, 7). Furthermore, through the measurement of the physiological characteristics of plants; such as the rates of photosynthesis, respiration, and soil respiration; and related environmental conditions; such as changes in temperature and moisture levels as a consequence of their association with the carbon cycle; a knowledge database of NPP estimation models of various ecosystems according to location and plant species has been constructed.
 
Through this research, the NPP overviews by species have been examined with unknown vegetation distributions, which, together with the use of identical satellite-borne sensors, have led to consistent mapping of global NPP distribution. However, with regard to the occurrence of recent dramatic climate change, it is necessary to develop a more precise method of estimation by which to validate rapid NPP variations. Therefore, in assessing the effects of climate change, the construction of a model based on the carbon cycle process to improve accuracy, in addition to the parameterization of the process model based on vegetation types and luminous environment data derived from the classification and analysis by using satellite remote sensing data, presents a significant challenge. Based on data from global Earth observation satellites, which periodically observe the entire planet, estimation of NPP as an index is used to quantitatively evaluate the potential of carbon fixation in terrestrial ecosystems such as the forest resources, and to obtain information on environmental factors such as the Normalized Difference Vegetation Index (NDVI), photosynthetically available radiation (PAR), and solar radiation on the Earth’s surface. For such evaluation, water stress trends (WSTs), used to indicate wet or dry conditions, need to be determined. Specific information derived from MODIS data are shown in the following global distribution images.

Cloud-free color composite Normalized Difference of Vegetation Index (NDVI: 0.0~1.0) image of monthly mean index derived from data obtained during August 2012, which shows vegetation cover. Deviation of index from August 2012 from the nine-year mean of 2002~2010 (-0.2~0.2).
Fig. 2. Upper image: Cloud-free color composite Normalized Difference of Vegetation Index (NDVI: 0.0~1.0) image of monthly mean index derived from data obtained during August 2012, which shows vegetation cover.
Lower image: Deviation of index from August 2012 from the nine-year mean of 2002~2010 (-0.2~0.2).

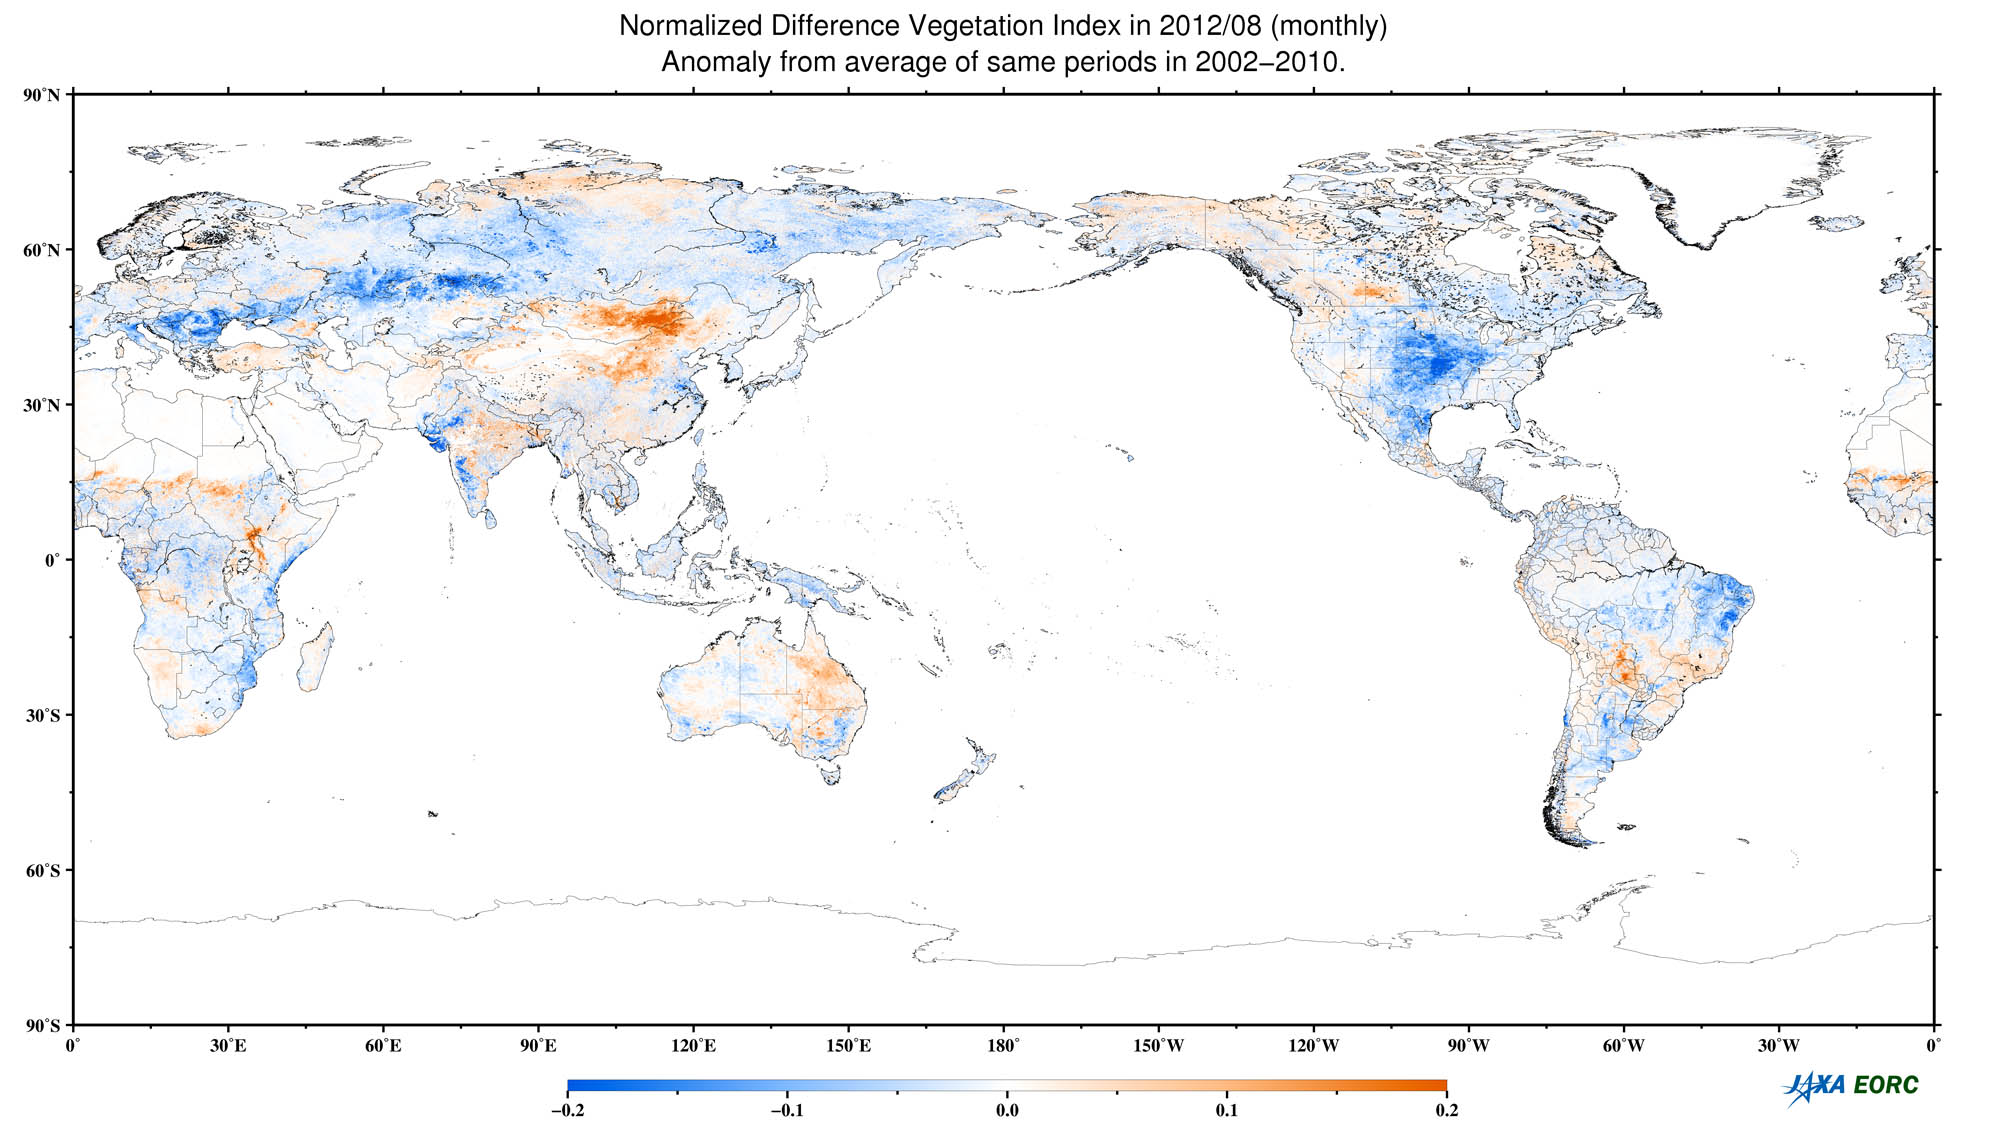
As shown in the upper image of Fig. 2, the vegetation cover index, as indicated by the color bar at the bottom of the map, shows that the area of the largest tropical rainfall forest in the Amazon River Basin of South America and the tropical rainfall forests in central Africa and southeast Asia nearly reach the highest value of 1.0, which is represented on the map by the deep green color. In these forest areas, vegetation is highly dense and active as carbon sinks that fix a substantial amount of carbon. In the index deviation map for August 2012 shown in the lower image of the figure, the red color shows a higher index value of 0.2 compared with the nine-year mean value, and the blue color shows a lower value of -0.2. This map indicates that the blue area representing the central region of the United States, where vegetation activities and densities are lower than normal, suffered the apparent effects of a drought in summer 2012.

Global photosynthetically available radiation (PAR) distribution map showing the monthly mean in August 2012.
Fig. 3. Global photosynthetically available radiation (PAR) distribution map showing the monthly mean in August 2012.

The PAR map shown in Fig. 3 indicates a comparatively weak area in the north Amazon River basin and, conversely, a strong area in the south, which appears to be caused by differences in cloud cover.

Cloud-free color composite Normalized Difference of Vegetation Index (NDVI: 0.0~1.0) image of monthly mean index derived from data obtained during August 2012, which shows vegetation cover. Deviation of index from August 2012 from the nine-year mean of 2002~2010 (-0.2~0.2).
Fig. 4. Upper image: Land surface temperature monthly mean recorded in August 2012, shown by the color bar at the bottom of the image.
Lower image: Water stress trend (WST) monthly mean recorded in August 2012. Moisture levels are indicated by the gradations of red for dry areas and blue for wet areas.

The land-surface temperature map obtained during August 2012 (Fig. 4, upper image) shows wide areas of high temperature in the Sahara Desert in North Africa, the Arabian Peninsula, the plateaus of Iran, and central Asia, in addition to a relatively high-temperature area in the Midwestern United States. WSTs observed during the same period show a widespread dry area in the western United States. Vegetation activity and distribution coverage data, in addition to environmental factors, are processed and analyzed with medium-resolution (250~1,000 m) and frequent observation data obtained by MODIS sensors onboard Aqua and Terra satellites through the process of cloud-free, color-composite image processing. The processed data can also produce quantitative and visualized information of seasonal and annual changes in vegetative carbon fixation, which can be useful for developing methods to combat global warming (Ref. 8, 9). By improving the accuracy and quality of Earth observation data and environmental information obtained by the Second-Generation Global Imager (SGLI) onboard the Global Change Observation Mission-Climate (GCOM-C), two enhancements are expected to be realized: (1) attaining a high level of climate change prediction and (2) rapid acquisition of observation results from global space agencies.


Reference literature

1) Teruyuki Nakajima, Hiroshi Murakami, Masahiro Hori, Takashi Y. Nakajima, Hirokazu Yamamoto, Joji Ishizaka, Ryutaro Tateishi, Teruo Aoki, Tamio Takamura, Makoto Kuji, Nguyen Dinh Duong, Akiko Ono, Satoru Fukuda and Kanako Muramatsu: Overview and science highlights of the Advanced Earth Observing Satellite 2 (ADEOS-II)/Global Imager (GLI) project, J. Rem. Sens. Soc. Japan, Vol. 29, No. 1, pp. 11–28, 2009.

Reference sites


(Ref. 1) National Institute for Environmental Studies (NIES), Globe No. 19, Global Warming projected by the leading edge climate model. (in Japanese)
(Ref. 2) Japan Meteorological Agency (JMA) press release (May 16, 2012), The atmospheric carbon dioxide concentration in Japan (in Japanese).
(Ref. 3) On estimating global monthly carbon dioxide fluxes by region, utilizing the observational data obtained by the Greenhouse gases Observing SATellite (GOSAT) Ibuki, Japan Aerospace Exploration Agency (JAXA), National Institute for Environmental Studies (NIES), Ministry of Environment (MOE), October 28, 2011.
(Ref. 4)

Greenhouse gases Observing SATellite (GOSAT) project newsletter, No. 25, December 2012

(Ref. 5) Hiroshi Murakami, Kohtaro Hosoda, Katsuya Saitoh: Japan Aerospace Exploration Agency/Earth Observation Research Center (JAXA/EORC), Observing our planet Earth using Global Imager, improving our understanding of climate change, Marine Environ. Living Res., chapter 6, pp. 46–51, (2006).
(Ref. 6) Yoshio Awaya, Eiji Kodani, Dafang Zhuang: Terrestrial net primary production (NPP) estimation using satellite data, Earth Environ., Vol. 9, No. 2, pp. 231–238 (2004) (in Japanese).
(Ref. 7) Akiko Ono, Hirokazu Yamamoto: Japan Aerospace Exploration Agency/Earth Observation Research Center (JAXA/EORC), Observing our planet Earth using Global Imager, improving our understanding of climate change, Vegetation, chapter 5, pp.39–45, (2006).
(Ref. 8) Global Change Observation Mission-Climate (GCOM-C) Monitoring for Environmental Studies.
(Ref. 9) Japan Aerospace Exploration Agency/Earth Observation Research Center (JAXA/EORC), JAXA Satellite Monitoring for Environmental Studies (JASMES).

Explanation of the Images:


Satellite: Terra, Aqua, NASA
Sensor: Moderate Resolution Imaging Spectroradiometer (MODIS), NASA
Date: August 2012

本文ここまで。
image:Satellite Navigator
image:Satellite Applications and Operations Center(SAOC)
Earth Data Collection by JAXA Satellites
image:ページTOP