ページの先頭です。
本文へジャンプする。
【Important Notices】This page is an archive page of information published in the past. Since the update has been completed, it may contain broken links or outdated information. For the latest information, please use the new site Earth-graphy (earth.jaxa.jp).
ここからサイト内共通メニューです。
サイト内共通メニューを読み飛ばす。
サイト内共通メニューここまで。
ここから本文です。

Seen from Space 2012

Climate anomalies in Australia (2002 to 2010)

 
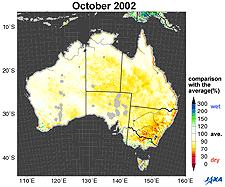
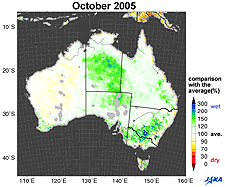
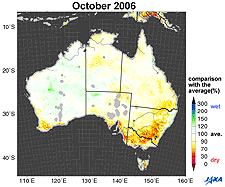
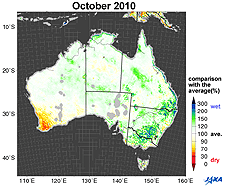
Changes in soil moisture in Australia(2002)Changes in soil moisture in Australia(2005)Changes in soil moisture in Australia(2006)Changes in soil moisture in Australia(2010)
Fig.1. Changes in soil moisture in Australia (October 2002, 2005, 2006, 2010)
Yellow to red shows areas that are drier than the average

Figure 1 shows a comparison between the average values of soil moisture*1 (2002 to 2010) in Australia and the values corresponding to October 2002, 2005, 2006, and 2010, as observed by the Advanced Microwave Scanning Radiometer for EOS (AMSR-E)*2. Areas colored yellow to red are drier than the average.
Australia suffered severe droughts from 2002 to 2003. A long drought in 2006 was particularly severe in historical terms. As shown in Figure 1, the southeastern area was wet in 2005 and 2010, but became drier in 2002 and 2006.
Australia’s land area is 7.7 million km2, around twenty times that of Japan (0.38 million km2). Over half of the Australian land area is used for agriculture, but the cultivated land accounts for 0.24 million km2, which accounts for just 6% of the agricultural land and 3% of the total land. Over 90% of agricultural land is used for pasturage of beef cattle and sheep. Crops are planted in the states of Western Australia and New South Wales, located in the southwest and southeast of the country, respectively. Pastures are spread over large areas in the state of Queensland, in the northeastern part of the country.

*1) Soil moisture represents the proportion of moisture contained in a unit volume of soil. When soil absorbs moisture and reaches saturation, the soil moisture is around 50%.
*2) ASMR-E was developed by the Japan Aerospace Exploration Agency (JAXA) and is onboard NASA’s Earth-observing satellite, Aqua. It was launched in 2002 and had since collected data of ocean surface temperature, precipitation, soil moisture, and ice caps in the Arctic Ocean. On October 4, 2011, the AMSR-E observation and antenna rotation automatically halted because the antenna rotation friction had reached the limit (40 rotations per minute) necessary for regular observations.

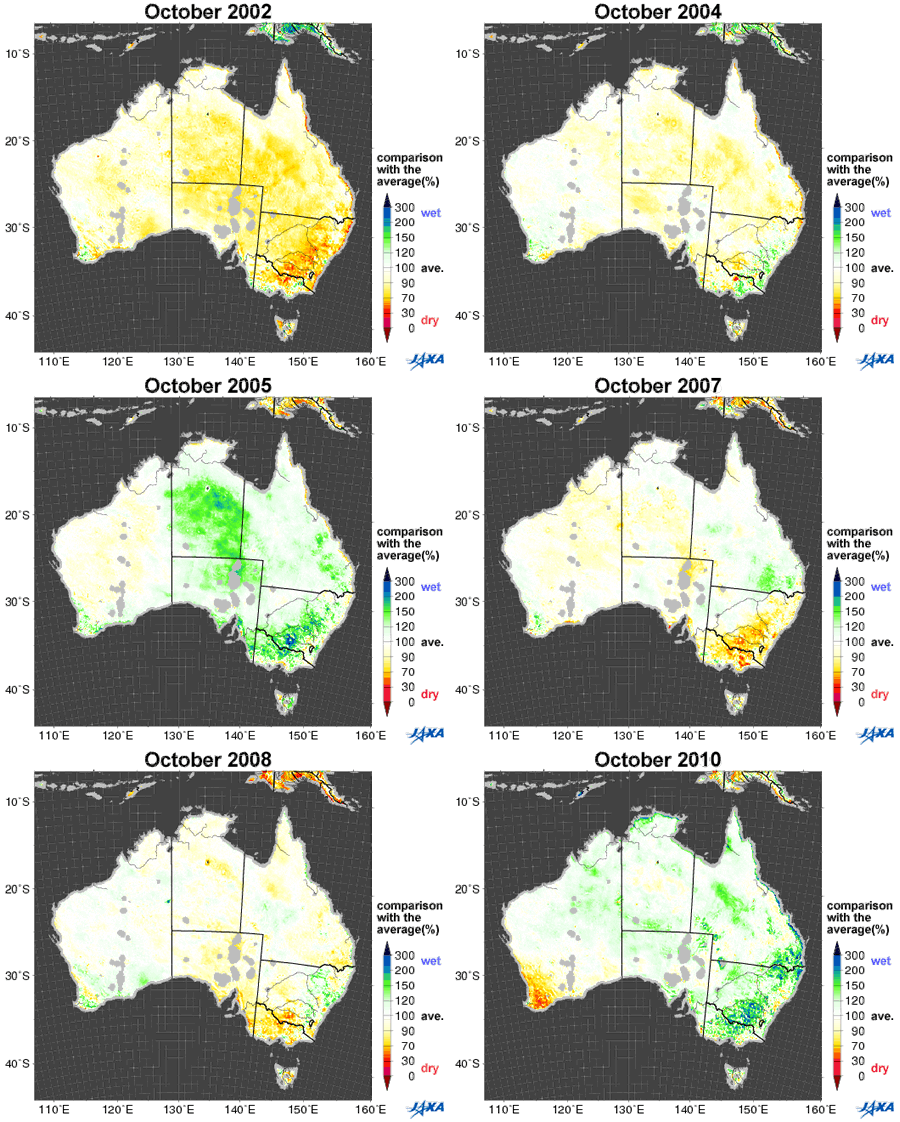
Changes in soil moisture in October from 2002 to 2010
Fig. 2. Changes in soil moisture in October from 2002 to 2010
Comparison of October soil moisture with the average October soil moisture for 2002-2010

Figure 2 shows yearly changes in soil moisture in October from 2002 to 2010. AMSR-E images indicate the dryness of the soil in 2002 and successive years from 2006. Wheat is the main crop in Australia and is planted over half the cultivated land. The major areas under wheat cultivation are located in the southwest and east of the country, and they correspond to the areas that suffered severe dryness during the study period.

Vegetation index of Australia(2002)Vegetation index of Australia(2005)Vegetation index of Australia(2006)Vegetation index of Australia(2010)
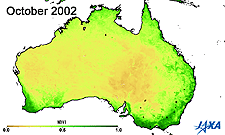
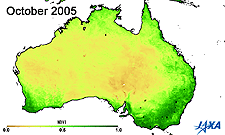
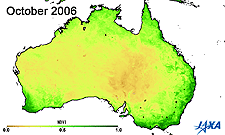
Fig. 3. Vegetation index of Australia (October 2002, 2005, 2006, and 2010)
Green indicates greater plant activity

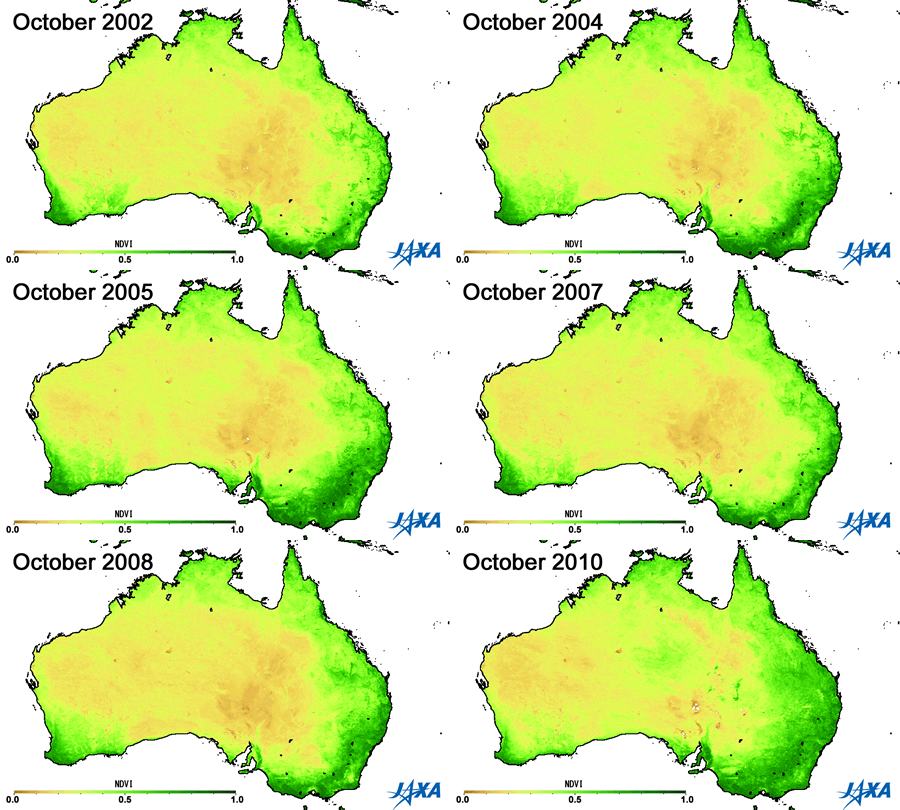
Changes in vegetation index in October from 2002 to 2010
Fig. 4. Changes in vegetation index in October from 2002 to 2010

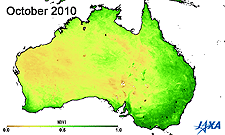
Figures 3 and 4 show the vegetation index*3 obtained from observations made by MODIS aboard the American Earth observing satellite, TERRA. The area of high vegetation activity (shown in green) is small in 2002 and 2006 but large in 2005 and 2010. The vegetation index can help determine areas of low soil moisture and droughts.

*3) A higher vegetation index indicates increased health and activity of vegetation.

Historically, droughts have occurred in Australia every 10 years. However, Australia had been thrice hit by drought (2002, 2006, and 2007) since 2000. In particular, the drought of 2006 was the worst such even in the past 100 years. Australia has vast land areas and mixed climates. Droughts happen frequently in some areas, whereas other areas are hit by floods.
The recent abnormal climate results in a reduction in the supply of grains, leading to increase in the demand for grain. Therefore, the decrease in crops due to the drought in Australia accelerates the global food crisis. Crop yields during 2002 and 2006 were half of the average. The Australian government has prioritized measures to increase the productivity and to counteract the effects of climate change.


Explanation of the Images:


Satellite: Earth Observing System, Aqua, NASA
Sensor: Advanced Microwave Scanning Radiometer for EOS (AMSR-E)
Date: October 2002 to October 2010 (Fig. 1 and Fig. 2)

Satellite: Earth Observing System, Terra, NASA
Sensor: Moderate Resolution Imaging Spectroradiometer (MODIS), NASA
Date: October 2002 to October 2010 (Fig. 3 and Fig. 4)
本文ここまで。
image:Satellite Navigator
image:Satellite Applications and Operations Center(SAOC)
Earth Data Collection by JAXA Satellites
image:ページTOP