Seen from Space 2004
Typhoons bring disasters and heavy rainfall in 2004
|
Torrential rainfall from Typhoon No. 15 (MEGI), which passed through western Japan, caused heavy damage in the Shikoku area. The typhoon also produced much damage in Korea Many typhoons came closer to Japan and caused serious disasters this year. Eighteen typhoons have been spawned this year, compared to fourteen in a usual year. (Tracks of this year's typhoon No. 14 (MALAKAS) can be found here.) Six typhoons struck the Islands of Japan during this year; the average number is 2.6. Many typhoons have developed in the northern areas. Typhoons No. 10 (NAMTHEUN) and No. 11 (MALOU) developed near Japan and struck the Islands of Japan, bringing more than 1000mm of rainfall and causing severe flooding over the Shikoku area and the Kii Peninsula. The two typhoons brought one-fourth of the annual rainfall.
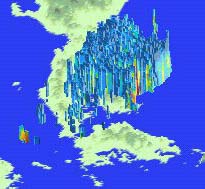
Figure 1 depicts the cloud and rainfall distributions captured by the Precipitation Radar (PR) of the Tropical Rainfall Measuring Mission (TRMM) satellite and GOES-9 around 0300 JST 1 August 2004. The PR can detect the rain rate in the upper atmosphere as well as at the ground surface. Light blue and red indicate weak and strong rain rates. This figure shows a strong rain rate at 3km height over the Shikoku area. Figure 2 illustrates the three-dimensional rain structure of the Typhoon with a vertical cross section moving from west to east. The blocks indicate rain top heights. A high rain top tends to produce strong rainfall at the surface. The highest rain top reaches 13km, which in this case indicates very strong rainfall. The strength and top height of rain depend on the location, and the rain clouds have very complicated structures.
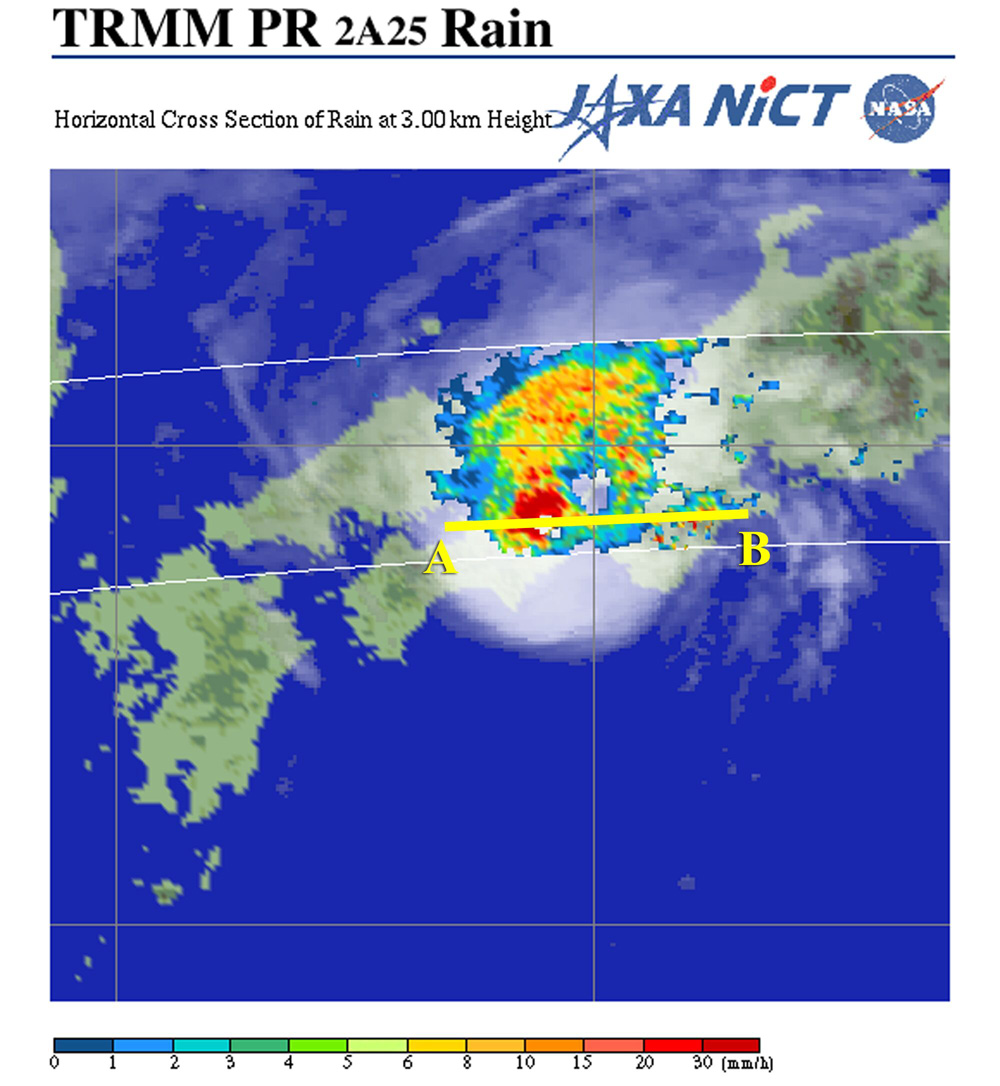
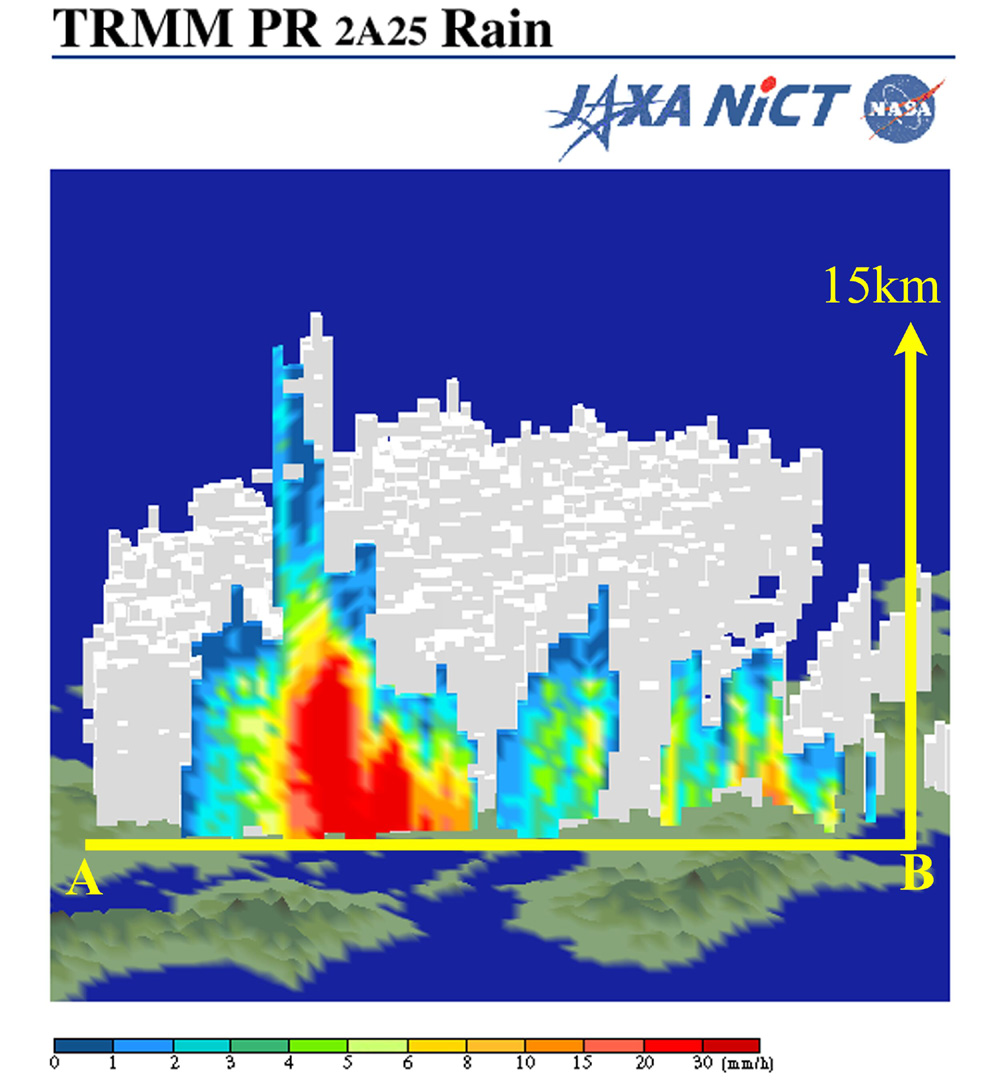
Figures 3 and 4 present the rain rate distribution associated with Typhoon No. 11 (MALOU) at 3km height and a three-dimensional structure with a vertical cross section along line A-B in Fig. 3 at 2300 JST 4 August 2004. Though Typhoon No. 11 was tiny, it had a very high rain top (15km height) and strong rainfall. Heavy rainfall is sometimes intensified by intrusion of warm and humid air from the typhoon. A typical case was the severe flood caused by Typhoon No.15 (MEGI). TRMM was scheduled to terminate observation in July, but its operation will be extended through the end of 2004 at the request of the National Oceanic and Atmospheric Administration (NOAA). The extension will provide data during another typhoon season.(*) You can see the latest typhoon images in the TRMM Tropical Cyclone quick report. (*)TRMM observed the detailed structures of severe rainfall over the Fukui area as well as typhoons with heavy rain.
Related sites: |