|
In September 19, NASDA began distributing higher-level products of the Advanced Microwave Scanning Radiometer for EOS (AMSR-E) that is flying on NASA's EOS Aqua satellite.
AMSR-E quantitatively observes water-related geophysical parameters on a daily basis. It is expected to contribute to understanding the mechanisms of global water and energy cycle and to help improve weather forecasting.
Higher-level products include geophysical parameters that are used more directly in research and applications than brightness temperatures. These geophysical parameters are estimated by combining multi-frequency and dual-polarized brightness temperatures. Currently available geophysical parameters include sea-surface temperature, sea-surface wind speed, integrated water vapor amount, precipitation, and sea-ice concentration. Please visit the homepages shown below for further data descriptions and contact points for data distribution.
Related information about Aqua
 http://www.eorc.jaxa.jp/en/about/distribution/info/aqua.html http://www.eorc.jaxa.jp/en/about/distribution/info/aqua.html
EORC AMSR/AMSR-E Webpage
http://sharaku.eorc.jaxa.jp/AMSR/index.html
EORC Information about AMSR-E data release
http://sharaku.eorc.jaxa.jp/AMSR/data_re/index.html
[ Examples of AMSR-E data application ]
- Heat wave in Europe, 2003 summer
Europe suffered from unusually high temperatures in the summer of 2003. The image indicates the difference of average brightness temperatures in the 10-GHz frequency channel for August 10 to 15, 2002 and 2003, observed by NASDA-developed AMSR-E flying on NASA's Earth-observing satellite Aqua. Brightness temperatures of a low-frequency channel mainly represent land-surface temperature and may reflect surface air temperature. Areas of positive values indicate that the air temperature of the region is higher in 2003. Yellow or orange parts in France, Germany, Czech, and northern Italy represent temperatures over 10 degrees higher than in the previous year. Locally red parts in northern Italy and France do not represent actual temperatures but noise due to interference from ground signals at the same frequency as AMSR-E.
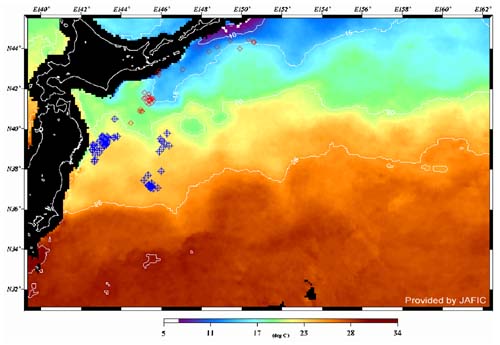
- Fishery application of AMSR-E derived sea-surface temperature (SST)
The upper image depicts the averaged global sea-surface temperature (SST) from September 3 and 5, 2003. Microwave measurements provide the capability of observing SST under clouds and quickly acquiring complete SST distribution without missing values. Positions of fishing grounds superimposed on the AMSR-E SST are shown in the lower image. The image was analyzed and provided by the Japan Fisheries Information Service Center (JAFIC). Blue markers indicate fishery grounds for bonito, and red markers, grounds for saury. It can be seen that the fishing grounds of saury are found in cold waters of the Oyashio System, and those of bonito, in warm waters of the Kuroshio System. In addition, the image indicates that the fishing grounds are concentrated where areas of warm water flows into the colder water or SST sharply changes (current rip). Satellite SST will provide the information of potentially good fishery grounds and may promote efficient operation of fishing vessels. Cloud-penetrating observation of AMSR-E will provide continuous information of SST even in the higher latitude regions (above 38 degrees of latitude) that TRMM/TMI was unable to observe and is thus expected to promote fishery applications.
- Observation of Typhoon No. 14 by AMSR-E
AMSR-E observed Typhoon No. 14 that approached Miyako Island on September 10 and caused great damage to the area. These images illustrate the distribution of precipitation (left) and water vapor (right) estimated from AMSR-E data. In both images, colors varying from blue to red indicate increasing values of precipitation or water vapor. Heavy rainfall areas surround the center of the typhoon. The water vapor image reveals that the effect of the typhoon is already extending to the Kyusyu area. Since observations of precipitation and water vapor over the oceans far from land are very sparse, AMSR-E measurements are expected to be incorporated into the numerical weather forecast models and contribute to improving predictions of typhoon tracks and weather forecasts. In addition, AMSR-E, in combination with the AMSR on board Midori-II, provides more frequent observation.
|


