Daily images of rainfall and sea surface temperature observed by TRMM, and satellite orbit information can be found at "Monitoring" page. Information of events such as heavy rainfall and El Nino is archived at "Topics" page.
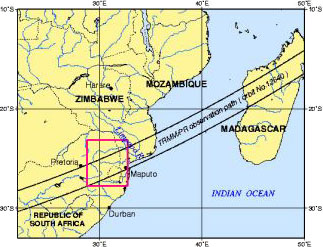
Map of Mozambique in southern Africa. The red square is the area of Fig. 2. The black line is the area observed by TRMM/PR.
These are images of heavy rain over the frontier area of Mozambique located in southern Africa and the Republic of South Africa acquired by TRMM on February 7, 2000. Figure 1 shows the area observed by PR.
3-D rainfall (left) and horizontal distribution (right) acquired by TRMM/PR on February 7, 2000. Heavy rain fell intermittently for several weeks, causing flooding in the Limpopo River.
Figure 2 shows the 3-D rainfall image on the right and the horizontal distribution on the left based on data acquired by TRMM/PR (the area indicated in red square in the figure). TRMM/PR observes the precipitation in a wide area at rates exceeding 30mm/hour.
The background shows the sea level, with darker shades of green indicating higher altitudes above sea level.
Rainfall for observed by TRMM/PR over Mozambique in February 1999(left) and February 2000 (right).
Heavy rain fell intermittently for three weeks from Feb. 26, 2000. In February 2000, the precipitation system produced rainfall at a rate exceeding 500mm a month in the damaged area. This rate is several times the normal yearly rates.
As a result, rainwater flowed into the valley of the Limpopo River and caused a flood. According to newspapers, the Limpopo River is usually 10 km wide, but reached a maximum width of 125km. The surrounding villages were inundated,
causing the worst damage in 50 years. Several thousand people were killed and a million people were injured or suffered. Eastern and southern Africa have experienced abnormal weather including droughts in 1996 and 1997, concentrated rain in 1998, and a drought again in 1999.
This is expected to be related to weather changes such as global warming.